

Abstract
BACKGROUND
The 340B Drug Pricing Program entitles qualifying hospitals to discounts on outpatient drugs, increasing the profitability of drug administration. By tying the program eligibility of hospitals to their Disproportionate Share Hospital (DSH) adjustment percentage, which reflects the proportion of hospitalized patients who are low-income, the program is intended to expand resources for underserved populations but provides no direct incentives for hospitals to use financial gains to enhance care for low-income patients.
METHODS
We used Medicare claims and a regression-discontinuity design, taking advantage of the threshold for program eligibility among general acute care hospitals (DSH percentage, >11.75%), to isolate the effects of the program on hospital–physician consolidation (i.e., acquisition of physician practices or employment of physicians by hospitals) and on the outpatient administration of parenteral drugs by hospitalowned facilities in three specialties in which parenteral drugs are frequently used. For low-income patients, we also assessed the effects of the program on the provision of care by hospitals and on mortality.
RESULTS
Hospital eligibility for the 340B Program was associated with 2.3 more hematologist–oncologists practicing in facilities owned by the hospital, or 230% more hematologist–oncologists than expected in the absence of the program (P = 0.02), and with 0.9 (or 900%) more ophthalmologists per hospital (P = 0.08) and 0.1 (or 33%) more rheumatologists per hospital (P = 0.84). Program eligibility was associated with significantly higher numbers of parenteral drug claims billed by hospitals for Medicare patients in hematology–oncology (90% higher, P = 0.001) and ophthalmology (177% higher, P = 0.03) but not rheumatology (77% higher, P = 0.12). Program eligibility was associated with lower proportions of low-income patients in hematology–oncology and ophthalmology and with no significant differences in hospital provision of safety-net or inpatient care for low-income groups or in mortality among low-income residents of the hospitals’ local service areas.
CONCLUSIONS
The 340B Program has been associated with hospital–physician consolidation in hematology–oncology and with more hospital-based administration of parenteral drugs in hematology–oncology and ophthalmology. Financial gains for hospitals have not been associated with clear evidence of expanded care or lower mortality among low-income patients. (Funded by the Agency for Healthcare Research and Quality and others.)
The federal 340B drug Pricing Program allows qualifying hospitals to purchase outpatient drugs at substantial discounts and to dispense or administer them to patients while receiving standard reimbursements from insurers.1,2 The program was created in 1992, but few hospitals participated until eligibility was expanded for general acute care hospitals in 2003 and for other categories of hospitals in 2010. After 2003, the program grew rapidly, with 42% of general acute care hospitals participating by 2012.
The program is explicitly intended to encourage hospitals to dedicate resources generated from the discounts to expanding or improving care for vulnerable populations, particularly those served by safety-net providers.3–5 Accordingly, in assessing eligibility, the program favors hospitals that disproportionately serve low-income patients, but it does not require or provide incentives for hospitals to repurpose financial gains to enhance care for underserved patients. Rather, the discounts — which range from 20% to 50% — only strengthen the incentives for hospitals to supply drugs to patients who have generous insurance coverage.5,6 The extent to which hospitals support the mission of the program is subject to minimal oversight.7
Thus, the program may not elicit the intended responses from hospitals — such as providing more care to low-income communities, investing in safety-net providers, or reducing health disparities — and may even have unintended consequences.8 In particular, the program may have induced provider consolidation. Particularly in the case of parenteral drugs that are infused or injected in clinical facilities (i.e., drugs reimbursed by Part B in Medicare), hospitals qualifying for the program have incentives to employ physicians and acquire or open practices with physicians who frequently order parenteral drugs, in order to increase referrals and expand capacity for outpatient drug administration. Hospitals are reimbursed for parenteral drugs when they are administered in hospital-owned facilities, including off-campus practices owned by hospitals.9–11
The primary objective of this study was to assess the extent to which hospitals have followed program incentives by acquiring practices or employing more physicians in parenteral drug– intensive specialties, treating more patients in these specialties, and favoring high-income groups with more generous insurance when treating additional patients. The secondary objective was to test whether the program has been associated with expanded care or decreased mortality in low-income groups.
METHODS
STUDY DESIGN
To isolate the effects of the program, we used a regression-discontinuity design12,13 that took advantage of the eligibility rules of the 340B Program for general acute care hospitals, which establish eligibility above a threshold of 11.75% in the Disproportionate Share Hospital adjustment percentage (DSH percentage) of each hospital. The DSH percentage, a federally defined measure that determines additional payments for uncompensated care, is largely based on the percentage of admissions at a hospital that are for Medicaid patients and low-income Medicare patients (see the Supplementary Appendix, available with the full text of this article at NEJM.org).14
In the context of our study, a regression-discontinuity approach assumes that all determinants of hospital behavior for hospitals just above or just below the eligibility threshold were similar with the exception of exposure to the program. Equivalently, hospitals with minimally different DSH percentages within a sufficiently narrow range around the threshold are considered to be quasi-randomly assigned to program eligibility. In accordance with standard practice when there may be too few observations within such a range, we included hospitals from a broader range of DSH percentages and used regression to estimate threshold-related discontinuities (level shifts) in the cross-sectional relationship between hospital DSH percentages and each study outcome. This approach assumes that the relationship would have continued uninterrupted across the threshold in the absence of the program. Unlike comparisons of longitudinal changes (e.g., a difference-in-differences approach), our cross-sectional regression-discontinuity approach did not require hard-to-justify assumptions about how hospitals would have evolved in the absence of the program during a period of rapid hospital–physician consolidation.
STUDY DATA AND POPULATION
Our study included general acute care hospitals with 50 or more beds. We excluded for-profit hospitals because they are not eligible for the 340B Program and other categories of hospitals because they are subject to different eligibility criteria or payment systems.15 We further limited our analysis to hospitals with a DSH percentage within 10 percentage points of the 11.75% eligibility thresholds (i.e., 1.75% to 21.75%) and assessed the robustness of our results to narrower ranges in sensitivity analyses (see the Supplementary Appendix).
For hospital-level analyses, we constructed hospital-level variables for each year from 2008 through 2012 using Medicare claims and enrollment data for a random 20% sample of fee-forservice beneficiaries and data from the Centers for Medicare and Medicaid Services Hospital Cost Report Information System (HCRIS). For patient-level analyses of mortality in communities served by the hospitals in our study, we restricted the sample of fee-for-service Medicare beneficiaries to those living in ZIP Codes occupied by a single hospital (75% of the study hospitals fit this description).
STUDY VARIABLES
340B Program Participation and Eligibility
Using data from the Health Resources and Services Administration, we categorized a hospital as a 340B Program participant in a given year if it was a registered participant at any point during the year.16 To assess the program eligibility of each hospital, we used the DSH percentage of the hospital from the previous year, as reported in the HCRIS, because eligibility is determined prospectively (see the Supplementary Appendix).
Dependent Variables
Our primary hospital-level analyses included several prespecified and closely related outcome measures, which are described in more detail in the Supplementary Appendix. For each hospital in each year, we adapted previously described methods, using Medicare outpatient and carrier claims to determine the number of physicians in hematology–oncology, ophthalmology, or rheumatology who were practicing in a facility owned by the hospital.17 We prespecified these three specialties because they account for the most Part B drug spending in Medicare and have the highest proportions of revenue attributable to parenteral drugs among all specialties.15,18 We focused on these specialties because of the emphasis of our study on parenteral drugs. However, the 340B Program may have accelerated hospital–physician integration in other specialties, too, because the discounts also apply to prescription drugs and may have encouraged hospital acquisitions of multispecialty groups.19
For each of the three specialties in each year and each hospital (including all outpatient practices and facilities owned by the hospital), we used Medicare claims and enrollment data to determine the number of Medicare patients served in outpatient facilities of the hospital by a physician in the specialty (see the Supplementary Appendix), the number of these patients receiving Part B drugs from the hospital, the number of reimbursed Part B drug claims billed by the hospital for these patients (and associated Medicare revenue), and the proportion of these patients who were dually enrolled in Medicaid and Medicare or received state assistance for Medicare cost-sharing. These dually eligible beneficiaries have less generous coverage or coverage that reimburses hospitals at lower rates for Part B drugs and other services than do persons with private supplemental insurance.
For secondary hospital-level analyses assessing hospital investments in the safety net, we used HCRIS data to assess the following variables yearly for federally qualified health centers (FQHCs) integrated with each hospital: the number of health care professionals employed, the number of patient encounters, and Medicare spending for FQHC care. We also assessed from claims the number of inpatient admissions for low-income groups. For secondary patient-level analyses of Medicare beneficiaries in the ZIP Codes of the hospitals, we assessed annual mortality from Master Beneficiary Summary files.
Covariates
As covariates for hospital-level and patient-level analyses, we assessed hospital teaching status, urban or rural classification, and Census region. As covariates for patient-level analyses of mortality, we additionally assessed the following patient characteristics: age, sex, race and ethnic group, whether disability was the original reason for Medicare enrollment, presence of endstage renal disease, chronic conditions from the Chronic Conditions Data Warehouse, and the Hierarchical Condition Category score.
STATISTICAL ANALYSIS
For each hospital-level dependent variable, we fit the following model to estimate the eligibility threshold–related discontinuity in the relationship between the variable and the hospital DSH percentage:
where E(Yit) denotes the expected value of the outcome for hospital i in year t, 340B Eligibleit indicates whether the DSH percentage of the hospital exceeded the eligibility threshold, DSHit is the DSH percentage of the hospital, Xit is a set of hospital-year level characteristics, and αt denotes fixed effects for year. The terms DSHit and (340B Eligibleit × DSHit) allow the slopes of the linear relationship between the hospital DSH percentage and outcome to differ on either side of the eligibility threshold.
The coefficient of interest, β1, is the adjusted discontinuity, or the difference in the outcome between hospitals above versus below the program eligibility threshold after adjustment for covariates and the relationship between hospital DSH percentage and the outcome. This quantity represents the estimated effect of 340B eligibility on the outcome variable. Because some eligible hospitals do not enroll in the 340B Program, we used instrumental-variables methods to estimate discontinuities associated with program participation. To aid interpretation of the multiple tests in our primary analyses, we conducted post hoc significance tests using a modified Hochberg procedure20 that accounted for the multiplicity of outcomes and the high degree of correlation among them. Additional details about these analyses are provided in the Supplementary Appendix.
For analyses of mortality in the local communities of hospitals, we estimated similar models at the patient level after restricting the sample to Medicare beneficiaries living in ZIP Codes occupied by a single hospital and assigning the DSH percentage of that hospital to all beneficiaries residing in its ZIP Code. In a supplemental analysis, we used a similar strategy to examine overall Part B drug use and spending among beneficiaries in the local communities of hospitals (see the Supplementary Appendix).
In all analyses, we excluded hospitals with DSH percentages that were within 1 percentage point of the eligibility threshold in order to reduce measurement error introduced by misclassification of hospital eligibility among hospitals that were close to the threshold.21 This misclassification resulted from misalignment for some hospitals between annual periods for DSH reporting in the HCRIS and calendar-year periods used for determining eligibility. In hospital-level analyses, hospitals were weighted by their number of beds. All analyses used robust variance estimators to account for clustering at the hospital level.22
In sensitivity analyses, we tested the robustness of our estimates to adjustment for different specifications of the relationship between DSH percentage and outcomes. We also tested for eligibility-related discontinuities in hospital characteristics that should not be affected by the program and, for mortality analyses, in patient characteristics to test the assumption that potential confounders trended continuously across the eligibility threshold. We conducted additional analyses to assess the extent to which hospitals might have manipulated their DSH percentage to become eligible for the program, including analyses using the DSH percentages and hypothetical eligibility of hospitals in 2002 (before program expansion). In falsification tests, we repeated our hospital-level analyses among for-profit hospitals (which are not 340B-eligible) and among study hospitals in 2002 (when few were eligible), and we reestimated models using a range of alternate hypothetical eligibility thresholds.
RESULTS
340B PROGRAM ELIGIBILITY AND PARTICIPATION
Hospital participation in the 340B Program increased sharply at the DSH percentage threshold for eligibility, with some misclassification of program eligibility among hospitals close to the threshold, as expected (Fig. S1 in the Supplementary Appendix). The eligibility of hospitals for the 340B Program was stable over short and long periods (Figs. S2 and S3 in the Supplementary Appendix). For example, hospitals that were eligible in 2008 and met inclusion criteria for analysis were eligible for 4.7 years of the 5-year study period, on average.
HOSPITAL RESPONSE TO 340B PROGRAM INCENTIVES IN DRUG-INTENSIVE SPECIALTIES
Hospitals with DSH percentages that exceeded the program eligibility threshold had significantly more hematologist–oncologists practicing in hospital-owned facilities than did hospitals with percentages below the threshold (Table 1 and Fig. 1). Specifically, the difference in the number of hematologist–oncologists between eligible and ineligible hospitals after adjustment for its relationship with hospital DSH percentage and hospital covariates (the adjusted discontinuity estimate) was 2.3 hematologist–oncologists per hospital (P = 0.02). This translates to 230% more hematologist–oncologists per hospital than the expected mean in the absence of a discontinuity at the threshold (1.0 per hospital). Program eligibility was associated with an adjusted discontinuity of 0.9 (or 900%) more ophthalmologists per hospital (P = 0.08) and 0.1 (or 33%) more rheumatologists per hospital (P = 0.84). Program eligibility was also associated with significantly more patients receiving parenteral drugs and with significantly more Part B drug claims billed per year in hospital-owned facilities in hematology–oncology (90% more drug claims than the expected mean, P = 0.001) and ophthalmology (177% more, P = 0.03) but not in rheumatology (77% more, P = 0.12). (Table 1 and Fig. 1). In hospital-owned hematology–oncology and ophthalmology practices, program eligibility was associated with significantly lower percentages of patients who were dually eligible for Medicare and Medicaid (Table 1, and Fig. S4 in the Supplementary Appendix).
Table 1.
Hospital–Physician Consolidation, Additional Patients Served in Hospital-Owned Settings, and Additional Hospital Drug Provision Associated with Eligibility for the 340B Program,According to Specialty.
| Hospital-Level Measure* | Hematolgy-oncology |
Ophthalmology |
Rheumatology |
||||||
|---|---|---|---|---|---|---|---|---|---|
| Expected Mean† |
Adjusted Discontinuity (95% CI)‡ |
P Value | Expected Mean† |
Adjusted Discontinuity (95% CI)‡ |
P Value | Expected Mean† |
Adjusted Discontinuity (95% CI)‡ |
P Value | |
| Physicians in outpatient Practices or Facilities owned by hospitals—no.§ |
1.0 | 2.3 (0.3 to 4.3) | 0.02 | 0.1 | 0.9 (−0.1 to 2.0) | 0.08 | 0.3 | 0.1 (−0.6 to 0.8) | 0.84 |
| Medicare Patients served per year in outpatient prac- tices or facilities owned by hospital — no.¶ |
149.8 | 60.2 (−0.8 to 121.2) | 0.05 | 45.5 | 77.3 (7.7 to 146.8) | 0.03 | 30.4 | 9.7 (−15.3 to 34.8) | 0.45 |
| Medicare Patients served who were dually eligible for Medicaid or state assistance — %ǁ |
16.0 | −1.6 (−3.1 to 0.0) | 0.05 | 18.2 | −3.8 (−6.7 to −0.8) | 0.01 | 19.4 | −2.0 (−5.1 to 1.0) | 0.19 |
| Medicare Patients per year receiving Part B drugs from outpatient practices or facilities owned by the hos- pital—no. |
76.6 | 41.7 (14.1 to 69.2) | 0.003 | 28.3 | 33.2 (3.2 to 63.2) | 0.03 | 10.4 | 6.4 (−3.1 to 15.9) | 0.19 |
| Part B drug claims billed per year by outpatient practic- es or facilities owned by hospital — no.** |
247.8 | 223.1 (88.8 to 357.3) | 0.001 | 43.5 | 76.9 (9.6 to 144.3) | 0.03 | 27.2 | 21.0 (−5.1 to 47.1) | 0.12 |
| Hospital annual Medicare revenue for Part B drugs — dollars†† |
436,668 | 360,243 (119,713 to 600,774) |
0.003 | 75,708 | 98,639 (−25,876 to 22,315) |
0.12 | 43,771 | 34,643 (−1586 to 70,871) |
0.06 |
A total of 4503 hospital-years was available for the assessment of hospital measures.
Data are the expected mean at the eligibility threshold for ineligible hospital based on the relationship between the Disproportionate Share hospital (DSH) adjustment percentage and the outcome. Since this mean represented the expected level of each outcome in the absence of discontinuity, the adjusted discontinuity estimates can be divided by these means to obtain an estimate of program effects in relative percentage terms.
Adjusted discontinuities are estimates of the difference in each outcome above versus below the DSH percentage threshold for 340B Program eligibility after adjustment for the relationship between DSH percentage and the outcome and for hospital covariates (and patient – level covariates in the analyses of mortality) and can be interpreted as the average effect of 340B Program eligibility on the outcome. For example, the results suggest that eligibility was associated with 2.3 additional hematologist-oncologists working in practices owned by the hospitals.
Details on the methods used to assess the number of physicians in each speciality practicing in outpatient practices or facilities owned by each hospital are provided in the supplementary Appendix Among eligible hospitals, 32% had at least one hematologist-oncologist in a hospital-owned practice, 13% had at least one ophthalmologist, and 13% had at least one rheumatologist. Thus, the average estimates of program-related hospital-physician consolidation would be much larger among hospitals that added physicians or in response to the program.
Data are the number of Medicine beneficiaries with at least one claim for a service from a physician in the specialty of interest in a practice or outpatient facility owned by the hospital
The adjusted discontinuities for percentages are given as percentage points
Data are the total number of part B drug claims billed by the hospital for patients served in the outpatient practices or facilities owned by the hospital
Data are the total Medicine spending for part B drugs administered by the hospital to patients served in outpatient practices of facilities owned by the hospitals.
Figure 1. 340B Program–Related Discontinuities in Hospital Ownership of Physician Practices and Part B Drug Administration per Year, According to Specialty.
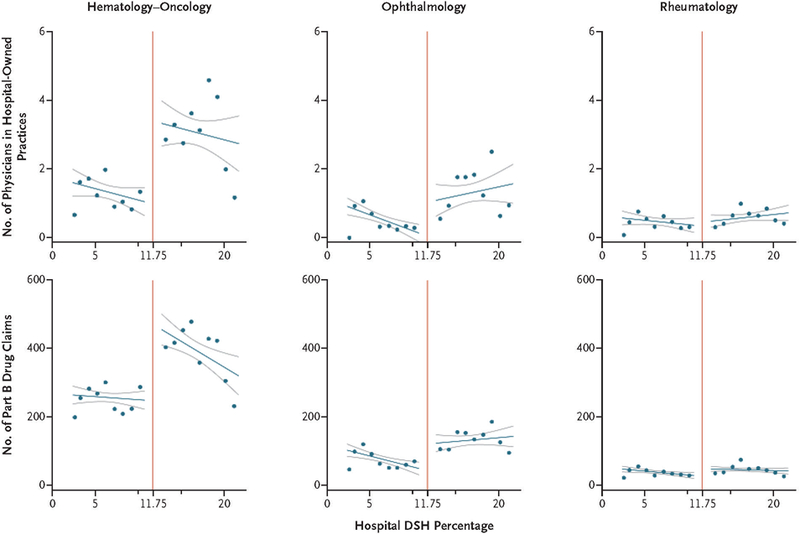
For each specialty, the number of physicians in hospital-owned practices and the number of hospital Part B drug claims per year areplotted according to the Disproportionate Share Hospital (DSH) adjustment percentage in the previous year, which determines 340B Program eligibility. Hospitals were categorized on the basis of their DSH percentage into 1-percentage-point bins, excluding hospitals within 1 percentage point of the eligibility threshold of 11.75%. Unadjusted bin means were calculated and plotted, with hospital size (in beds) used to weight hospital contributions to the mean. For illustrative purposes, a line of best fit to the bin means (darker blue lines) is shown to either side of the threshold, with 95% confidence intervals (lighter blue lines). The red vertical line denotes the threshold for 340B Program eligibility at a DSH percentage of 11.75%. Similar scatter plots of the numbers of patients served in hospital-owned practices and the proportion of patients served who were dually eligible by specialty across hospital DSH percentages are shown in Figure S4 in the Supplementary Appendix.
Instrumental-variables estimates of discontinuities associated with program participation (rather than eligibility) were substantially larger. We found no significant eligibility-related discontinuities in hospital characteristics. All significant estimates remained so after multiple outcomes were accounted for. Additional details of these analyses are provided in Tables S1, S2, and S3 in the Supplementary Appendix.
CARE AND MORTALITY IN LOW-INCOME GROUPS
In hospital-level analyses, program eligibility was not associated with significant discontinuities in the number of health care professionals employed or patient encounters in integrated FQHCs or in the annual number of inpatient admissions for dually eligible Medicare beneficiaries, beneficiaries living in high-poverty areas, or beneficiaries served by safety-net providers (Table 2). In patient-level analyses involving beneficiaries who were residing in ZIP Codes that had a single study hospital, program eligibility of the local hospital was associated with substantial discontinuities in shares of admissions and hospital outpatient spending attributable to 340B-eligible hospitals but was not associated with significant discontinuities in mortality for beneficiaries in the local communities of the hospitals (defined by hospital ZIP Codes), either overall or for low income subgroups (Table 2, and Fig. S5 in the Supplementary Appendix). Discontinuities in observed patient characteristics also were minimal (Table S4 in the Supplementary Appendix).
Table 2.
Discontinuities in Hospital Care for Low-Income Groups and Mortality in Local Communities Associated with Eligibility for the 340B Program.
| Measure | Expected Mean* |
Adjusted Discontinuity (95% CI)† |
P Value |
|---|---|---|---|
| Hospital-level analyses‡ | |||
| Hospital provision of safety-net care§ | |||
| No. of visits per year to FQHCs integrated with hospital | 101.1 | 2.9 (−141.4 to 147.2) | 0.97 |
| Medicare spending per year for care at FQHCs integrated with hospital — dollars/hospital |
1487 | −1455 (−5121 to 2211) | 0.44 |
| Health care professionals employed in the FQHCs integrated with hospital — full-time equivalents |
0.05 | −0.04 (−0.11 to 0.03) | 0.29 |
| Hospital provision of inpatient care to Medicare patients | |||
| No. of total admissions per year | 1217.5 | 147.3 (−95.3 to 390.0) | 0.23 |
| No. of admissions per year for dually eligible beneficiaries | 338.0 | 8.2 (−58.9 to 75.2) | 0.81 |
| No. of admissions per year for beneficiaries served by safety-net providers¶ | 79.1 | 13.6 (−25.0 to 52.2) | 0.49 |
| No. admissions per year for beneficiaries in low-income areas | 422.2 | 25.2 (−79.2 to 129.6) | 0.64 |
| Patient-level analyses of Medicare beneficiaries in hospital ZIP Codes‖ | |||
| Exposure to 340B Program | |||
| Share of admissions in ZIP Code attributable to 340B-eligible hospitals — %** | 17.1 | 48.4 (45.0 to 51.9) | <0.001 |
| Share of hospital outpatient spending in ZIP Code attributable to 340B-eligible hospitals — % |
20.8 | 48.0 (44.0 to 51.9) | <0.001 |
| Annual mortality rate — % | |||
| All beneficiaries living in hospital ZIP Code | 5.1 | 0.1 (−0.1 to 0.3) | 0.27 |
| Dually eligible beneficiaries | 6.3 | 0.0 (−0.4 to 0.4) | 0.97 |
| Beneficiaries served by safety-net providers¶ | 4.1 | −0.1 (−0.9 to 0.7) | 0.73 |
| Beneficiaries in low-income areas†† | 5.1 | 0.2 (−0.1 to 0.6) | 0.15 |
Data are the expected mean at the eligibility threshold for ineligible hospitals based on the relationship between DSH percentage and the outcome. Since this mean represented the expected level of each outcome in the absence of a discontinuity, the adjusted discontinuity estimates can be divided by these means to obtain an estimate of program effects in relative percentage terms.
Adjusted discontinuities are estimates of the difference in each outcome above (vs. below) the DSH percentage threshold for 340B eligibility after adjustment for the relationship between DSH percentage and the outcome and for hospital covariates (and patient-level covariates in the analyses on mortality) and can be interpreted as the average effect of 340B Program eligibility on the outcome.
A total of 4503 hospital-years was available for the assessment of hospital-level measures.
Data are from the Hospital Cost Report Information System. The professionals employed in the federally qualified health centers (FQHCs) include physicians, nurses, physician assistants, social workers, and psychiatrists.
Beneficiaries served by safety-net providers are those with at least one claim for a service provided by an FQHC, community mental health center, rural health clinic, or other provider types that typically serve low-income populations (see the Supplementary Appendix).
The sample included a total of 1,989,633 fee-for-service beneficiaries from the 20% sample residing in the same ZIP Code as a study hospital that was the only hospital located in its ZIP Code. The adjusted discontinuities for percentages are given as percentage points.
The adjusted discontinuity for this variable indicates a 48.4-percentage-point absolute increase in the share of admissions in a ZIP Code that were admissions to 340B-eligible hospitals.
Beneficiaries in low-income areas were defined as beneficiaries residing in a ZIP Code tabulation area in which the percentage of the elderly population living below the federal poverty level exceeded 10%, the 75th percentile in our study sample, based on 2010 U.S. Census data.
SENSITIVITY AND SUPPLEMENTAL ANALYSES
The results of all sensitivity analyses and falsificatio tests supported the conclusions of our main analyses, including analyses that were restricted to hospitals with DSH percentages that were within 3 percentage points of the eligibility threshold, which produced estimates that were similar to those from our main analyses and remained significant in all cases (Tables S5 through S14 and Fig. S7 in the Supplementary Appendix). In a supplemental patient-level discontinuity analysis examining whether the greater provision of parenteral drugs by hospitals that was associated with program eligibility was accompanied by higher total Part B drug spending in local communities for patients served by parenteral drug– intensive specialties, program exposure was associated with 10.2% higher spending on Part B drugs in hospital-owned settings (P = 0.03) but with lower drug spending in the independent office setting. The net discontinuity in total drug spending (in either setting) was positive but not significant (Tables S15, S16, and S17 in the Supplementary Appendix).
DISCUSSION
Our findings suggest that in hematology–oncology and ophthalmology but not in rheumatology, hospitals that are eligible for the 340B Drug Pricing Program have responded to program incentives by increasing the outpatient provision of parenteral drugs and, in the case of hematology–oncology, by employing physicians or acquiring physician practices. Our findings also suggest the program prompted eligible hospitals to treat more Medicare patients who are more likely to have private supplemental insurance to cover the 20% of Part B drug costs that is not covered by Medicare.23 The finding that patients served by eligible hospitals were less likely to have Medicaid, which reimburses hospitals less generously than other forms of supplemental coverage, is consistent with the financial incentives of hospitals and with evidence that 340B-participating hospitals have increasingly affiliated with hematology–oncology practices serving affluent communities.6
The discontinuous increases in the provision of drugs in hospital-owned settings that were found in association with program eligibility in hospital-level analyses were evident in analyses of local communities of Medicare patients. However, local increases in the total use of Part B drugs that also included provision of drugs in independent office settings (and not just in hospital-owned settings) were not significant. These findings suggest that much of the increase in the use of hospital-provided drugs resulted from a shift in setting, a finding consistent with hospital acquisitions of physician practices and more frequent referrals to hospital-owned specialty practices and infusion sites. We could not reject, however, the possibility of a meaningful effect of the program on total parenteral drug use in communities served by eligible hospitals that our analysis was not adequately powered to detect.
We found no evidence of hospitals using the surplus monetary resources generated from administering discounted drugs to invest in safetynet providers, provide more inpatient care to low-income patients, or enhance care for lowincome groups in ways that would reduce mortality. These results suggest hospital responses that are contrary to the goals of the program and have a number of important policy implications. In general, policies that are intended to improve or expand care for medically underserved populations may be ineffective if they rely on indirect mechanisms with weak incentives, such as the cross-subsidization that the 340B Program intends for hospitals to implement.5
Our findings suggest that the recent decision by the Department of Health and Human Services to lower drug reimbursements to hospitals participating in the 340B Program24 could slow hospital–physician consolidation while not adversely affecting care for low-income patients served by general acute hospitals. This form of consolidation has increased prices and spending without ostensibly improving quality.17,25–28 Building on previous evidence,29,30 our study more generally underscores the importance of differences in profitability between hospital-owned and independent outpatient settings in encouraging hospital–physician consolidation. Thus, our findings support broader proposals to make payments and discounts for care delivery setting-neutral.31
Our study had several limitations. First, we relied largely on Medicare data. We would expect, however, that major investments in clinical resources for low-income groups outside of Medicare, such as the uninsured, would also affect care for low-income Medicare beneficiaries. Moreover, we found no evidence of enhanced care for a subgroup of Medicare patients with supplemental insurance that is less generous or reimburses hospitals at lower rates than private supplemental insurance. In addition, measures of hospital investments in FQHCs were not specific to Medicare.
Second, program-related increases in hospital ownership of physician practices could have been overstated if practices owned by hospitals merely changed place-of-service codes to allow administration of discounted drugs. However, hospitals have strong incentives to encourage such coding practices, regardless of the program, because Medicare pays for services in hospital-owned settings at higher rates than in independent office settings. Third, our regression-discontinuity approach supported inferences about hospitals just above the eligibility thresholds. Hospitals with higher DSH percentages could have responded differently to program discounts. Fourth, our conclusions may not apply to categories of eligible hospitals we did not study, such as critical access hospitals.
In conclusion, the 340B Drug Pricing Program has been associated with hospital–physician consolidation in hematology–oncology and with more hospital-based administration of parenteral drugs in hematology–oncology and ophthalmology without clear evidence of expanded care or lower mortality among low-income patients.
Supplementary Material
Acknowledgments
The content of this article is solely the responsibility of the authors and does not necessarily represent the official views of the Agency for Healthcare Research and Quality or the Robert Wood Johnson Foundation.
Supported by grants from the Agency for Healthcare Research and Quality (U19HS024072) and the Robert Wood Johnson Foundation (71408) and by the Marshall J. Seidman Center for Studies in Health Economics and Health Care Policy at Harvard Medical School.
Disclosure forms provided by the authors are available with the full text of this article at NEJM.org.
References
- 1. Public Health Service Act, 42 U.S.C. § 256b.
- 2.Mulcahy AW, Armstrong C, Lewis J, Mattke S. The 340B prescription drug discount program: origins, implementation, and post-reform future Santa Monica, CA: RAND, 2014. [Google Scholar]
- 3.340B drug pricing program Rockville, MD: Health Resources & Services Administration, November 2017. (https://www.hrsa.gov/opa/). [Google Scholar]
- 4.Overview of the 340B drug pricing program Washington, DC: 340B Health; (http://www.340bhealth.org/340b-resources/340b-program/overview/). [Google Scholar]
- 5.Report to the Congress: overview of the 340B drug pricing program Washington, DC: Medicare Payment Advisory Commission, May 2015. (http://www.medpac.gov/docs/default-source/reports/may-2015-report-to-the-congress-overview-of-the-340b-drug [Google Scholar]
- 6.Conti RM, Bach PB. The 340B drug discount program: hospitals generate profits by expanding to reach more affluent communities. Health Aff (Millwood) 2014; 33: 1786–92. [DOI] [PMC free article] [PubMed] [Google Scholar]
- 7.Drug pricing: manufacturer discounts in the 340B program offer benefits, but federal oversight needs improvement Washington, DC: Government Accountability Office, September 2011. (http://www.gao.gov/assets/330/323702.pdf). [Google Scholar]
- 8.Conti RM, Bach PB. Cost consequences of the 340B drug discount program. JAMA 2013; 309: 1995–6. [DOI] [PMC free article] [PubMed] [Google Scholar]
- 9.Public Health Service. Notice regarding Section 602 of the Veterans Health Care Act of 1992 Outpatient Hospital Facilities: final notice. Federal Register September 19, 1994: 47884–6 (http://www.hrsa.gov/sites/default/files/opa/programrequirements/federalregisternotices/outpatienthospitalfacilities091994.pdf). [PubMed]
- 10.340B hot topics: Office of Pharmacy Affairs update Rockville, MD: Health Resources & Services Administration, 2017. (http://www.hrsa.gov/opa/updates/august2014.html). [Google Scholar]
- 11.Hospital ownership of physician practices Washington, DC: Department of Health and Human Services, Office of the Inspector General, September 1999. (https://oig.hhs.gov/oei/reports/oei-05-98-00110.pdf). [Google Scholar]
- 12.Lee DS, Lemieux T. Regression discontinuity designs in economics. J Econ Lit 2010; 48: 281–355. [Google Scholar]
- 13.Venkataramani AS, Bor J, Jena AB. Regression discontinuity designs in healthcare research. BMJ 2016; 352: i1216. [DOI] [PMC free article] [PubMed] [Google Scholar]
- 14.Medicare Disproportionate Share Hospital fact sheet Baltimore: Centers for Medicare & Medicaid Services, September 2017. (https://www.cms.gov/Outreach-and-Education/Medicare-Learning-Network-MLN/MLNProducts/downloads/Disproportionate_Share_Hospital.pdf). [Google Scholar]
- 15.Part B drug payment policy issues. In: Report to the Congress: Medicare and the health care delivery system Washington, DC: Medicare Payment Advisory Commission, June 2015. (http://www.medpac.gov/docs/default-source/reports/chapter-3-part-b-drug-payment-policy-issues-june-2015-report-.pdf?sfvrsn=0). [Google Scholar]
- 16.340B Eligibility and registration: eligible organizations Rockville, MD: Health Resources & Services Administration; (https://www.hrsa.gov/opa/eligibility-and-registration/index.html). [Google Scholar]
- 17.Neprash HT, Chernew ME, Hicks AL, Gibson T, McWilliams JM. Association of financial integration between physicians and hospitals with commercial health care prices. JAMA Intern Med 2015; 175: 1932–9. [DOI] [PubMed] [Google Scholar]
- 18.Sheingold S, Marchetti-Bowick E, Nguyen N, Yabroff KR. Medicare Part B drugs: pricing and incentives Washington, DC: Department of Health and Human Services, March 8, 2016. (https://aspe.hhs.gov/system/files/pdf/187581/PartBDrug.pdf). [Google Scholar]
- 19.Clark BL, Hou J, Chou CH, Huang ES, Conti R. The 340B discount program: outpatient prescription dispensing patterns through contract pharmacies in 2012. Health Aff (Millwood) 2014; 33: 2012–7. [DOI] [PMC free article] [PubMed] [Google Scholar]
- 20.Sankoh AJ, Huque MF, Dubey SD. Some comments on frequently used multiple endpoint adjustment methods in clinical trials. Stat Med 1997; 16: 2529–42. [DOI] [PubMed] [Google Scholar]
- 21.Barreca AI, Lindo JM, Waddell GR. Heaping-induced bias in regression-discontinuity designs. Econ Inq 2016; 54: 268–93. [Google Scholar]
- 22.Wooldridge JM. Econometric analysis of cross section and panel data Vol. 58 Cambridge, MA: MIT Press, 2002. [Google Scholar]
- 23.Medicare.gov. Medicare 2017 and 2018 costs at a glance (https://www.medicare.gov/your-medicare-costs/costs-at-a-glance/costs-at-glance.html).
- 24.HHS Secretary Price: Trump administration is taking action on drug prices. Press release of the Department of Health and Human Services, July 13, 2017. (https://www.hhs.gov/about/news/2017/07/13/hhs-secretary-price-trump-administration-taking-action-drug-prices.html).
- 25.Baker LC, Bundorf MK, Kessler DP. Vertical integration: hospital ownership of physician practices is associated with higher prices and spending. Health Aff (Millwood) 2014; 33: 756–63. [DOI] [PubMed] [Google Scholar]
- 26.Conti RM, Landrum MB, Jacobson M. The impact of provider consolidation on outpatient prescription drug-based cancer care spending Washington, DC: Health Care Cost Institute, 2016. (http://www.healthcostinstitute.org/files/HCCI-Issue-Brief-Impact-of-Provider-Consolidation.pdf). [Google Scholar]
- 27.Koch TG, Wendling BW, Wilson NE. How vertical integration affects the quantity and cost of care for Medicare beneficiaries. J Health Econ 2017; 52: 19–32. [DOI] [PubMed] [Google Scholar]
- 28.Scott KW, Orav EJ, Cutler DM, Jha AK. Changes in hospital-physician affiliations in U.S. hospitals and their effect on quality of care. Ann Intern Med 2017; 166: 1–8. [DOI] [PubMed] [Google Scholar]
- 29.Song Z, Wallace J, Neprash HT, McKellar MR, Chernew ME, McWilliams JM. Medicare fee cuts and cardiologist-hospital integration. JAMA Intern Med 2015; 175: 1229–31. [DOI] [PMC free article] [PubMed] [Google Scholar]
- 30.Dranove D, Ody C. Employed for higher pay? How Medicare facility fees affect hospital employment of physicians Evanston, IL: Kellogg School of Management, Northwestern University, 2016. (http://www.kellogg.northwestern.edu/faculty/publication_detail.aspx?id=be3b359c-e31a-11e6-9fbb-0050569b3e41). [Google Scholar]
- 31.Provider consolidation: the role of Medicare policy. In: Report to the Congress: Medicare and the health care delivery system Washington, DC: Medicare Payment Advisory Commission, 2017. (http://www.medpac.gov/docs/default-source/reports/jun17_ch10.pdf?sfvrsn=0). [Google Scholar]
Associated Data
This section collects any data citations, data availability statements, or supplementary materials included in this article.