

Abstract
Gastric cancer (GC) is among the most frequent malignant diseases. Despite advances in treatment, the clinical outcome of patients with GC remains poor. The establishment of novel biomarkers is urgently required for early detection, treatment evaluation and prognostic assessment. Non-coding RNAs (ncRNAs) are a key topic of intensive research due to their potential applications in the field of oncology. The long ncRNA H19 has been frequently reported as overexpressed in many cancers including GC. In the present study, the diagnostic and prognostic value of circulating H19 in GC was assessed. Higher levels of circulating H19 were identified in GC patients (n=40) compared with a control group consisting of endoscopy-verified GC-free individuals (n=42; median levels relative to GAPDH, 58.4 vs. 29.9; P=0.027). Patients with smaller tumor sizes (<5 cm) exhibited higher H19 in their circulation compared with those with larger tumors (≥5 cm; P=0.04). Plasma levels of H19 declined significantly upon surgical removal of gastric tumors as documented in a subset of patients [n=20; relative median levels, 146.0 vs. 15.0 (pre-surgery); P=0.003]. However, it was identified that H19 had no prognostic role in GC by the Kaplan-Meier method. In conclusion, the present findings identify H19 as potential diagnostic marker in GC.
Keywords: gastric cancer, plasma, circulating H19, diagnosis, prognosis
Introduction
Although the incidence of gastric cancer (GC) is declining in most developed countries (1), it remains the fifth most common malignant disease after cancers of the lung, breast, colorectum and prostate (2). Despite advances in therapeutic approaches for GC, clinical outcomes of patients with GC remain poor, with a reported five-year survival rate of less than 30%, making it the third most frequent cause of cancer-related mortality worldwide (3).
GC is considered to develop as a result of environmental factors and the accumulation of genetic and epigenetic alterations. In the last two decades, several genetic and epigenetic alterations have been identified to be associated with malignant transformation of gastric mucosal cells (4,5). Notably, studies have revealed with the aid of technologically advanced methods including genomics, epigenomics, proteomics and transcriptomics that gastric adenocarcinomas are more heterogeneous than previously assumed (6–8). Consequently, patients with the same tumor stage often exhibit different clinical outcomes (9). There are ongoing research efforts aimed at identifying novel biomarkers to diagnose GC in early stages and to develop more effective therapy monitoring strategies (10).
Biomarkers with a potential use in GC include, among others, E-cadherin, human epidermal growth factor receptor 2 (HER2), fibroblast growth factor receptor, receptor tyrosine kinase MET, human epidermal growth factor receptor, hepatocyte growth factor receptor, mammalian target of rapamycin, microsatellite instability, programmed cell death-ligand 1 and p53 (10,11). However, their beneficial application in the management of GC patients is generally limited. Of these, only HER2 is in clinical use as a predictive biomarker to identify GC patients who benefit from targeted therapy with trastuzumab (11).
An emerging field of biomarker research is the study of non-coding RNAs (ncRNAs). Based on the length of the functional transcripts, human ncRNAs have been largely classified into two main classes: Small ncRNAs (<200 nt) and long ncRNAs (>200 nt). microRNAs (miRNAs), as central members of the small ncRNA class, serve as negative regulators of gene expression (12). Diversity is considerably higher in the long ncRNA (lncRNA) class, which includes approximately 19,000 functionally distinct RNA molecules with diverse molecular mechanisms (13). Accumulating data has indicated that the regulation of lncRNAs is impaired in cancer cells and that they may serve as potential biomarkers for cancer diagnosis and prognosis (12).
H19 was among the first identified lncRNA (14). The gene coding for H19 is located in an imprinted region of chromosome 11 near the insulin-like growth factor 2 (IGF2) gene, and several transcripts are encoded from the H19/IGF2 locus (14,15). H19 is expressed to high levels during embryonic development and repressed in most tissues postnatally (15). An initial article linking H19 to cancer reported that it was upregulated in bladder cancer and suggested it as a predictive marker for early cancer recurrence (16). Since then, H19 has been observed to be overexpressed in many cancers including GC, and indicated to be useful in predicting tumor progression and metastases (17,18). Increased levels of H19 have also been detected in the plasma of patients with GC, as a potential diagnostic marker (19–21). However, these studies employed apparently healthy individuals as control subjects, which may not be sufficient to assess the diagnostic potential of a presumed biomarker. In the present study, the circulating levels of H19 in GC patients were compared with those in a control group of endoscopy-verified GC-free individuals. It was also evaluated pre- and post-surgery the plasma levels of H19 in a subset of the patients to assess its value as a marker of tumor load. Finally, the prognostic role of H19 in GC was a further subject of analysis.
Materials and methods
Study subjects
The present study enrolled patients with resectable (without distant metastasis) GC without prior surgery (n=40) and age and sex-matched GC-free individuals (n=42) as the control group. The absence of GC in the individuals of the control group was verified by endoscopic investigation, and if necessary by biopsy in certain cases. The present study was approved by the ethics committee of Istanbul Medical Faculty, Istanbul University (Istanbul, Turkey; approval no. 2014/1180) and all subjects provided informed consent. Sample collection was conducted at the surgery unit of Istanbul Medical Faculty from March 2014 to September 2016. The majority of the patients had locally advanced disease; the clinical characteristics of all patients in the GC cohort are listed in Table I. The control group comprised of 30 male and 12 female subjects with a median age of 60 (range, 46–74).
Table I.
Association of circulating H19 with clinical characteristics of GC patients.
| Patients characteristics | No. of patients, n (%) | Relative plasma H19 level, median (range) | P-value |
|---|---|---|---|
| Age, years | |||
| ≥60 | 20 (50.0) | 64.3 (1.1–1532.0) | 0.63 |
| <60 | 20 (50.0) | 45.2 (1.5–1927.0) | |
| Gender | |||
| Male | 28 (70.0) | 64.3 (1.1–1927.0) | 0.65 |
| Female | 12 (30.0) | 45.2 (9.4–654.7) | |
| Tumor diameter, cma | |||
| ≥5 | 26 (66.7) | 41 (1.1–1927.0) | 0.04 |
| <5 | 13 (33.3) | 295 (9.4–1532.0) | |
| Primary tumor, Tb | |||
| T1-2 | 10 (26.3) | 275.6 (1.1–1532.0) | 0.31 |
| T3-4 | 28 (73.7) | 42.3 (1.53–1927.0) | |
| Tumor localization | |||
| Cardia + fundus | 6 (15.0) | 248 (2.8–1081.0) | 0.43 |
| Antrum + corpus | 34 (85.0) | 44.9 (1.1–1927.0) | |
| Lymphatic metastasis, Nd | |||
| N0 | 9 (25.0) | 118.9 (2.2–1532.0) | 0.97 |
| N1-3 | 27 (75.0) | 45.3 (1.5–1927.0) | |
| Venous invasiona | |||
| No | 19 (48.7) | 40 (1.1–1532.0) | 0.4 |
| Yes | 20 (51.2) | 64.3 (1.5–1927.0) | |
| Lymphocyte invasiona | |||
| No | 23 (59.0) | 48.2 (1.1–1532.0) | 0.8 |
| Yes | 16 (41.0) | 118.9 (1.53–1927.0) | |
| Perineural invasiona | |||
| No | 14 (35.9) | 297.9 (1.1–1927.0) | 0.2 |
| Yes | 25 (64.1) | 44.6 (1.5–1486.0) | |
| Mesenteric tumor nodulesa | |||
| No | 34 (87.1) | 64.3 (1.1–1532.0) | 0.9 |
| Yes | 5 (12.8) | 24.6 (9.4–1927.0) | |
| Carcinoembryonic antigen, ng/mlc | |||
| ≤5 | 33 (89.1) | 64.3 (1.1–1486.0) | 0.59 |
| >5 | 4 (10.8) | 18.4 (8.1–1927.0) | |
| Cancer antigen 19-9, ng/mld | |||
| ≤34 | 34 (94.4) | 48.6 (1.1–1927.0) | 0.75 |
| >34 | 2 (5.6) | 50.7 (24.5–76.7) |
Not available for 1 patient
not available for 2 patients
not available for 3 patients
not available for 4 patients H19 level is given relative to GAPDH. Tumor diameter and T and N staging were according to the American Joint Committee on Cancer. GC, gastric cancer.
Plasma was collected prior to partial gastrectomy from all GC patients and post-surgery from a subset of patients (n=20), in which post-surgery blood samples were available (taken within 7–12 days after surgery). Blood samples (5 ml) were collected in EDTA tubes, stored at room temperature (RT), and centrifugated at 3,000 × g for 20 min at RT, within 4 h of withdrawal. Following an immediate second centrifugation at 3,000 × g for 15 min at RT, plasma samples were stored in aliquots at −80°C until use.
RNA isolation and complementary DNA (cDNA) synthesis
Total RNA was extracted from 200 µl plasma samples using TriPure Isolation Reagent (Roche Diagnostics GmbH, Mannheim, Germany) according to the manufacturer's instructions. The concentration and purity of cell-free RNA was assessed with a NanoDrop 2000 spectrophotometer (Thermo Fisher Scientific, Inc., Waltham, MA, USA). The plasma RNAs were converted to cDNA with a First-Strand cDNA Synthesis kit (Thermo Fisher Scientific, Inc.).
Analysis of H19 gene expression
Plasma levels of H19 in study participants were quantified. The following primers were used to amplify a 145 bp product from plasma samples: Forward, 5′-ATCGGTGCCTCAGCGTTCGG-3′ and reverse, 5′-CTGTCCTCGCCGTCACACCG-3′ (22). The GAPDH gene was used as the reference for normalization of H19 expression. The primers for GAPDH gene amplification were: Forward, 5′-AGCCACATCGCTCAGACAC-3′ and reverse, 5′-GCCCAATACGACCAAATCC-3′. Quantitative polymerase chain reaction (qPCR) with Taq polymerase was performed on a LightCycler 480 using SYBR Green (all from Roche Diagnostics GmbH) as the fluorescent probe. The PCR program included a hot start step of 10 min at 95°C followed by 45 cycles of amplification. Each cycle consisted of denaturation at 95°C for 10 sec, annealing at 58°C for 30 sec and elongation at 72°C for 30 sec. Relative levels of H19 in circulation were determined using the 2-ΔΔCq method (23). Amplification of the appropriate product was confirmed by melting curve analysis following the amplification. H19 was highly abundant in plasma as its median cycle threshold (Cq) value in qPCR was higher than that of the internal control GAPDH (28 vs. 34). This was not due to differences in primer efficiencies as prior determined in a test cell line (LNCaP), where H19 expression was lower than GAPDH under the above described PCR conditions (data not provided).
Statistical analysis
To determine whether H19 plasma levels were normally distributed, the Shapiro-Wilk test was used, which indicated non-normal distribution. Thus, data on H19 expression were presented as the median with minimum and maximum values and first and third quartiles. The Mann-Whitney U test was thus employed to compare the differences in H19 levels between study groups and assess association with the clinical characteristics of patients. A receiver operating characteristic (ROC) curve was generated to evaluate the diagnostic potential of plasma H19. Pre- and post-operative levels of H19 were compared in the subset of patients for which data were available (n=20) using the Wilcoxon test. A prospective survival analysis was conducted with a median follow-up of 26 months (range, 2–44 months). The association of H19 with patient survival time was investigated using the Kaplan-Meier survival method. Statistical analysis was performed using the SPSS v.15 statistical package (SPSS, Inc., Chicago, IL, USA). P<0.05 was considered to indicate a statistically significant difference.
Results
Diagnostic value of H19 in GC
The plasma levels of H19 were measured in the study participants. As shown in Fig. 1A, circulating levels of H19 were higher in the GC patients compared with in the GC-free controls (median levels relative to GAPDH, 58.4 vs. 29.9; P=0.027). It is probable that high interindividual variation of H19 in plasma (range, 1.1 to 1927.0 in the patients) affected the level of statistical significance. The highest sensitivity at moderate specificity (with a positive predictive value of 56.7% and a negative predictive value of 76.2%) was determined at a cut-off level of 4.3; this yielded 87.2% sensitivity at a 38.1% specificity for plasma H19 in discriminating the GC patients from the controls. As shown in Fig. 1B, the ROC curve illustrates the diagnostic power of circulating H19, with an area under curve (AUC) of 64.3% (P=0.02).
Figure 1.

Plasma H19 levels in gastric cancer. (A) Plasma H19 levels were measured in the patients and control groups. The box plots show median, minimum and maximum values with first and third quartiles. The Y-axis presents H19 expression (log scale) relative to GAPDH. (B) ROC curve of diagnostic potential of plasma H19 in GC. ROC, receiver operating characteristic; GC, gastric cancer.
Association of H19 expression with clinicopathological parameters
Association between plasma H19 expression and clinicopathological parameters of GC patients was evaluated (Table I). This analysis revealed that the patients with smaller tumors (<5 cm) exhibited significantly higher plasma levels of H19 compared with those with larger tumors (≥5 cm; relative median levels 295.0 vs. 41.0; P=0.04). Accordingly, the patients with T1-T2 tumors tended to have higher plasma levels of H19 compared with those with more advanced disease (T3-T4) (relative median levels, 275.6 vs 42.3; P=0.31). Similarly, the patients with no lymphatic metastasis (N0) exhibited higher plasma H19 compared with those with lymphatic metastasis (N1-3) but without statistical significance (median relative levels 118.9 vs. 45.3; P=0.97). No association of plasma H19 was identified with other parameters including patient age and gender, or with disease characteristics including tumor localization, venous invasion, lymphocyte invasion, perineural invasion, mesenteric tumor nodules and serum tumor markers carcinoembryonic antigen and cancer antigen 19–9. It was next assessed whether circulating H19 may be marker of tumor load. Pre- and postoperative levels of circulating H19 were compared in a subset of GC patients (n=20). It was identified that H19 levels declined significantly following surgical tumor removal declining from the range 2.2–1927.0 to 0.01–544.0 [relative median levels 146.0 vs. 15.0 (pre-surgery); P=0.003; Fig. 2A]. In the vast majority of individual samples, plasma H19 levels decreased following surgery. These data indicated that circulating H19 may be an indicator of tumor burden (Fig. 2B).
Figure 2.
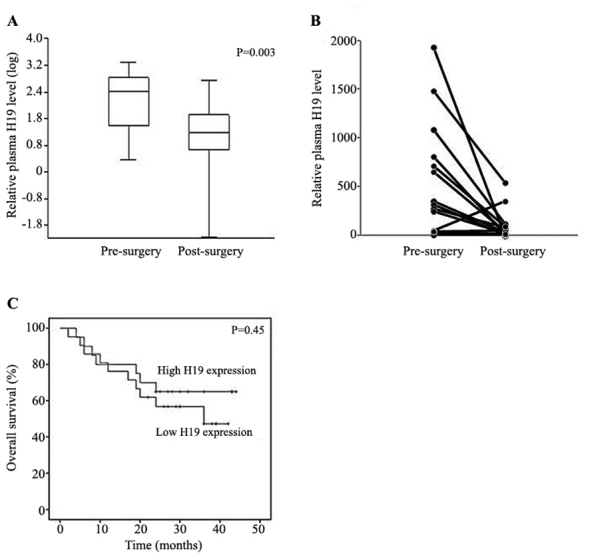
(A) Plasma H19 levels at pre- and post-surgery in a subset (n=20) of patients. (B) Changes in H19 levels at pre- and post-surgery for individual samples. H19 expression is presented relative to GAPDH. (C) Kaplan-Meier survival curve of patients with low and high H19 expression.
Prognostic value of H19 in GC
Finally, it was assessed whether circulating H19 levels were associated with the prognosis of GC patients. A prospective survival analysis was conducted with a median follow-up of 26 months (range, 2–44 months). Overall survival rates were compared between patients with H19 expression above the median level (cut-off) of 51.5 (high expression group, n=23) and those with H19 under the cut-off level (low expression group, n=18). Kaplan-Meier survival analysis (Fig. 2C) indicated that there was no difference in survival rate between the groups (median survival 26 vs. 26 months; P=0.45), indicating that basal plasma levels of H19 did not affect the prognosis of GC patients.
Discussion
The present study was undertaken to assess the diagnostic and prognostic value of circulating H19 in GC. The lncRNA H19 has been reported to be frequently overexpressed in multiple cancers including GC and associated with tumor progression and metastases (24–26). The present study identified H19 to be an abundant molecule in the plasma of HC patients, suggesting that H19 is either released in high levels from cells or stable in blood circulation. However, as reported for several other RNA molecules (27–28), interindividual fluctuation in H19 plasma levels was high, which probably reflects the variation in cellular H19 release and/or clearance among different individuals. In line with the published data available (19–21), the present study observed significantly higher levels of H19 in GC patients compared with in GC-free individuals. However, strength in the present study compared with those previous studies is the inclusion of a more defined control group that included individuals in whom the absence of malignant disease was confirmed by endoscopic investigation, and if necessary, by additional biopsy in certain cases.
Although H19 was apparent in higher levels in the circulation of GC patients, its diagnostic value appeared limited by high interindividual variation and moderate levels of accuracy between the GC patients and control (87.2% sensitivity at a 38.1% specificity; AUC 64.3). Hashad et al (20), reported a sensitivity of 68.75% at a specificity of 56.67% with an AUC of 72.00% in discriminating GC patients from healthy controls; whereas these rates were higher in a report by Zhou et al (19), (sensitivity 82.9% at a 72.9% specificity). These findings indicate the heterogeneity of findings, which may be related to many determinants including the characteristics of the control group included and differences in sample handling and the method of quantification. This warrants the need for further studies in larger cohorts. Combination of H19 with other tumor-associated markers may also increase the sensitivity and specificity of GC detection.
It was revealed that plasma levels of H19 declined significantly following surgical removal of gastric tumors, indicating that a significant proportion of circulating H19 in GC patients may originate from gastric tumor tissue. Interestingly, patients with smaller tumors exhibited significantly higher circulating H19, and overall patients with early stage disease tended to have higher H19 than those with more advanced disease. Therefore, it may be hypothesized that H19 is a marker of the early stages of gastric carcinogenesis. However, this is in contradiction to the findings of Hashad et al (20), who described plasma H19 as a marker of advanced disease. This inconsistency may be in part related to the heterogeneity of gastric tumors, the absence of metastatic GC in the present cohort and the ethnicity of patients (29). Studies with larger sample sizes may provide further insight to settle this discrepancy. A similar requirement is needed to ascertain the prognostic role of circulating H19 in GC. So far, to the best of our knowledge there is a lack of data on the prognostic value of circulating H19 in GC. While the present analysis indicated no prognostic value of circulating H19 in GC, patients with higher H19 expression tended to have longer survival times. Again, this is suggestive that H19 is a marker of early gastric carcinogenesis. It is also noteworthy that the current patients had resectable tumors. Lack of metastatic GC did not allow a comparison between early stage and metastatic disease. Thus, further studies by our group and others should be aimed at clarifying the prognostic role of H19 in GC.
In conclusion, the present study confirms previous data suggesting increased H19 in the circulation of patients with GC. However, this study also appears to provide novel insight. Firstly, the establishment of a defined control group was considered important to define the exact role of H19 in GC. Establishment of appropriate control groups is a universal challenge in case-control studies (30). Therefore, the confirmation of the absence of malignancy in control individuals in the current study was considered important for the accuracy of expression values. Secondly, H19 expression was analyzed with respect to tumor load, and it was identified that following surgery, plasma H19 levels decreased substantially in the majority of patients tested, indicating that a significant proportion of plasma H19 originates from tumor tissue. Thirdly, this study provides information on the prognostic role of H19 in GC, for which there is no apparent published data. Thus, despite certain limitations including small sample size, short follow-up time to assess patient survival and the imbalance of case numbers in the subgroups, the present study identified H19 as a marker with potential diagnostic utility in GC. It may be also of relevance in the assessment of therapy efficiency, which requires further investigation.
Acknowledgements
Not applicable.
Funding
The present study was supported by a grant from the Istanbul University Scientific Projects Coordination Unit, Istanbul, Turkey (awarded to EEY, grant no. 53815).
Availability of data and materials
The datasets used and/or analyzed during the present study are available from the corresponding author on reasonable request.
Authors' contributions
EEY, MK, CBK, SH and UG were responsible for conception and design of the study, MK and CBK for provision of study materials and clinical data, and all authors for data analysis and interpretation, and manuscript writing.
Ethics approval and consent to participate
The present study was approved by the Ethics Committee of Istanbul Medical Faculty, Istanbul University (approval no. 2014/1180) and all subjects provided informed consent prior to their participation.
Consent for publication
Patients provided written informed consent for the publication of any associated data and accompanying images.
Competing interests
The authors declare that they have no competing interests.
References
- 1.Hudler P. Challenges of deciphering gastric cancer heterogeneity. World J Gastroenterol. 2015;21:10510–10527. doi: 10.3748/wjg.v21.i37.10510. [DOI] [PMC free article] [PubMed] [Google Scholar]
- 2.Marqués-Lespier JM, González-Pons M, Cruz-Correa M. Current perspectives on gastric cancer. Gastroenterol Clin North Am. 2016;45:413–428. doi: 10.1016/j.gtc.2016.04.002. [DOI] [PMC free article] [PubMed] [Google Scholar]
- 3.Siegel RL, Miller KD, Jemal A. Cancer statistics, 2015. CA Cancer J Clin. 2015;65:15–29. doi: 10.3322/caac.21254. [DOI] [PubMed] [Google Scholar]
- 4.Berger H, Marques MS, Zietlow R, Meyer TF, Machado JC, Figueiredo C. Gastric cancer pathogenesis. Helicobacter. 2016;21(Suppl 1):34–38. doi: 10.1111/hel.12338. [DOI] [PubMed] [Google Scholar]
- 5.Figueiredo C, Garcia-Gonzalez MA, Machado JC. Molecular pathogenesis of gastric cancer. Helicobacter. 2013;18(Suppl 1):28–33. doi: 10.1111/hel.12083. [DOI] [PubMed] [Google Scholar]
- 6.Fan B, Dachrut S, Coral H, Yuen ST, Chu KM, Law S, Zhang L, Ji J, Leung SY, Chen X. Integration of DNA copy number alterations and transcriptional expression analysis in human gastric cancer. PLoS One. 2012;7:e29824. doi: 10.1371/journal.pone.0029824. [DOI] [PMC free article] [PubMed] [Google Scholar]
- 7.Leal Ferreira M, Pimentel Assumpção P, Smith Cardoso M, Burbano RR. Searching for gastric cancer biomarkers through proteomic approaches. J Gastroenterol Hepatol Res. 2014;3:989–995. [Google Scholar]
- 8.Bass AJ, Thorsson V, Shmulevich I, Reynolds SM, Miller M, Bernard B, Hinoue T, Laird PW, Curtis C, Shen H, et al. Cancer Genome Atlas Research Network: Comprehensive molecular characterization of gastric adenocarcinoma. Nature. 2014;513:202–209. doi: 10.1038/nature13480. [DOI] [PMC free article] [PubMed] [Google Scholar]
- 9.Ang YL, Yong WP, Tan P. Translating gastric cancer genomics into targeted therapies. Crit Rev Oncol Hematol. 2016;100:141–146. doi: 10.1016/j.critrevonc.2016.02.007. [DOI] [PubMed] [Google Scholar]
- 10.Abbas M, Faggian A, Sintali DN, Khan GJ, Naeem S, Shi M, Dingding C. Current and future biomarkers in gastric cancer. Biomed Pharmacother. 2018;103:1688–1700. doi: 10.1016/j.biopha.2018.04.178. [DOI] [PubMed] [Google Scholar]
- 11.Carlomagno N, Incollingo P, Tammaro V, Peluso G, Rupealta N, Chiacchio G, Sotelo Sandoval ML, Minieri G, Pisani A, Riccio E, et al. Diagnostic, predictive, prognostic, and therapeutic molecular biomarkers in third millennium: A breakthrough in gastric cancer. BioMed Res Int. 2017;2017:7869802. doi: 10.1155/2017/7869802. [DOI] [PMC free article] [PubMed] [Google Scholar]
- 12.Gupta Chandra S, Tripathi Nandan Y. Potential of long non-coding RNAs in cancer patients: From biomarkers to therapeutic targets. Int J Cancer. 2017;140:1955–1967. doi: 10.1002/ijc.30546. [DOI] [PubMed] [Google Scholar]
- 13.Angrand PO, Vennin C, Le Bourhis X, Adriaenssens E. The role of long non-coding RNAs in genome formatting and expression. Front Genet. 2015;6:165. doi: 10.3389/fgene.2015.00165. [DOI] [PMC free article] [PubMed] [Google Scholar]
- 14.Brannan CI, Dees EC, Ingram RS, Tilghman SM. The product of the H19 gene may function as an RNA. Mol Cell Biol. 1990;10:28–36. doi: 10.1128/MCB.10.1.28. [DOI] [PMC free article] [PubMed] [Google Scholar]
- 15.Gabory A, Jammes H, Dandolo L. The H19 locus: Role of an imprinted non-coding RNA in growth and development. BioEssays. 2010;32:473–480. doi: 10.1002/bies.200900170. [DOI] [PubMed] [Google Scholar]
- 16.Ariel I, Sughayer M, Fellig Y, Pizov G, Ayesh S, Podeh D, Libdeh BA, Levy C, Birman T, Tykocinski ML, et al. The imprinted H19 gene is a marker of early recurrence in human bladder carcinoma. Mol Pathol. 2000;53:320–323. doi: 10.1136/mp.53.6.320. [DOI] [PMC free article] [PubMed] [Google Scholar]
- 17.Raveh E, Matouk IJ, Gilon M, Hochberg A. The H19 Long non-coding RNA in cancer initiation, progression and metastasis - a proposed unifying theory. Mol Cancer. 2015;14:184. doi: 10.1186/s12943-015-0458-2. [DOI] [PMC free article] [PubMed] [Google Scholar]
- 18.Jing W, Zhu M, Zhang XW, Pan ZY, Gao SS, Zhou H, Qiu SL, Liang CZ, Tu JC. The significance of long noncoding RNA H19 in predicting progression and metastasis of cancers: A meta-analysis. BioMed Res Int. 2016;2016:5902678. doi: 10.1155/2016/5902678. [DOI] [PMC free article] [PubMed] [Google Scholar]
- 19.Zhou X, Yin C, Dang Y, Ye F, Zhang G. Identification of the long non-coding RNA H19 in plasma as a novel biomarker for diagnosis of gastric cancer. Sci Rep. 2015;5:11516. doi: 10.1038/srep11516. [DOI] [PMC free article] [PubMed] [Google Scholar]
- 20.Hashad D, Elbanna A, Ibrahim A, Khedr G. Evaluation of the role of circulating long non-coding RNA H19 as a promising novel biomarker in plasma of patients with gastric cancer. J Clin Lab Anal. 2016;30:1100–1105. doi: 10.1002/jcla.21987. [DOI] [PMC free article] [PubMed] [Google Scholar]
- 21.Yang T, Zeng H, Chen W, Zheng R, Zhang Y, Li Z, Qi J, Wang M, Chen T, Lou J, et al. Helicobacter pylori infection, H19 and LINC00152 expression in serum and risk of gastric cancer in a Chinese population. Cancer Epidemiol. 2016;44:147–153. doi: 10.1016/j.canep.2016.08.015. [DOI] [PubMed] [Google Scholar]
- 22.Li H, Yu B, Li J, Su L, Yan M, Zhu Z, Liu B. Overexpression of lncRNA H19 enhances carcinogenesis and metastasis of gastric cancer. Oncotarget. 2014;5:2318–2329. doi: 10.18632/oncotarget.1913. [DOI] [PMC free article] [PubMed] [Google Scholar]
- 23.Livak KJ, Schmittgen TD. Analysis of relative gene expression data using real-time quantitative PCR and the 2(-Delta Delta C(T)) Method. Methods. 2001;25:402–408. doi: 10.1006/meth.2001.1262. [DOI] [PubMed] [Google Scholar]
- 24.Matouk IJ, Raveh E, Abu-lail R, Mezan S, Gilon M, Gershtain E, Birman T, Gallula J, Schneider T, Barkali M, et al. Oncofetal H19 RNA promotes tumor metastasis. Biochim Biophys Acta. 2014;1843:1414–1426. doi: 10.1016/j.bbamcr.2014.03.023. [DOI] [PubMed] [Google Scholar]
- 25.Ishii S, Yamashita K, Harada H, Ushiku H, Tanaka T, Nishizawa N, Yokoi K, Washio M, Ema A, Mieno H, et al. The H19-PEG10/IGF2BP3 axis promotes gastric cancer progression in patients with high lymph node ratios. Oncotarget. 2017;8:74567–74581. doi: 10.18632/oncotarget.20209. [DOI] [PMC free article] [PubMed] [Google Scholar]
- 26.Li H, Yu B, Li J, Su L, Yan M, Zhu Z, Liu B. Overexpression of lncRNA H19 enhances carcinogenesis and metastasis of gastric cancer. Oncotarget. 2014;5:2318–2329. doi: 10.18632/oncotarget.1913. [DOI] [PMC free article] [PubMed] [Google Scholar]
- 27.Tong YS, Wang XW, Zhou XL, Liu ZH, Yang TX, Shi WH, Xie HW, Lv J, Wu QQ, Cao XF. Identification of the long non-coding RNA POU3F3 in plasma as a novel biomarker for diagnosis of esophageal squamous cell carcinoma. Mol Cancer. 2015;14:3. doi: 10.1186/1476-4598-14-3. [DOI] [PMC free article] [PubMed] [Google Scholar]
- 28.Grimaldi A, Zarone MR, Irace C, Zappavigna S, Lombardi A, Kawasaki H, Caraglia M, Misso G. Non-coding RNAs as a new dawn in tumor diagnosis. Semin Cell Dev Biol. 2017;17:30258–30260. doi: 10.1016/j.semcdb.2017.07.035. [DOI] [PubMed] [Google Scholar]
- 29.Cheng XJ, Lin JC, Tu SP. Etiology and prevention of gastric cancer. Gastrointest Tumors. 2016;3:25–36. doi: 10.1159/000443995. [DOI] [PMC free article] [PubMed] [Google Scholar]
- 30.Zhong C, Cockburn M, Cozen W, Voutsinas J, Lacey JV, Jr, Luo J, Sullivan-Halley J, Bernstein L, Wang SS. Evaluating the use of friend or family controls in epidemiologic case-control studies. Cancer Epidemiol. 2017;46:9–13. doi: 10.1016/j.canep.2016.10.007. [DOI] [PMC free article] [PubMed] [Google Scholar]
Associated Data
This section collects any data citations, data availability statements, or supplementary materials included in this article.
Data Availability Statement
The datasets used and/or analyzed during the present study are available from the corresponding author on reasonable request.