

Abstract
Charcot–Marie–Tooth disease type 2A (CMT2A) is caused by dominant alleles of the mitochondrial pro‐fusion factor Mitofusin 2 (MFN2). To address the consequences of these mutations on mitofusin activity and neuronal function, we generate Drosophila models expressing in neurons the two most frequent substitutions (R94Q and R364W, the latter never studied before) and two others localizing to similar domains (T105M and L76P). All alleles trigger locomotor deficits associated with mitochondrial depletion at neuromuscular junctions, decreased oxidative metabolism and increased mtDNA mutations, but they differently alter mitochondrial morphology and organization. Substitutions near or within the GTPase domain (R94Q, T105M) result in loss of function and provoke aggregation of unfused mitochondria. In contrast, mutations within helix bundle 1 (R364W, L76P) enhance mitochondrial fusion, as demonstrated by the rescue of mitochondrial alterations and locomotor deficits by over‐expression of the fission factor DRP1. In conclusion, we show that both dominant negative and dominant active forms of mitofusin can cause CMT2A‐associated defects and propose for the first time that excessive mitochondrial fusion drives CMT2A pathogenesis in a large number of patients.
Keywords: CMT2A, MFN2, mitochondrial fusion, mitofusin, peripheral neuropathy
Subject Categories: Membrane & Intracellular Transport, Metabolism, Neuroscience
Introduction
Charcot–Marie–Tooth diseases (CMT), also called hereditary sensory motor neuropathies (HSMN), compose a heterogeneous family of genetically inherited human disorders affecting the peripheral nervous system 1. In opposition to CMT1, which results from myelin sheath loss, CMT2 is characterized by axonal alterations typically associated with reduced amplitude of nerve action potentials. The most severe and most frequent form of CMT2 is the subtype A (CMT2A) 1, 2, which preferentially affects motor and sensory neurons with the longest axons, resulting in muscle atrophy, hand and feet deformities, and loss of perception in the distal part of the limb 2. The onset of CMT2A ranges from the first to the fifth decade, the early forms being more severe and possibly associated with neurodegeneration 3, 4, 5. Although few recessive forms have been described 6, 7, CMT2A is mainly associated with dominant mutations scattered all along the MFN2 gene coding sequence 2, 3. The mechanisms by which these MFN2 mutations trigger neuronal dysfunctions remain unknown, and there is currently no cure for patients.
MFN2 encodes a mitochondrial outer membrane protein belonging to a family of highly conserved dynamin‐related GTPases named mitofusins (MFNs) 8, 9, 10. Fungi, nematodes, and insects encode a single or a single ubiquitously expressed MFN‐homolog, such as Fzo1p in Saccharomyces cerevisiae or MARF in Drosophila melanogaster. Vertebrates encode two ubiquitously expressed homologs with high‐sequence similarity (MFN1 and MFN2), but studies in mice indicate that MFN2 is the main MFN expressed in peripheral nerves 11. MFNs support mitochondrial fusion, a GTP‐dependent process that enables inter‐mitochondrial exchanges essential for oxidative metabolism and results in mitochondrial elongation 12, 13. The precise role played by MFNs in membrane fusion and their mechanism of action are still speculative 14, as well as the consequences of CMT2A mutations on MFN function. Mitochondrial fusion is antagonized by mitochondrial fission, a process supported by another dynamin‐related GTPase, DRP1 15, and the balance between antagonizing fusion and fission reactions determines the overall morphology and dynamic properties of mitochondrial networks. Consequently, MFN inactivation results in mitochondrial fragmentation, through ongoing fission, and that of DRP1 provokes the appearance of hyper‐fused mitochondria 10. Of note, the GTPases involved in fusion and fission have been reported to play additional roles in other cellular processes, including apoptotic outer membrane permeabilization, interactions between endoplasmic reticulum and mitochondria, and coenzyme Q maintenance 8, 10, 16.
A tight regulation of the mitochondrial fusion/fission balance appears crucial to sustain neuronal activity. Indeed, mitochondrial fragmentation was linked to different neurodegenerative processes, and fission inhibitors were shown to provide neuroprotection in vitro and in vivo 17, 18. In addition, mutations in fusion and fission factors were associated with neurological disorders (OPA1: optic atrophy; DRP1: microcephaly, optic atrophy; MFF: Leigh‐like encephalopathy, neuropathy) including CMT (GDAP1/CMT2K and CMT4A) 8, 19, 20. While studies in animal models revealed that DRP1 inactivation alters mitochondrial distribution in neurites 21 leading to mitochondrial depletion at synapses 22, the roles of mitochondrial fusion and MFNs in neurons are poorly documented. In mouse, MFN2 knockout die at midembryogenesis 13 and neuronal‐specific knockout 23, 24, 25 trigger severe neurological defects and neurodegeneration. These models confirm the requirement of MFN2 and the relevance of mitochondrial fusion for neuronal function, but do not mimic the specific alterations of peripheral sensorimotor nerves observed in CMT2A patients. The study of transgenic mice expressing MFN2 mutations associated with CMT2A revealed animals with locomotor defects associated with axonal loss 26, or alterations of axonal width 27, 28. However, the origin of these neuronal alterations and their link with altered MFN activity remains unknown. Indeed, the sole available in vivo analysis of mitochondria in CMT2A mouse models was limited and only showed a distal accumulation of mitochondria in peripheral nerves 27.
To advance our understanding of CMT2A pathogenesis, we developed four in vivo models of CMT2A by expressing different pathogenic MFN mutations in neurons of transgenic Drosophila. We chose to model the two most frequent substitutions, R94Q and R364W, identified in more than 25 patients each (Appendix Table S1 and 2) and two further alleles, L76P and T105M 2, that localize to similar domains of MFN (Figs 1 and EV1). Mutations of the R94 and R364 residues are associated with severe early forms of CMT2A and, in some patients, to optic atrophy, a disease condition referred as CMT6/HSNMIV 4, 29, 30. Of note, despite their high prevalence, mutations of the R364 residue have never been studied in cellular or animal models. We show that, when expressed in wild‐type fly neurons, the four CMT2A‐mimetic alleles are dominant and induce severe locomotor deficits. At the cellular level, the four mutations result in impaired mitochondrial functions and integrity, aberrant mitochondrial morphology and organization in neuronal soma, and mitochondrial depletion at neuromuscular junctions. Interestingly, however, MFN mutations at the edge or within the GTPase domain (corresponding to R94Q and T105M, Figs 1A and EV1) drive the clustering of unfused mitochondria, whereas those localizing to the adjacent helix bundle HB1 (corresponding to R364W and L76P, Figs 1A and EV1) provoke fusion‐mediated mitochondrial enlargement.
Figure 1. Neuronal expression of CMT2A‐mimetic alleles triggers locomotor defects in flies.
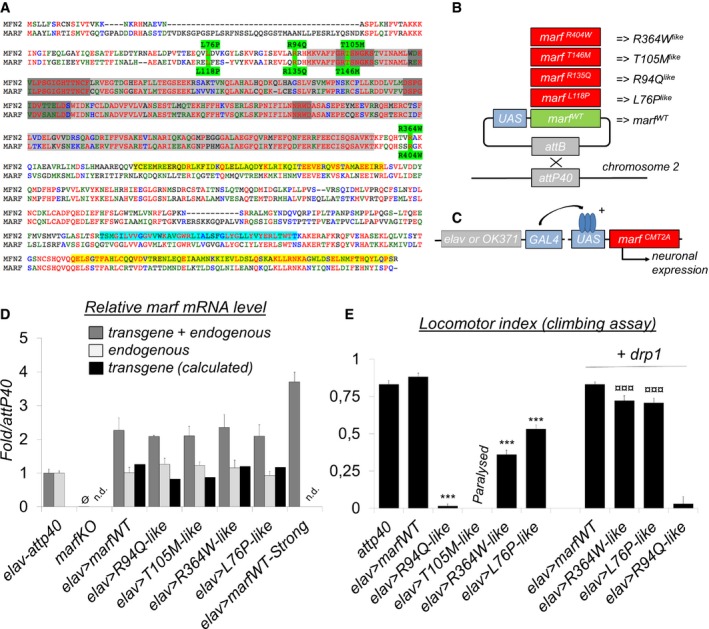
- Sequence alignment of human MFN2 and Drosophila MARF. MFN2 mutations and homologous MARF residues (green), GTP‐binding domain (light gray), GTP‐binding motifs G1 to G4 (dark gray), coiled‐coil/CC domains (yellow), and transmembrane/TM domains (cyan). R94 and T105 are, respectively, located at the edge and within the GTP‐binding domain (position in folded structure see Fig EV1). L76 and R364, that appear distant in the MFN2 linear sequence, are in fact part of the same helix bundle (HB1) as shown in the folded structure (Fig EV1).
- We mutated the amino acids homologous to R94, T105, R364, and L76 in the coding sequence of marf to generate the R404Q, L118P, R135Q, and T146M substitutions (referred here as R364W like, L76P like, R94Q like , and T105M like for simplicity of interpretation), and each marf allele was placed under the transcriptional control of UAS activation sequences. As a control, we similarly generated a wild‐type UAS‐marf construct. The five marf transgenes were inserted at the attP40 insertion site to insure similar genetic background and expression level.
- The expression of the UAS‐marf CMT2A alleles was specifically induced into the neurons of wild‐type flies using the pan‐neuronal driver elav‐GAL4 which targets all central and peripheral neurons or the glutamatergic driver OK371‐GAL4 which facilitates the imaging of motor neurons.
- qRT–PCR performed on larval nervous system extracts showing marf mRNA level relative to control (elav>attp40). “transgene + endogenous”: The amplified sequence is present both in mRNAs encoded by UAS‐marf transgenes and the endogenous marf gene. “endogenous”: amplification of the 3′UTR region that is absent from mRNAs transcribed from UAS‐marf transgenes. The level of “transgene” was calculated (“transgene+endogenous”‐”endogenous”). (mRNA levels ± SD represent the mean value for two independent mRNA extracts each obtained from 12 dissected larval brains). marf KO: knockout of the marf endogenous gene deleting the whole coding sequence and abolishing mRNA expression (Ø : value close to 0) (Appendix Fig S2 for technical details). marf Strong: previously generated UAS‐marf transgene 33 inserted at a different genomic location and leading to higher expression level than the UAS‐marfWT transgene described in this study.
- Result of negative geotaxis test (NGT). Flies were placed into a vertical column and tapped to the bottom to induce escape behavior. After 30 s, the flies reaching the top of the column (N top) and the flies remaining at the bottom (N bot) are counted to calculate a locomotor index (±SEM) defined as: 1/2*(N total + N top − N bot)/N total. Nine races involving three groups of 10 flies for each genotype. Mann–Whitney test results: marfWT versus CMT2A alleles ***P < 0.001. R364W like or L76P like versus same condition + drp1: ¤¤¤P < 0.001. “Paralysis”: NGT not performed on T105M like flies because these animals are completely paralyzed.
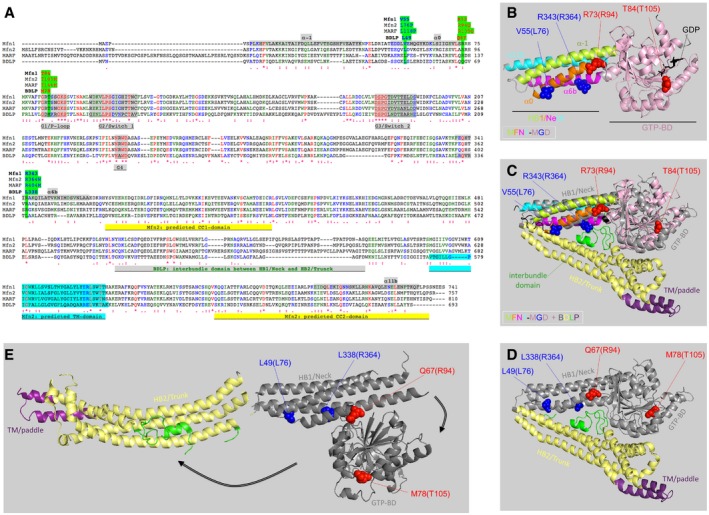
Figure EV1. Localization of CMT2A mutations and homologous residues within sequence and structure of mitofusins and BDLP (related to Fig 1).
-
ASequence alignment of human MFN1 and MFN2, Drosophila MARF, and cyanobacterial BDLP. The position of MFN2 mutations and homologous residues is highlighted in green. Other highlighted features are as follows: alpha‐helices of helix bundle HB1/Neck in the 3D structure of MFN1 (a1, a0, a6b, a11b), GTP‐binding motifs G1 to G4, coiled‐coil/CC domains, and transmembrane/TM domains predicted in MFN2 and interbundle domain in BDLP 3D structure.
-
BStructure of GDP‐bound MFN1‐MGD (5GNT). The MFN1 residues homologous to mutated MFN2 residues (in brackets) are shown in blue or red. R94 is located at the boundary between HB1 and the GTP‐binding domain (GTP‐BD), and T105 is within the G1‐motif of the GTPase domain. L76 and R364 are both parts of HB1. Color code of protein domains: helices of HB1/Neck: green, orange, pink, cyan; GTP‐binding domain: light pink.
-
CStructural alignment of GDP‐bound MFN1‐MGD (color codes as in B) and “closed” conformation of GDP‐bound BDLP (2J68). Color codes of BDLP domains: GTP‐BD & HB1/Neck: gray, HB2/Trunk: yellow, TM/paddle: purple and interbundle: green.
-
D, EStructure of “closed”, GDP‐bound BDLP (2J68, D) and of “extended”, GTP‐bound BDLP (2W6D, E). Arrows point to major changes in the relative position/orientation of the GTP‐binding domain and the trunk (color codes as in C). The BLDP residues homologous to mutated MFN2 residues (in brackets) are shown in blue or red.
Functional analysis of the human MFN2 alleles in mouse cells confirmed that hMFN2‐R94Q and T105M are fusion‐incompetent and that, surprisingly, hMFN2‐R364W or L76P are fusion‐competent. We further demonstrate that enhanced fission by DRP1 over‐expression rescues the alterations of mitochondrial morphology and distribution as well as locomotor deficit in the R364W fly model. Our findings demonstrate that, in at least two CMT2A alleles, including one of the most frequent, neuronal dysfunctions are provoked by increased mitochondrial fusion in neurons. We therefore propose that both deficient and excessive MFN activity drive CMT2A pathogenesis.
Results
Fly models of CMT2A develop neurological defects
To study the pathogenicity of the CMT2A alleles R94Q, T105M, R364W, and L76P in Drosophila, we introduced mutations homologous to these amino acid substitutions into the coding sequence of the fly MFN‐homolog namely marf (Fig 1A and B). The four CMT2A alleles, plus a control marf wild‐type cDNA, were placed under the transcriptional control of UAS activating sequences and inserted at the same genomic location (Fig 1B). To model CMT2A disease that is genetically defined as dominant, the transgenes were expressed in neurons of wild‐type animals (Fig 1C) leading to similar expression level (Fig 1D). The low expression of the transgenes (Fig 1D) mimics well the situation in patient's tissue in which pathogenic and wild‐type alleles are supposedly expressed at similar levels. To determine whether the CMT2A alleles were sufficient to impair neuronal activity in Drosophila, we analyzed the flies’ locomotion. While neuronal expression of the marf wild‐type transgene had no effect, the four CMT2A alleles impair locomotor capacity (Fig 1E). The locomotor performances of R94Q like, R364W like , and L76P like flies were reduced by 95, 65, and 50%, respectively, and T105M like animals display paralysis that prevents the hatching of most adult flies. These results demonstrate that all tested marf alleles carrying CMT2A mutations are dominant and pathogenic in Drosophila, leading to neurological alterations.
CMT2A fly models develop different alterations of mitochondrial morphology in neurons
Then, we analyzed the consequences of the CMT2A alleles on mitochondrial morphology by imaging living larval motor neurons that are easily accessible to in vivo microscopy. Consistent with increased mitochondrial fusion, expression of control marfWT transgene increased mitochondrial length in neuronal cell bodies (Fig 2A–D), whereas knocking down marf resulted in mitochondrial fragmentation (marf_RNAi, Fig 2B–D). In contrast, in neurons expressing R94Q like and T105M like, most visible mitochondria were sequestered into one or few massive mitochondrial aggregates (Fig 2A and B, and Appendix Fig S1 OK371‐GAL4, and Fig EV2B elav‐GAL4) composed by a myriad of tightly packed mitochondria (Fig 2E). Interestingly, in neuronal cell bodies expressing R364W like and L76P like, the mitochondrial morphology was affected in a very different manner, with the presence of numerous large round shape mitochondria distributed throughout the cytoplasm among few long mitochondrial tubules (Fig 2A–C and F, and Appendix Fig S1 OK371‐GAL4, and Fig EV2B elav‐GAL4). Electron microscopy confirmed that the abnormal structures detected by fluorescence correspond to mitochondria (Fig 2E) that were on average bigger (Fig 2G). Cristae and matrix were electron dense and not distended (Fig 2E), demonstrating that increased size was not a consequence of unspecific swelling. To test whether the CMT2A alleles affect mitochondrial fusion, we performed in vivo photoconversion experiments. In control marfWT neurons (Movie EV1 and detailed description of the experiment Fig EV3), mitochondrial tubules are fused and therefore photoconverted molecules of matrix‐targeted Dendra2 (mit::dendra2) diffuse outside the initial photoconversion area. In contrast, red mit::dendra2 molecules remained in the vicinity of the photoconverted area in neurons expressing R94Q like and T105M like, showing that aggregated mitochondria are separate and cannot fuse in these cells (Movies EV2 and EV3, and Fig EV3). This was not the case in neurons expressing R364W like and L76P like in which the fluorescent probe was able to diffuse (Movies EV4–EV6 and Fig EV3). Taken together, these results show that mutations associated with the GTPase domain (R94Q like and T105M like) cluster mitochondria and inhibit fusion, whereas those within HB1 domain (R364W like and L76P like) trigger the formation of enlarged mitochondria that are well connected to the mitochondrial network.
Figure 2. The CMT2A‐mimetic alleles differently alter mitochondrial morphology in fly neurons.
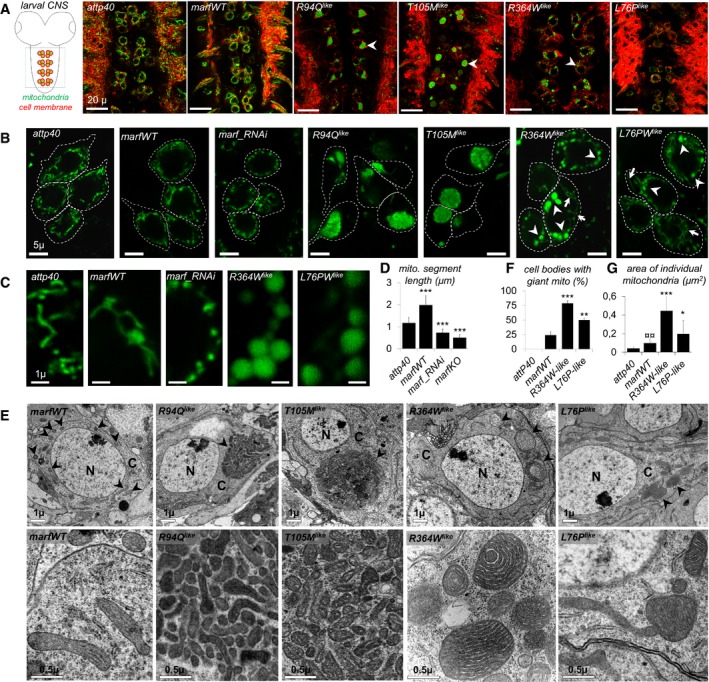
- Scheme and confocal imaging of living larval ventral nerve cord showing midline motor neurons targeted by the OK371‐GAL4 driver (red: plasma membrane/myr::RFP; green mitochondria/mit::dendra2). Arrowheads point to cell bodies with abnormal mitochondrial distribution/shape. Scale bars 20 μm.
- Higher magnification views of living motor neuron cell bodies showing mitochondrial morphology (green: mitochondria/mit::dendra2). To facilitate mitochondrial observation, myr::RFP staining was used to draw the outline of the cell (dotted lines). R364W like or L76P like, arrowheads point to enlarged spherical mitochondria and arrows to mitochondrial tubules. See also: motor neuron‐specific staining in Appendix Fig S1 and similar mitochondrial alterations induced upon pan‐neuronal expression of the CMT2A alleles with the elav‐GAL4 driver Fig EV2. Scale bars 5 μm.
- Higher magnification views of mitochondria (green: mitochondria/mit::dendra2; living tissue). Scale bars 1 μm.
- Quantification of mitochondrial segment length (μm) (number of mitochondria analyzed: attp40/212, marfWT/124, marf_RNAi/95, marf KO/79). ±SEM. Mann–Whitney U test results (versus attP40): ***P < 0.001.
- Transmission electron microscopy sections of ventral nerve cord from larvae expressing the different marf alleles. Top panels: neuron cell body section showing cytoplasmic compartments (scale bars 1 μm). Arrowheads point to mitochondria. N, nucleus; C, cytoplasm. Bottom panels: higher magnification views (scale bars 0.5 μm).
- Average number of cell bodies containing giant spherical mitochondria (number of neurons analyzed: attp40/80, marfWT/72, R364W like/96, L76P like/118; four independent larval brains). ±SEM. Mann–Whitney U test results (versus marfWT): ***P < 0.001, **P < 0.01.
- Area quantification of individual mitochondria (μm2). Number of mitochondria analyzed on EM sections: attp40/101, marfWT/118, R364W like/190. ±SEM. Mann–Whitney U test results: R364W like or L76P like versus marfWT ***P < 0.001 and *P < 0.05; marfWT versus attp40 ¤¤P < 0.01.
Figure EV2. Mitochondrial alterations induced by the marf CMT2A alleles when expressed under the control of the pan‐neuronal driver elav‐GAL4 (related to Fig 2).
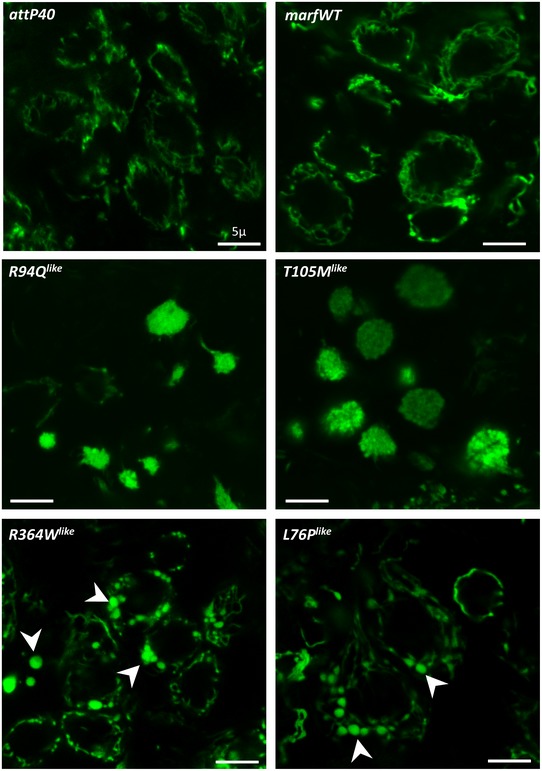
Confocal images of living midline ventral nerve cord neurons from elav‐GAL4, UAS‐mit::dendra2, and UAS‐marf CMT2A larvae showing that mitochondrial organization is altered by the UAS‐marf CMT2A transgenes (control: UAS‐marfWT transgene): R94Q like and T105M like induced mitochondrial aggregation, whereas R364W like and L76P like resulted in the formation of enlarged spherical mitochondria (arrowheads). Scale bars 5 μm.
Figure EV3. Analysis of mitochondrial interconnectivity in fly motor neurons expressing the CMT2A alleles. (related to Movie EV1/marfWT, Movie EV2/R94Q like, Movie EV3/T105M like, Movies EV4 and EV5/R364W like , and Movie EV6/L76P like).
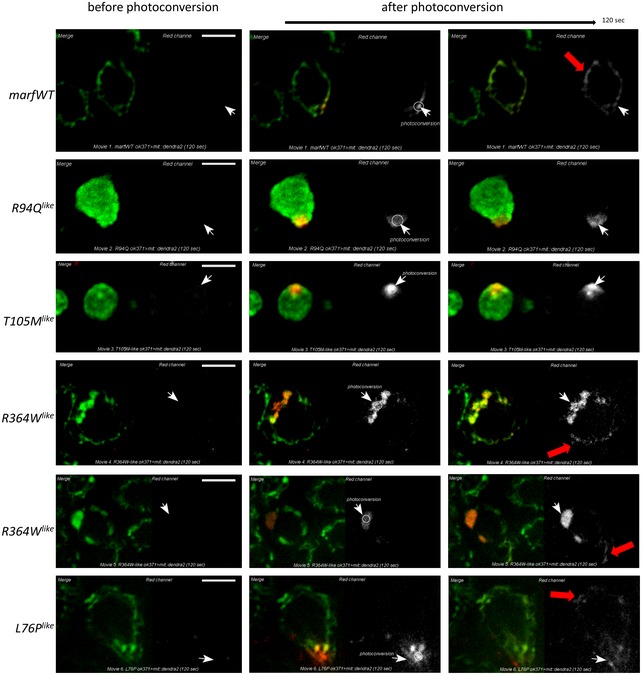
Live time‐lapse microscopy of ventral nerve cord motor neurons (confocal section) in dissected nervous systems from OK371‐GAL4 UAS‐mit::dendra2 larvae expressing different marf transgenes. On left panels, green labeling of non‐photoconverted mit::dendra2 molecules reveals the morphology of the mitochondria in neuronal soma, and red labeling corresponds to the signal of photoconverted molecules. On right panels, photoconversion in a restricted mitochondrial area (white arrows) produces red mit::dendra2 molecules (grayscale pattern). 120 s after photoconversion, red mit::dendra2 molecules are detected away from the photoconverted area in neurons expressing marfWT, R364W like , and L76P like (red arrow) but not in those expressing R94Q like and T105M like. Scale bars 5 μm.
Highly prevalent R364W allele encodes a fusion‐competent mitofusin
The morphology, interconnectivity, and ultrastructure of mega‐mitochondria suggested that, in contrast to R94Q and T105M mutants, R364W and L76P alleles do not impair mitochondrial fusion. In order to reveal the intrinsic activity of the CMT2A mutant, we expressed these pathogenic proteins in cells devoid of endogenous MFN. To that purpose, we generated knockout flies carrying a deletion which abolishes endogenous marf expression (Appendix Fig S2 and Fig 1D). In these flies, mitochondrial fragmentation was rescued by our marfWT transgene, but not by R94Q like and T105M like that still aggregated mitochondria (Fig 3A). In contrast, R364W like and L76P like could restore mitochondrial tubules formation but also generated few large mitochondrial spheres (Fig 3A). To confirm that human R364W and L76P alleles encode fusion‐competent MFNs, we analyzed their function in mouse embryonic fibroblasts (MEFs) devoid of MFN1 and MFN2. In this well‐established experimental system 31, mitochondria, that are initially fragmented, elongate to form tubules upon expression of a fusion‐competent MFN. Consistently, expression of mouse MFN2 (Fig EV4A and C), human MFN2 (Fig 3B and C), and Drosophila marf (Fig EV4A and C) transgenes restored filamentous mitochondrial morphology, confirming the high conservation of fusion machineries between these species. Then, transfection with human MFN2 containing CMT2A mutations revealed that cells expressing R94Q and T105M did not form filamentous mitochondria and contained clustered mitochondria in a higher proportion (Figs 3B and C, and EV4B and C), while those expressing L76P and R364W were able to elongate mitochondria into tubules (Figs 3B and C, and EV4B and C). Of note, we observed more cells with filamentous mitochondria and less with aggregates upon transfection with R364W (Fig 3C). To directly assess mitochondrial fusion capacity, we used a polyethylene glycol (PEG)‐based cell fusion assay 32. We generated MEF lines stably expressing human wild‐type or mutant MFN2 alleles as well as red or green fluorescent proteins targeted to mitochondria. After plasma membrane fusion of cells with green and red‐labeled mitochondria, we quantified fusion‐mediated exchange of mitochondrial fluorescent proteins. Consistently, whereas non‐fusogenic mitochondria lacking mitofusins remained singly labeled (−/−, Fig 3D and E), those in which wild‐type human MFN2 was expressed appeared double‐stained (Hs‐MFN2, Fig 3D and E). In contrast, we confirmed that MFN2‐R94Q is not fusion‐competent (Fig 3D and E) and that the effect of this mutation is dominant, as mitochondria expressing this allele were unable to fuse with mitochondria expressing wild‐type human MFN2 (Figs 3F and EV4D). Most importantly, these fusion assays revealed that mitochondria expressing human MFN2‐R364W display a fusion capacity that was similar (homotypic experiments, Fig 3D and E) or slightly higher (heterotypic experiments, Figs 3F and EV4D) to that of wild‐type human MFN2. Taken together, these results confirm that R94Q and T105M mutants cannot support fusion but can still tether mitochondria and, surprisingly, demonstrate that R364W and L76P mutants are fusion‐competent.
Figure 3. Pathogenic CMT2A alleles located to the helix bundle 1 (R364W, L76P) are fusion‐competent in MFN‐null fly neurons and mouse fibroblasts.
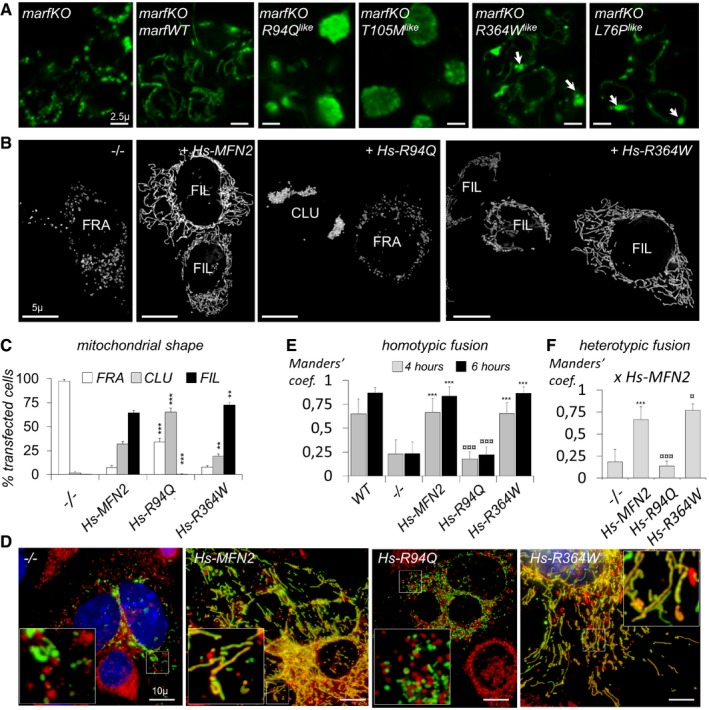
- Expression of the marf CMT2A alleles in motor neurons of marf knockout larvae (marf KO /Y; OK371‐GAL4, UAS‐mit::dendra2). Arrows show mitochondrial spheres (living tissue). Although expression of marf wild‐type or CMT2A transgenes in motor neurons rescues or modifies mitochondrial morphology, it does not rescue developmental delay and lethality of marf knockout larvae due to the lack of marf in whole body (see Appendix Fig S2 and methods for additional details regarding marf knockout animals). Scale bars 2.5 μm.
- Mouse embryonic fibroblasts devoid of MFN1 and MFN2 (MFN1/MFN2‐null cells) were transfected with mtGFP (GFP targeted to the mitochondrial matrix) alone (−/−) or co‐transfected with wild‐type human (Hs) MFN2 or with the R94Q or R364W mutants. Visualization of mitochondrial morphology by fluorescence microscopy of mtGFP. Bar: 5 μm. Cells display fragmented (FRA), filamentous (FIL), and/or clustered (CLU) mitochondrial compartments. (see Fig EV4 for T105M and L76P and rescue with wild type mouse MFN2 or Drosophila marf). Scale bars 5 μm.
- Percentage of transfected mtGFP‐positive cells displaying fragmented (FRA), filamentous (FIL), and/or clustered (CLU) mitochondrial morphology (mean ± SD). Number of transfections = 5 (no MFN), 10 (Hs‐MFN2), 6 (R94Q), 7 (R364W). Mann–Whitney U test results (versus Hs‐MFN2): **P < 0.01, ***P < 0.001.
- Polykaryons obtained by PEG‐induced plasma membrane fusion of MEFs expressing GFP targeted to the matrix (mtGFP) or mCherry targeted to the outer membrane (mChOM). Images were taken 6 h after PEG‐induced fusion. Fused mitochondria exchange red and green fluorescent proteins and appear doubly labeled. Unfused mitochondria remain singly labeled. DAPI‐labeled nuclei appear in blue. Pictures show MFN1/MFN2‐null MEFs (−/−) or MFN1/MFN2‐null MEFs expressing wild‐type (Hs‐MFN2) or mutant human MFN2 alleles (Hs‐R94Q and Hs‐R364W). Scale bars 10 μm.
- Histograms show the mean ± SD of the Manders’ colocalization coefficient for mtGFP in homotypic fusion assay as shown in (C). WT (wild‐type MEFs), −/− (MFN1/MFN2‐null MEFs), Hs‐MFN2 (−/− transduced with human wild‐type MFN2), Hs‐R94Q, and Hs‐R364W (−/− transduced with corresponding human MFN2 alleles). Results are shown 4 or 6 h after PEG‐induced fusion. Polykaryons analyzed (4 h/6 h): WT (15/15), −/− (15/15), Hs‐MFN2 (25/15), Hs‐R94Q (15/15), Hs‐R364W (25/15). Mann–Whitney U test results (* versus −/− 4 or 6 h, ¤ versus Hs‐MFN2 4 or 6 h): ***P < 0.001, ¤¤¤P < 0.001.
- Histograms show the mean ± SD of the Manders’ colocalization coefficient for mtGFP in heterotypic experiments (PEG‐induced fusion of MFN −/− MEFs expressing Hs‐MFN2, labeled with mtGFP, with MFN −/− MEFs expressing Hs‐R94Q or Hs‐R364W, labeled with mCherryOM). Images are shown in Fig EV4D and were taken 4 h after PEG‐induced fusion. Mann–Whitney U test results (* versus −/−, ¤ versus Hs‐MFN2): ***P < 0.001, ¤¤¤P < 0.001, ¤P < 0.05. Polykaryons analyzed: −/− (15), Hs‐MFN2 (25), Hs‐R94Q (15), Hs‐R364W (15).
Figure EV4. Analysis of mitochondrial morphology and fusion in mouse embryonic fibroblasts. (related to Fig 3).
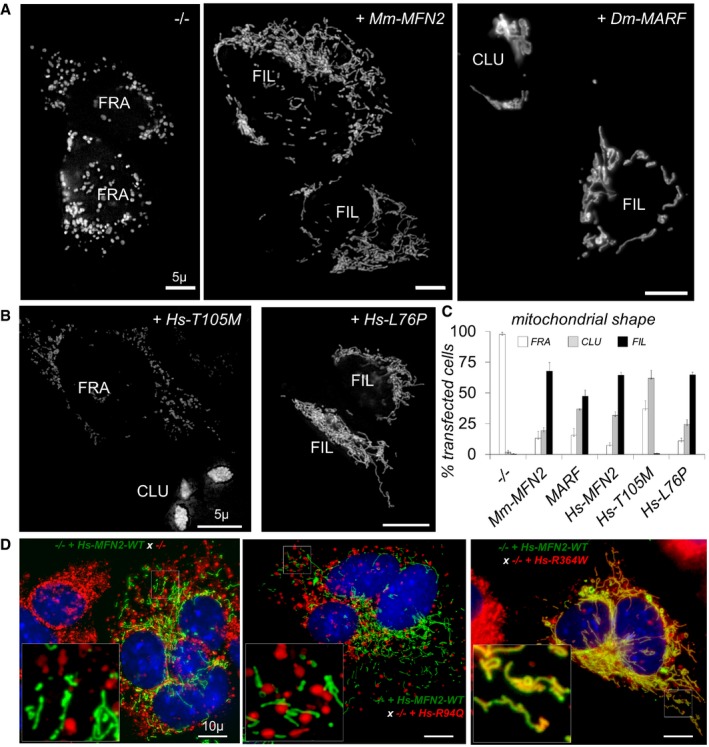
- Cells devoid of MFN1 and MFN2 were transfected with mtGFP alone (−/−) or co‐transfected with mouse (Mm) MFN2 or Drosophila (Dm) MARF. Cells display fragmented (FRA), filamentous (FIL), and/or clustered (CLU) mitochondrial compartments. Scale bars 5 μm.
- Cells devoid of MFN1 and MFN2 (−/−) were transfected with mtGFP with human (Hs) MFN2‐T105M or L76P. Cells display fragmented (FRA), filamentous (FIL), and/or clustered (CLU) mitochondrial compartments. Scale bars 5 μm.
- Percentage of transfected mtGFP cells with fragmented (FRA), filamentous (FIL), or clustered (CLU) mitochondrial morphology (mean ± SD). Number of transfections = 5 (−/−), 5 (Mm‐MFN2/mouse), 3 (MARF), 10 (Hs‐MFN2/human), 6 (Hs‐T105M), and 3 (Hs‐L76P).
- Heterotypic PEG‐induced fusion of MFN −/− MEFs expressing Hs‐MFN2 (green, labeled with mtGFP) with MFN −/− MEFs expressing Hs‐R94Q or Hs‐R364W (red, labeled with mCherryOM) (4 h after fusion). Quantitative analysis is shown in Fig 3F. Scale bars 10 μm.
Enhanced mitochondrial fusion in R364W fly model
To understand how fusion‐competent mutants can alter mitochondrial morphology in neurons and trigger neurological defects, we returned to the fly model. In the following analysis, we focused our study on the comparison between R364W like and R94Q like that mimic the two most frequent CMT2A alleles. We observed that neurons over‐expressing marf via a previously described transgene 33, achieving higher marf expression level than our own UAS‐marfWT transgene (marfWT strong, Fig 1D), exhibited giant mitochondrial spheres (marfWT strong, Fig 4A) similar to those of R364W like‐expressing neurons. We thus inferred that giant mitochondria might originate from excessive mitochondrial fusion and a shift of the fusion/fission balance toward fusion. To test this hypothesis, we investigated whether the giant mitochondrial phenotype was similarly induced by decreasing mitochondrial fission. We showed that expression of a dominant negative mutant of the fission effector DRP1 (drp1 K38A) 34, 35 also induced the formation of mitochondrial spheres similar to those found in R364W fly model (Fig 4A). In cells expressing drp1 K38A, knocking down marf restored normal mitochondrial morphology demonstrating that the giant mitochondrial phenotype was indeed a consequence of unbalanced mitochondrial fusion (Fig 4A). In order to shift the fusion/fission balance toward fission, we over‐expressed drp1 in the neurons of flies expressing the R364W like allele. Consistent with our hypothesis, the giant mitochondria phenotype disappeared (Fig 4B and C), and the average mitochondrial size was close to that of controls (Fig 4D and E). Knocking down the inner‐membrane fusion effector opa1, which is also expected to shift the fusion/fission balance toward fission, similarly led to a reduction of giant mitochondria in the R364W like context (Fig 4B). We then performed the converse experiment by inhibiting fission in the R364W fly model and showed that neurons now contained one or few gigantic spherical mitochondria (Fig 4B and D) as a result of increased size (Fig 4E). In contrast, manipulating drp1 or opa1 activities did not interfere with the formation of mitochondrial aggregates in R94Q fly model (Fig 4B). Finally, we showed that over‐expressing DRP1 was sufficient to normalize the locomotor performances in L76P and R364W fly models (Fig 1E, “+ drp1”) demonstrating that the excessive fusion of mitochondria in neurons is the primary pathogenic mechanism of these alleles.
Figure 4. Enhanced mitochondrial fusion in neurons of the R364W fly model.

- Confocal images of mitochondria showing the presence of large mitochondrial spheres (arrowheads) in living larval motor neurons (OK371‐GAL4; UAS‐mit::dendra2) expressing the marfWT Strong transgene (marf over‐expression at higher expression level than our UAS‐marfWT transgene), or drp1 K38A (dominant negative DRP1), or drp1 K38A + marf_RNAi (RNAi against marf). White line: plasma membrane according to myr::RFP staining. Scale bars 5 μm.
- Confocal images of mitochondria (mit::dendra2) in living larval motor neurons expressing marfWT, R364W like, R94Q like in conjunction with various UAS transgene. + drp1: over‐expression of the fission effector DRP1; + drp1 K38A over‐expression of dominant negative DRP1; and + OPA1_RNAi: RNAi downregulation of the fusion factor OPA1. White line: plasma membrane according to myr::RFP staining. Scale bars 5 μm.
- Quantification of the number of cells containing giant spherical mitochondria ± SEM. Number of cells analyzed: R364W like/96, R364W like + drp1/70. Mann–Whitney U test results: R364W like versus R364W like + drp1 ***P < 0.01.
- TEM images of neurons from larval ventral nerve cords. Top panels: cell bodies (arrowheads, mitochondria; N, nucleus; C, cytoplasm); scale bars 1 μm. Bottom panels: higher magnification images highlighting mitochondrial morphology; scale bars 0.5 μm. + drp1: over‐expression of drp1 and + drp1 K38A: dominant negative DRP1.
- Size distribution of individual mitochondria (area μm2). Number of mitochondria analyzed: attp40/101, marfWT/118, R364W like/190, R364W like +drp1/108, R364W like + drp1 K38A/44. Mann–Whitney U test results performed on the average value of the area: attp40 versus marfWT P < 0.05; marfWT versus R364W like P < 0.001, R364W like versus R364W like + drp1 P < 0.001, R364W like versus R364W like + drp1 K38A P < 0.01.
Increased mitochondrial damages in neurons of R94Q and R364W fly models
While analyzing mitochondrial morphology by electron microscopy, we noticed that neurons expressing R364W like and R94Q like contained vesicular structures (Fig 5A) that were never observed in marfWT control animals. These structures were found very close to mitochondria and, at the ultrastructural level, appear as multi‐lamellar structures evocating autophagy figures (Fig 5A, arrowheads) that sometimes contacted or contained mitochondria (Fig 5A, arrows). In Drosophila, increased transcription of autophagy genes (atg) accompanied the autophagic process in various contexts 36, 37. By quantifying the expression level of atg8b, the fly homolog of the canonical autophagy marker LC3, we revealed an up‐regulation of this gene in R364W like and R94Q like fly brains (Fig 5B). Together with the presence of multi‐lamellar structures, this qPCR result suggested that autophagy is activated in the brains of R364W and R94Q fly models. As autophagy is known to be involved in the degradation of damaged mitochondria, we speculate that increased autophagy in CMT2A‐mimetic flies could represent a cellular response to the accumulation of damaged mitochondria. Because a hallmark of mitochondrial damages is the alterations of oxidative metabolism, we quantified ATP levels in CMT2A fly brains extracts using a luciferase‐based assay and observed decreased ATP levels in both R364W like and R94Q like animals (Fig 5C). Another consequence of altered oxidative metabolism is the accumulation of ROS that can be released from defective mitochondrial respiratory chains. Of note, ROS, which trigger oxidative stress, are also known inducers of autophagy. To test whether ROS accumulate in CMT2A neurons, we stained fly brains with the fluorescent in situ probe DHE. Quantifications revealed higher level of fluorescence in R364W like and R94Q like brains compared to control marfWT (Fig 5D). To test more directly the hypothesis that damaged mitochondria accumulate in CMT2A flies, we quantified the level of mtDNA mutations which accumulate during the life of most animals including flies 38. Having first shown that the CMT2A‐mimetic flies have normal mtDNA level (Fig 5E), we then measured mtDNA mutation load using a random mutation capture assay (RMC). Consistent with our hypothesis, this qRT–PCR analysis revealed that brains from R364W and R94Q fly models accumulate more mutant mtDNA molecules than controls during their development (Fig 5F). Finally, we showed that, in R364W‐mimetic flies, over‐expressing drp1 was sufficient to decrease mtDNA mutation load, atg8b expression, and ROS level, and to increase ATP (Fig 5B–D and F), confirming that excess of fusion is the most probable cause for neuronal dysfunction in the R364W fly model. Based on these observations, it is tempting to speculate that the pro‐fusion activity of R364W like, and the pro‐aggregative activity of R94Q like , leads to the accumulation of mitochondrial damages, reducing ATP and increasing ROS levels. Mitochondrial dysfunction can lead to neurodegeneration. However, as described for CMT2A patients, we did not observed motor neuron loss in our fly models (Fig EV5A and B). Nevertheless, a moderate degeneration was detected in the visual system (Fig EV5C and D), a situation evocating CMT6 disease.
Figure 5. The CMT2A alleles compromise mitochondrial integrity and function.
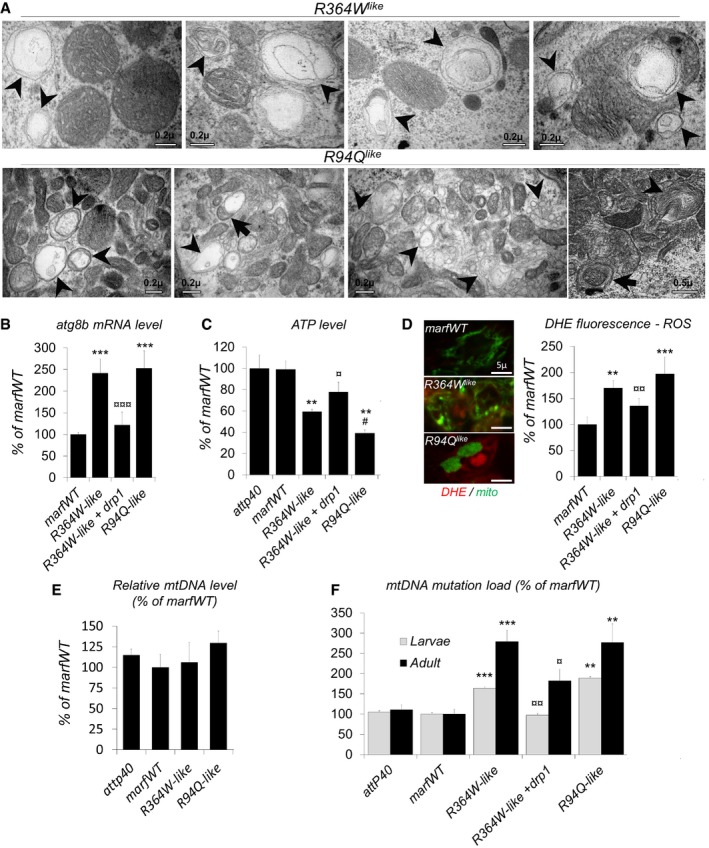
- Transmission electron microscopy images from larval ventral nerve cord expressing R364W like and R94Q like. Arrowheads show multi‐lamellar vesicular structures in the vicinity of mitochondria evocating autophagy figures. These structures sometimes contained mitochondria (arrows). Scale bars 0.2 μm.
- qRT–PCR on third‐instar larvae central nervous system showing atg8b mRNA level ± SEM relative to control (elav>marfWT). Mean value obtained for four independent mRNA extracts each from 12 dissected brains. Mann–Whitney U test results: marfWT versus R364W like or R94Q like ***P < 0.001; R364W like versus R364W like + drp1 ¤¤¤P < 0.001.
- Average ATP level in third‐instar larval brains (% of control level) ± SEM. Three independent experiments performed on extracts from five elav‐GAL4 adult fly brains. Mann–Whitney U test results: marfWT versus R364W like , R94Q like **P < 0.01; R364W like versus R94Q like # P < 0.05, R364W like versus R364W like + drp1 ¤P < 0.05.
- Images show DHE staining in neuron cell bodies from larval ventral nerve cord (scale bars 5 μm). Quantification of ROS labeling intensity ± SEM (ImageJ). Number of cell bodies analyzed marfWT/194, R94Q like/93, R364W like/162, R364W like + drp1/221 (from 10 to 12 larval brains). Mann–Whitney U test results: marfWT versus R364W like , R94Q like: **P < 0.01; ***P < 0.001; R364W like versus R364W like + drp1 ¤¤P < 0.001.
- Relative mtDNA levels measured by quantitative real‐time PCR ± SEM. Normalization is based on the amplification of nuclear rp49 gene. Three independent qRT–PCR experiments each done on DNA extracts from 12 elav‐GAL4 dissected adult fly brains (3‐day‐old flies). No statistically significant difference.
- Relative mitochondrial DNA (mtDNA) mutation load determined by RMC in extracts from elav‐GAL4 UAS‐marf (WT, R94Q like , and R364W like) dissected third‐instar larval CNS and adult brains (3‐day‐old flies). ±SEM. After extraction, DNA is digested by TaqI restriction enzyme and submitted to PCR. Primers flanking a TaqI site are used to amplify only mtDNA fragments in which the TaqI site sequence has been mutated. The amount of mutated DNA is normalized to total mtDNA level (determined by qRT–PCR using primers which do not flank a TaqI site). Eight independent experiments for marfWT, seven for R364W like, three for R364W like + drp1, and three for R94Q like. DNA extracts were prepared from 12 dissected larval CNS or adult brains. Mann–Whitney U test results: marfWT versus R364W like , R94Q like: ***P < 0.001, **< 0.01; R364W like versus R364W like + drp1 ¤¤P < 0.001, ¤ < 0.05.
Figure EV5. The marf CMT2A alleles trigger photoreceptor but not motor neuron degeneration.
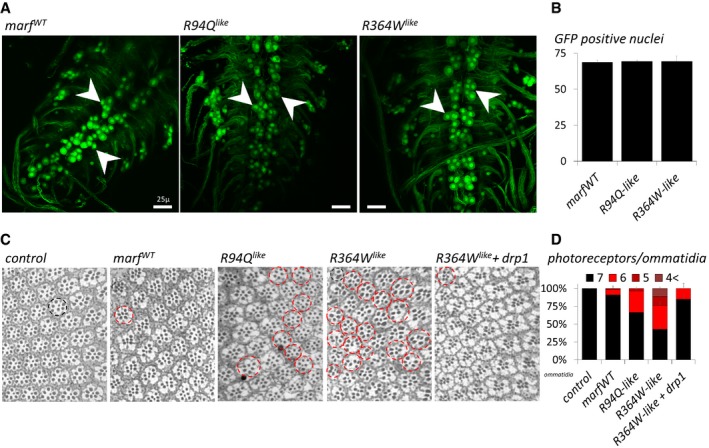
- OK371‐GAL4; UAS‐nls::GFP larval ventral nerve cords (confocal Z‐projections) expressing UAS transgenes carrying the marfWT, R94Q like , or R364W like alleles. NLS::GFP preferentially accumulates in nuclei but additional cytoplasmic staining is also present in cell bodies and neurites. Arrowheads show clusters of middle motor neurons. Scale bars 5 μm.
- Average number of GFP positive nuclei from midline motor neurons showing no difference between genotypes (three ventral nerve cords analyzed per genotypes). ±SD.
- Eye sections from 3‐day‐old flies stained with toluidine blue. In control animals, each ommatidium (black circle) invariably contains seven photoreceptors. Red circles highlight ommatidia showing photoreceptor loss. The UAS‐marf and drp1 transgenes are expressed under the control of elav‐GAL4.
- Percent of ommatidia containing seven, six, five, or at most four photoreceptors for each genotype. Results from three eye sections per genotype. Number of ommatidia analyzed: attp40 (control) (176), marfWT (227), R94Q‐like (311), R364W‐like (312), and R364W‐like + drp1 (183). ± SD.
Mitochondrial depletion at the neuromuscular junctions of R94Q and R364W fly models
We then asked whether the mitochondrial alterations in the neuronal soma could affect the localization of mitochondria at the neuromuscular junctions (NMJs) of the CMT2A flies. Indeed, the inactivation of drp1, which triggers the hyperfusion of mitochondria in neuronal soma, was shown to cause a dramatic depletion of mitochondria at NMJs 22. To visualize mitochondria at NMJs in vivo, we expressed two fluorescent reporter proteins in motor neurons, the one labeling mitochondria in green and the other the plasma membranes in red to allow the visualization of synaptic boutons at the muscle surface (Fig 6). First, we confirmed that, contrary to control NMJs, those of motor neurons in which drp1 was inactivated were largely devoid of mitochondria (Fig 6A and B). We also demonstrated that this phenotype was rescued by marf knockdown (Fig 6A and B) showing that the localization of mitochondria at NMJs depends on a precise balance between mitochondrial fusion and fission. This analysis further revealed that the fraction of boutons devoid of mitochondria is significantly higher at the NMJs of R364W like‐expressing larvae (Fig 6A) and that over‐expressing wild‐type drp1 restored mitochondrial distribution in boutons (Fig 6A and B). Finally, we observed that mitochondrial aggregation in the neuron expressing R94Q like was also associated with synaptic mitochondrial depletion. The degree of mitochondrial depletion was, however, lower than that observed in R364W like animals (Fig 6A and B). These results demonstrate that shifts in the fusion/fission equilibrium interfere with mitochondrial localization at NMJs and, notably, that excess mitochondrial fusion provokes mitochondrial depletion at NMJs in the R364W fly model.
Figure 6. The CMT2A alleles trigger mitochondrial depletion at neuromuscular junctions.
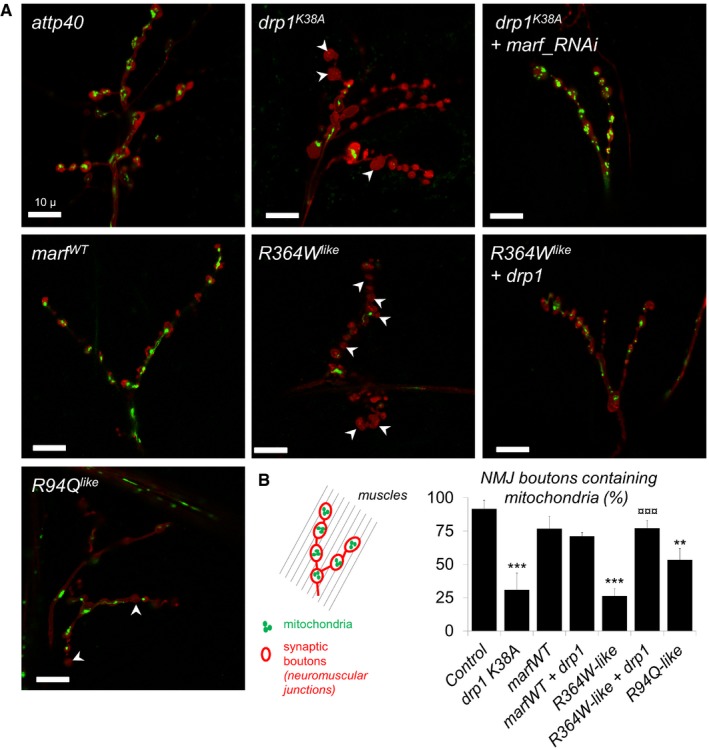
- Confocal images of larval neuromuscular junctions (NMJ) targeted by OK371‐GAL4. Synaptic bouton membrane is stained in red (myr::RFP) and mitochondria in green (mit::dendra2). Arrowheads: boutons without mitochondria. Scale bars 10 μm.
- Proportion of synaptic boutons with mitochondria staining ± SEM. Number of boutons analyzed: attp40/158, drp1 K38A/156, drp1 K38A marf_RNAi/172, marfWT/216, R94Q like/200, R364W like/129, R364W like +drp1/128. Mann–Whitney U test results: ***P < 0.001, **P < 0.01 (versus marfWT), ¤¤¤P < 0.001 (versus R364W like).
Discussion
In this work, we have generated and characterized Drosophila models of CMT2A‐expressing pathogenic alleles in a wild‐type background and at levels similar to that of endogenous MFN, a situation which resembles that of neurons carrying MFN2 dominant heterozygous mutations. Our in vivo analysis of four CMT2A mutations, including the two most frequent alleles (R94Q and R364W), demonstrates that CMT2A mutations can induce aberrant mitochondrial morphology and function, mitochondria depletion at NMJ, and locomotor deficits by either deficient or excessive MFN activity.
Because mutations of the MFN2‐GTPase domain, which are the most prevalent among CMT2A, have lost their ability to drive fusion in MEFs devoid of endogenous MFN (Fig 3 and 31) and are genetically dominant in human patients and mouse models 26, 27, 28, they were proposed to encode dominant negative forms of MFN2 that decrease mitochondrial fusion and thereby induce neuronal dysfunction. However, there was so far no experimental evidence supporting this hypothesis in in vivo neurons. Our study reveals that mutations homologous to R94Q and T105M do not simply result in mitochondrial fragmentation (as observed in marf knockout flies), but rather trigger a massive aggregation of unfused mitochondria in fly neurons. Importantly, in our models, mutant and wild‐type marf transgenes are expressed at similar levels that are near the endogenous marf level and, in this condition, control marfWT transgene does not trigger mitochondrial clustering. Therefore, our data strongly support the idea that mitochondrial aggregation results from specific properties of the mutant alleles and not from unspecific effect of MFN over‐expression as observed in cultured cells (39, 40, discussed in 27, 41). Of note, and consistent with this hypothesis, focal mitochondrial aggregates have been reported in the few available electron microscopy analysis of nerve biopsies from CMT2A patients 3, 42, 43. At the molecular level, we can speculate that R94Q and T105M mutant MFNs retain the capacity to tether mitochondria, but cannot support the subsequent GTP‐dependent steps that normally drive membrane fusion, as suggested by the poor diffusion of the probe in photoconversion experiments. Consequently, the defective MFNs might remain locked together, leading to progressive aggregation of a growing number of mitochondria. We thus propose that R94Q and T105M act as dominant negative MFNs that impair mitochondrial fusion and favor clustering.
Unexpectedly, our characterization of the R364W and L76P alleles reveals for the first time that two alleles known to cause CMT2A, including the highly prevalent R364W substitution, stimulate mitochondrial fusion activity and subsequently exert their toxicity by shifting the fission/fusion balance toward fusion. Indeed, we here show that, in fly neurons, mutations in residues homologous to R364W and L76P result in the formation of large mitochondrial spheres similar to those induced by inactivating drp1 or over‐expressing at high‐level wild‐type marf. Such phenomenon is not a specificity of fly neurons, as enlarged globular mitochondria, strikingly similar to those described here in Drosophila, were also observed in the neuronal cell bodies of drp1 knockout mice 21, 44, 45. Interestingly, the latter studies have also shown that these giant mitochondrial spheres observed in neurons in vivo are absent from cultured drp1 knockout MEFs 44, 45 as showed here in MEFs expressing R364W and L76P. Consistent with the neuronal specificity of CMT2A, the analysis of skin fibroblast derived from CMT2A patients shows minor alterations of mitochondrial morphology and function 46, 47, 48. This implies (i) that the formation of giant mitochondrial spheres may require factors or cellular properties that are specific of neurons, and (ii) that the validation of this pathogenic mechanism in mammals demands functional characterization of the R364W allele in neurons and not in fibroblasts.
The precise mechanism by which MFNs drive outer membrane fusion remaining debated, we can only speculate on the mechanisms by which R364W and L76P mutations might provoke MFN gain of function. As neither residue localizes to the GTP‐binding domain or to any of the predicted coiled‐coil domains (Figs 1A and EV1), it appears uncertain that they play a direct role in GTP‐binding and hydrolysis, GTP‐dependent MFN dimerization 49, 50, and/or inter‐mitochondrial tethering via coiled‐coil domains 51, 52. In the MFN1 structure, the homologs of L76 and R364 (V55 and R343) localize to the helix bundle HB1 (Fig EV1B and C) that is homologous to the neck domain of the bacterial dynamin BDLP (Fig EV1C and D). Of note, a transition between condensed and extended conformations (Fig EV1D and E) has been proposed to underlie the function of BDLP 53 and of the related MFNs 14. In the condensed conformation, these residues (Fig EV1C and D: blue) would be oriented toward the predicted second helix bundle HB2, homologous to the trunk domain of BDLP (Fig EV1C and D: yellow) and in close proximity of an interbundle domain of highly variable structure located between both helix bundles (Fig EV1C and D: green). It is therefore tempting to propose that these residues participate in HB1/HB2 (Neck/Trunk) interactions and somehow contribute to the stability of the condensed conformation and/or to modulating the shifts between the condensed and extended forms (Fig EV1D and E).
Our microscopy data demonstrate that both mitochondrial aggregation and excessive fusion are associated with a depletion of mitochondria at NMJs in our CMT2A fly models. In the R94Q fly model, this phenotype might reflect the fact that “sticky” mitochondria trapped within aggregates observed in neuronal cell bodies are not free to move in thin axonal projection to reach synapses. In the R364W fly model, this is rather the shift of the fusion/fission balance in favor of fusion that is responsible for mitochondrial loss in NMJs. In flies and mammals, a similar depletion of synaptic mitochondria is indeed observed when fission is inhibited (this manuscript and 22, 54). Fission seems therefore required for the efficient transport of mitochondria to synapses possibly because this process maintains mitochondrial size down to a level compatible with mitochondrial movement into neuronal projections or with the interaction of mitochondria with the transport machinery. Mitochondrial depletion at NMJs may impair neurotransmission in CMT2A flies as previously described in flies mutant for DRP1 or for the mitochondrial kinesin adaptor Milton 22, 55. Indeed, in fly, as well as in mammalian neurons, synaptic mitochondria provide the ATP required by the synaptic machinery 22, 56 and tune down calcium waves in axon terminals 57, 58. There is so far no available histological study of nerve biopsies from patients with mutations of the R364 residue. However, if R364W affects mitochondrial distribution at the NMJs in human as it does in flies, it would presumably impact neuronal activity. It is indeed known that mutations affecting proteins involved in mitochondrial axonal transport, such as dyneins DYNC1H1 and DNAH10, and dynactin DCTN2, are sufficient to cause axonal forms of CMT 59, 60.
Additionally, increased mtDNA mutation load correlating with autophagy markers up‐regulation, decreased ATP, and increased ROS were detected in the brain of R94Q and R364W‐mimetic flies. These observations suggest that damaged organelles accumulate in the neurons of these animals and may contribute to neuronal dysfunctions. In the R364W fly model, increasing fission resettled mtDNA mutation load, autophagy markers, ATP, and ROS toward normal level, suggesting that this CMT2A allele compromises the removal of defective mitochondria by switching the fission/fusion balance toward fusion. Accordingly, inhibiting fission was shown to decrease the efficacy of mitophagy, resulting in the accumulation of oxidized mitochondrial proteins and subsequently decreasing oxidative metabolism 21, 61, 62, 63. Indeed, fission is proposed to support the sorting of mitochondria depending on their metabolic activity, the poorly active being isolated and degraded 61. Additional studies in yeast also revealed that the segregation of poorly active mitochondria relies on lower fusion capacity 64. Therefore, by favoring mitochondrial fusion over fission, the R364W allele might compromise the elimination of defective mitochondria by decreasing the efficacy of the mitochondrial sorting process. In R94Q fly model, mitochondrial aggregation might also affect the elimination of damaged mitochondria possibly because mitochondria trapped into dense aggregates are poorly accessible to the vesicular components of the autophagy machinery. Similar pathogenic process might arise in human, as decreased oxidative metabolism was associated with increased level of deleted mtDNA molecules in fibroblasts from CMT2A patients 48. However, aggregation is not the only deleterious consequence of R94Q. Indeed, this mutation impairs inter‐mitochondrial exchanges suggesting that the R94Q allele acts as a dominant negative MFN which inhibits the mitochondrial fusion process. This would presumably compromise the buffering of mitochondrial damaged explaining why R94Q flies experience more severe neurological defects and have lower brain ATP levels than R364W‐mimetic animals, despite higher mitochondrial synaptic density, and similar brain mtDNA mutation load.
In conclusion, we propose that CMT2A does not simply result from decreased MFN activity but rather from more complex alterations of MFN functions. Depending on the alleles, CMT2A mutations result in mitochondrial clustering or unexpectedly enhance mitochondrial fusion subsequently affecting mitochondrial distribution and integrity in neurons. Our data also indicate that anti‐fission or pro‐fusion drugs, envisioned as treatments for CMT2A or neurodegenerative disease 18, 52, 65, could be detrimental for patients with R364W and L76P alleles that would rather benefit from the development of pro‐fission or anti‐fusion molecules.
Materials and Methods
Sequence/structure analysis
Alignments of MFN1/NP_284941, MFN2/NP_001121132, MARF/NP_996358, and BDLP/B2IZD3 were performed with CLUSTALW or MUSCLE (https://npsa-prabi.ibcp.fr or http://www.phylogeny.fr). Coiled‐coil and transmembrane domains were predicted with COILS and TMPred software (http://www.ch.embnet.org) 40. 3D structures of MFN1‐MGD (49; PDB ID 5GNU, 5GNT), MFN1IM (50; PDB ID 5GO4, 5GOE), and BDLP (66; PDB ID 2J68, 2J69, 2W6D) were retrieved from RCSB Protein Bank (http://www.rcsb.org). Structural alignments were performed with TM‐align 67.
Mitochondrial morphology and fusion in mammalian cells
We used mouse embryonic fibroblasts (MEFs) with a wild‐type genotype 16 or devoid of MFN1 and MFN2 (MFN1/MFN2‐null cells 51). For transient expression, MEFs were co‐transfected using Turbofect (Thermo Fisher) with pCB6‐mtGFP 40 and pQCXIB (Addgene plasmid # 22800) plasmids encoding mouse MFN2, Drosophila MARF, human MFN2, or indicated human MFN2 mutants. For quantitative analysis, mitochondrial morphology of 100–150 transfected cells was determined and expressed as percentage transfected cells with fragmented/FRA, filamentous/FIL, or clustered/CLU mitochondria.
For stable transduction of MEFs, viral particles were generated by transfection of Plat‐E retroviral packaging cells (Cell Biolabs, Inc.) with retroviral plasmids encoding GFP targeted to the mitochondrial matrix (pMXs‐puro‐mtGFP), mCherry anchored to the outer membrane by the transmembrane domain of OMP25 (pMXs‐puro‐mChOM 32) or the indicated MFN2 alleles (pQCXIB‐MFN2). MEFs were transduced with viral supernatants diluted in complete culture medium and supplemented with 8 μg/ml polybrene. Transduced cells were selected with 20 μg/ml blasticidin and/or 2 μg/ml puromycin. Expression of fluorescent proteins was confirmed by fluorescence microscopy. Expression of MFN2 alleles was confirmed by Western blot with MFN2‐specific antibodies 40.
Mouse embryonic fibroblasts expressing either mtGFP or mCherryOM were co‐plated on glass coverslips and subjected to cell fusion with P.E.G. as described 32. Fused cells were maintained in cycloheximide containing medium (20 μg/ml) to inhibit protein synthesis and fixed after 4 or 6 h. MEFs were imaged with a 100× objective in an Olympus IX81 microscope. Z‐stacks were deconvoluted using the DeconvolutionLab plugin 68 and combined into a Maximum Intensity Projection with ImageJ or the Extended Focus option of CellR software (Olympus). To quantify the colocalization between mtGFP and mChOM, we calculated the Manders’ coefficients using the JaCOP plugin of ImageJ software 69. Regions of high mitochondrial density (essentially perinuclear regions) were excluded from the analysis to avoid colocalization artifacts due to insufficient spatial resolution.
Drosophila stocks and culture
UAS‐CMT2A lines
marf coding sequence was amplified from w 1118 fly, cloned into pDonr221 vector and checked by sequencing. marf 5′ and 3′ UTRs were not included, and only a kozak CAAA sequence was added in front of ATG. The R404W (R364W like), L118P (L76P like), R135Q (R94Q like), and T146M (T105M like) were made using quick change PCR (Agilent) that cloned (Gateway) into pUAST‐w + ‐attB. Vectors carrying wild‐type or mutant marf were inserted by phiC31‐mediated transgenesis (injection into white flies carrying attP40 insertion site).
UAS‐mit::dendra2
A Gateway cassette was cloned into pUASp‐w + in front of Dendra2 70 coding sequence. This plasmid was used to fuse the mitochondrial target sequence of human COVIII (MSVLTPLLLRGLTGSARRLPVPRAKIHSL) with Dendra2. Independent lines were obtained by P‐Element transgenesis. The 4M line (2nd chromosome) was used here.
marf knockout flies
Homologous recombination was realized by ends‐out targeting. The resulting deletion starts 10‐bp upstream of ATG and up to stop codon. 5′ and 3′ homology regions (around 2.8 kb) were PCR amplified from W 1118 flies and cloned in PTV‐cherry at KpnI and AscI sites (5′HR primers: 5′CATCACCTCGATGACTC and 5′ GGTTTATGGTTGATTCG, 3′HR primers: 5′TAGTGGAACAGTAGTGGG and 5′ATGCGACTGGTGCTTGCA). To validate W + marf knockout animals, the 5′ and 3′ boundary regions between the remaining sequences of the marf locus and the inserted pTV‐cherry construct were sequenced. Heterozygous marf KO adults are fully viable and fertile, but hemizygous male and homozygous female larvae show extended larval stage, growth defect, and third‐instar lethality as described for the marf B mutant alleles in 71.
Other lines
UAS‐drp1 and UAS‐drp1 K38A were from J. Chung, UAS‐marf Strong, UAS‐marf_RNAi, and UAS‐OPA1_RNAi from M. Guo, and elav‐GAL4, OK371‐GAL4, and UAS‐myr::RFP from Bloomington stock center. GAL4/UAS fly crosses were grown at 29°C on cornmeal‐agar diet.
Quantitative real‐time PCR
mRNAs were extracted from 12 dissected third‐instar larval brains, submitted to retrotranscription followed by qRT–PCR [SyBR GreenER Supermix/Life Technologies/PCR program: 7 min at 95°C, 41× (15 s at 95°C, 1 min at 60°C)]. The following primers were used: 5′ TGTCGTTGATCTCACGCTTC/5′GGTAGATGCAGCCGTAGAGG (exonic region) to detect products transcribed from endogenous marf, and from marf UAS transgenes, and 5′GGGGCAAAACACTAACCAGA/5′GTTGCAGCAAATACGTGGT to detect only products of endogenous marf (3′ UTR region that is absent from the marf UAS transgenes). For atg8b, we used 5′GGGAGCCTTCTCGACGAT/5′ TTCATTGCAATCATGAAGTTCC. The amount of mRNA detected was normalized to control rp49 mRNA values (5′GACGCTTCAAGGGACAGTATCTG and 5′AAACGCGGTTCTGCATGA). Normalized data were used to determine the relative marf mRNA levels according to cycling threshold analysis.
In situ labeling
For in situ detection of mit::dendra2 and myr::RFP, living larval central nervous systems were rapidly dissected, mounted into PBS, and immediately imaged. For even‐skipped (Hybridoma Bank, 2B8) immunolabeling, tissues were dissected in PBS, fixed for 5 min in 4% formaldehyde, washed 5 min, and saturated 1 h in 0.5% BSA, 0.1% Triton in PBS (PBTB). Primary anti‐Eve diluted in PBTB was incubated ON at 4°C, and later washed 1 h in 0.1% Tween‐20 in PBS (PBTw). Secondary antibody was incubated 2 h and washed 1 h in PBTw. Preparations were mounted in Vectashield/DAPI (Vector). A LSM780 Zeiss confocal microscope was used for imaging.
Time‐lapse microscopy
OK‐GAL4; UAS‐mit::dendra2 third‐instar larva central nervous systems were rapidly dissected and mounted in PBS. Observations were carried out under a Roper‐Nikon spinning disk confocal microscope equipped with photoconversion module controlled by Metamorph. A 450 nm laser (10% power) was used to photo‐convert mit::dendra2 molecules (120 ms). Confocal images of green (laser excitation 488 nm) and red (laser excitation 545 nm) mit::dendra2 signals were acquired repetitively during a time window of 120 s (duration of each red/green acquisitions 3 s).
Electron microscopy
Larval ventral nerve cords were dissected and immediately fixed in 2% paraformaldehyde, 2.5% glutaraldehyde, 5 mM CaCl2, and 0.1 mM Na cacodylate for 24 h at 4°C. This was followed by 2 h post‐fixation in 2.5% glutaraldehyde, 0.8% osmium tetroxide, and 0.1 mM Na cacodylate at 4°C. Ultrathin Epon plastic sections were examined with a Tecnai G2 TEM.
Locomotor performance
Fly locomotor performance was determined using negative geotaxis test. Ten flies were placed in a clean plastic column (25 cm tall × internal diameter 1.5 cm) and gently tapped to the bottom. After 30 s, the flies at the top of the column (N top) and the flies remaining at the bottom (N bot) were counted. Three trials were performed at 30‐s intervals. The performance index was defined as (1/2*(10 + N top − N bot)/10).
ATP level
ATP measurements were performed according to manufacturer's instructions (Luminescent ATP detection assay kit, Abcam). For each experiment, five adult fly brains were rapidly dissected, and the extracts were immediately deproteinized by perchloric acid precipitation. Luminescent was measured with a TriStar LB941 luminometer.
Superoxide staining
DHE staining was performed as described 72. Third‐instar larval central nervous systems were dissected in PBS and incubated 5 min in 30 μM DHE (in Schneider's medium) at room temperature, washed and fixed 8 min in 4% formaldehyde. DHE (excitation 350 nm, emission 430 nm) is oxidized by superoxide free radicals into ethidium (excitation 530 nm, emission 620 nm). The ethidium signal was detected with a LSM780 confocal microscope (Zeiss). Pixel density was determined using the ImageJ.
mtDNA quantification
Twelve adult fly brains (3‐day‐old flies) were rapidly dissected in PBS and submitted to DNA extraction followed by quantitative real‐time PCR [SyBR GreenER Supermix from lifetechnology/PCR program: 7 min at 95°C, 41× (15 s at 95°C, 1 min at 60°C)]. Specific primers for mitochondrial DNA (COXIII): 5′CGAGATGTATCACGAGAAGG/5′GAATTCCGTGGAATCCTGTTG. The relative levels of mtDNA were normalized to nuclear DNA using primers to rp49 gene: 5′GCTTCAAGATGACCATCCGCCC/5′GGTGCGCTTGTTCGATCCGTAAC. Normalized data were used to determine the relative levels of mtDNA molecules according to cycling threshold analysis.
Random capture mutation assay (RMC)
Twelve third‐instar larvae or 3‐day‐old adult fly brains were rapidly dissected in PBS and immediately submitted to DNA extraction followed by TaqI digestion (8 h, under agitation, at 65°C/750 ng of DNA/150 units of enzyme + 150 units added after 4 h). Quantitative real‐time PCR: LC FastStart DNA Master SYBR Green I kit, Roche/program: 10′ at 95°C, 45× (30″at 95°C, 60″ at 60°C, 15″ at 72°C] + 60″ at 72°C. Primers used to amplify TaqI site‐containing DNA fragment from the CytB gene: 5′CCGATAGGATTATTAGATCCTG/5′CGAACTTTACATGCTAACGGTG. These primers only amplify mtDNA fragments if the TaqI site has been altered by naturally occurring replication errors. The relative levels of mutated mtDNA were normalized to total mtDNA levels using primers to COXIII gene: 5′ CGAGATGTATCACGAGAAGG/5′ GAATTCCGTGGAATCCTGTTG (DNA region devoid of TaqI site). Normalized data were used to determine the relative levels of mutated mtDNA molecules according to cycling threshold analysis.
Author contributions
TR initiated, conceived and supervised the project. NEF and TR performed and analyzed the experiments in Drosophila. AA performed electron microscopy. MR, CD, and EK performed and analyzed the experiments in mammalian cells. GP quantified PEG‐fusion assay. JR provided support. TR and MR wrote the manuscript.
Conflict of interest
The authors declare that they have no conflict of interest.
Supporting information
Appendix
Expanded View Figures PDF
Movies EV1–EV6
Review Process File
Acknowledgements
Imaging performed on PiCSL‐FBI core facility (IBDM, AMU‐Marseille) supported by French National Research Agency through “Investments for the Future” program (France‐BioImaging, ANR‐10‐INBS‐04). We thank N. Brouilly, J.P. Chauvin, and F. Richard for electron microscopy, J.M. Philippe for vectors and cloning strategies, J. Dompierre for image treatment and analysis, A. Dautant for help in protein structures analysis, C. Rubio for DNA cloning and fly culture, E. Campeau for pQCXIB plasmid, D. Chan for MFN1/MFN2 knock‐out MEFs, and L. Kerkerian‐Le Goff and A. Mourier for support and critical reading of the manuscript. Stocks obtained from Bloomington Drosophila Stock Center (NIH P40OD018537) were used in this study. This work was supported by the Association Française contre les Myopathies (AFM‐téléthon): research grant 20097 to T. Rival, PhD fellowship 16853 to N. El Fissi, and grant 17917 to M. Rojo.
EMBO Reports (2018) 19: e45241
References
- 1. Murphy SM, Laura M, Fawcett K, Pandraud A, Liu YT, Davidson GL, Rossor AM, Polke JM, Castleman V, Manji H et al (2012) Charcot‐Marie‐Tooth disease: frequency of genetic subtypes and guidelines for genetic testing. J Neurol Neurosurg Psychiatry 83: 706–710 [DOI] [PMC free article] [PubMed] [Google Scholar]
- 2. Stuppia G, Rizzo F, Riboldi G, Del Bo R, Nizzardo M, Simone C, Comi GP, Bresolin N, Corti S (2015) MFN2‐related neuropathies: clinical features, molecular pathogenesis and therapeutic perspectives. J Neurol Sci 356: 7–18 [DOI] [PubMed] [Google Scholar]
- 3. Verhoeven K, Claeys KG, Zuchner S, Schroder JM, Weis J, Ceuterick C, Jordanova A, Nelis E, De Vriendt E, Van Hul M et al (2006) MFN2 mutation distribution and genotype/phenotype correlation in Charcot‐Marie‐Tooth type 2. Brain 129: 2093–2102 [DOI] [PubMed] [Google Scholar]
- 4. Chung KW, Kim SB, Park KD, Choi KG, Lee JH, Eun HW, Suh JS, Hwang JH, Kim WK, Seo BC et al (2006) Early onset severe and late‐onset mild Charcot‐Marie‐Tooth disease with mitofusin 2 (MFN2) mutations. Brain 129: 2103–2118 [DOI] [PubMed] [Google Scholar]
- 5. Chung KW, Suh BC, Cho SY, Choi SK, Kang SH, Yoo JH, Hwang JY, Choi BO (2010) Early‐onset Charcot‐Marie‐Tooth patients with mitofusin 2 mutations and brain involvement. J Neurol Neurosurg Psychiatry 81: 1203–1206 [DOI] [PubMed] [Google Scholar]
- 6. Polke JM, Laura M, Pareyson D, Taroni F, Milani M, Bergamin G, Gibbons VS, Houlden H, Chamley SC, Blake J et al (2011) Recessive axonal Charcot‐Marie‐Tooth disease due to compound heterozygous mitofusin 2 mutations. Neurology 77: 168–173 [DOI] [PMC free article] [PubMed] [Google Scholar]
- 7. Piscosquito G, Saveri P, Magri S, Ciano C, Di Bella D, Milani M, Taroni F, Pareyson D (2015) Mutational mechanisms in MFN2‐related neuropathy: compound heterozygosity for recessive and semidominant mutations. J Peripher Nerv Syst 20: 380–386 [DOI] [PubMed] [Google Scholar]
- 8. Bertholet AM, Delerue T, Millet AM, Moulis MF, David C, Daloyau M, Arnaune‐Pelloquin L, Davezac N, Mils V, Miquel MC et al (2016) Mitochondrial fusion/fission dynamics in neurodegeneration and neuronal plasticity. Neurobiol Dis 90: 3–19 [DOI] [PubMed] [Google Scholar]
- 9. Chan DC (2012) Fusion and fission: interlinked processes critical for mitochondrial health. Annu Rev Genet 46: 265–287 [DOI] [PubMed] [Google Scholar]
- 10. Westermann B (2010) Mitochondrial fusion and fission in cell life and death. Nat Rev Mol Cell Biol 11: 872–884 [DOI] [PubMed] [Google Scholar]
- 11. Kawalec M, Zablocka B, Kabzinska D, Neska J, Beresewicz M (2014) Mitofusin 2 expression dominates over mitofusin 1 exclusively in mouse dorsal root ganglia ‐ a possible explanation for peripheral nervous system involvement in Charcot‐Marie‐Tooth 2A. Folia Neuropathol 52: 436–442 [DOI] [PubMed] [Google Scholar]
- 12. Chen H, Chomyn A, Chan DC (2005) Disruption of fusion results in mitochondrial heterogeneity and dysfunction. J Biol Chem 280: 26185–26192 [DOI] [PubMed] [Google Scholar]
- 13. Chen H, Detmer SA, Ewald AJ, Griffin EE, Fraser SE, Chan DC (2003) Mitofusins Mfn1 and Mfn2 coordinately regulate mitochondrial fusion and are essential for embryonic development. J Cell Biol 160: 189–200 [DOI] [PMC free article] [PubMed] [Google Scholar]
- 14. Daumke O, Roux A (2017) Mitochondrial homeostasis: how do dimers of mitofusins mediate mitochondrial fusion? Curr Biol 27: R353–R356 [DOI] [PubMed] [Google Scholar]
- 15. Otera H, Ishihara N, Mihara K (2013) New insights into the function and regulation of mitochondrial fission. Biochem Biophys Acta 1833: 1256–1268 [DOI] [PubMed] [Google Scholar]
- 16. Mourier A, Motori E, Brandt T, Lagouge M, Atanassov I, Galinier A, Rappl G, Brodesser S, Hultenby K, Dieterich C et al (2015) Mitofusin 2 is required to maintain mitochondrial coenzyme Q levels. J Cell Biol 208: 429–442 [DOI] [PMC free article] [PubMed] [Google Scholar]
- 17. Knott AB, Bossy‐Wetzel E (2008) Impairing the mitochondrial fission and fusion balance: a new mechanism of neurodegeneration. Ann N Y Acad Sci 1147: 283–292 [DOI] [PMC free article] [PubMed] [Google Scholar]
- 18. Grohm J, Kim SW, Mamrak U, Tobaben S, Cassidy‐Stone A, Nunnari J, Plesnila N, Culmsee C (2012) Inhibition of Drp1 provides neuroprotection in vitro and in vivo . Cell Death Differ 19: 1446–1458 [DOI] [PMC free article] [PubMed] [Google Scholar]
- 19. Burte F, Carelli V, Chinnery PF, Yu‐Wai‐Man P (2015) Disturbed mitochondrial dynamics and neurodegenerative disorders. Nat Rev Neurol 11: 11–24 [DOI] [PubMed] [Google Scholar]
- 20. Gerber S, Charif M, Chevrollier A, Chaumette T, Angebault C, Kane MS, Paris A, Alban J, Quiles M, Delettre C et al (2017) Mutations in DNM1L, as in OPA1, result indominant optic atrophy despite opposite effectson mitochondrial fusion and fission. Brain 140: 2586–2596 [DOI] [PubMed] [Google Scholar]
- 21. Kageyama Y, Zhang Z, Roda R, Fukaya M, Wakabayashi J, Wakabayashi N, Kensler TW, Reddy PH, Iijima M, Sesaki H (2012) Mitochondrial division ensures the survival of postmitotic neurons by suppressing oxidative damage. J Cell Biol 197: 535–551 [DOI] [PMC free article] [PubMed] [Google Scholar]
- 22. Verstreken P, Ly CV, Venken KJ, Koh TW, Zhou Y, Bellen HJ (2005) Synaptic mitochondria are critical for mobilization of reserve pool vesicles at Drosophila neuromuscular junctions. Neuron 47: 365–378 [DOI] [PubMed] [Google Scholar]
- 23. Pham AH, Meng S, Chu QN, Chan DC (2012) Loss of Mfn2 results in progressive, retrograde degeneration of dopaminergic neurons in the nigrostriatal circuit. Hum Mol Genet 21: 4817–4826 [DOI] [PMC free article] [PubMed] [Google Scholar]
- 24. Lee S, Sterky FH, Mourier A, Terzioglu M, Cullheim S, Olson L, Larsson NG (2012) Mitofusin 2 is necessary for striatal axonal projections of midbrain dopamine neurons. Hum Mol Genet 21: 4827–4835 [DOI] [PubMed] [Google Scholar]
- 25. Chen H, McCaffery JM, Chan DC (2007) Mitochondrial fusion protects against neurodegeneration in the cerebellum. Cell 130: 548–562 [DOI] [PubMed] [Google Scholar]
- 26. Detmer SA, Vande Velde C, Cleveland DW, Chan DC (2008) Hindlimb gait defects due to motor axon loss and reduced distal muscles in a transgenic mouse model of Charcot‐Marie‐Tooth type 2A. Hum Mol Genet 17: 367–375 [DOI] [PubMed] [Google Scholar]
- 27. Cartoni R, Arnaud E, Medard JJ, Poirot O, Courvoisier DS, Chrast R, Martinou JC (2010) Expression of mitofusin 2(R94Q) in a transgenic mouse leads to Charcot‐Marie‐Tooth neuropathy type 2A. Brain 133: 1460–1469 [DOI] [PubMed] [Google Scholar]
- 28. Strickland AV, Rebelo AP, Zhang F, Price J, Bolon B, Silva JP, Wen R, Zuchner S (2014) Characterization of the mitofusin 2 R94W mutation in a knock‐in mouse model. J Peripher Nerv Syst 19: 152–164 [DOI] [PubMed] [Google Scholar]
- 29. Zuchner S, De Jonghe P, Jordanova A, Claeys KG, Guergueltcheva V, Cherninkova S, Hamilton SR, Van Stavern G, Krajewski KM, Stajich J et al (2006) Axonal neuropathy with optic atrophy is caused by mutations in mitofusin 2. Ann Neurol 59: 276–281 [DOI] [PubMed] [Google Scholar]
- 30. Feely SM, Laura M, Siskind CE, Sottile S, Davis M, Gibbons VS, Reilly MM, Shy ME (2011) MFN2 mutations cause severe phenotypes in most patients with CMT2A. Neurology 76: 1690–1696 [DOI] [PMC free article] [PubMed] [Google Scholar]
- 31. Detmer SA, Chan DC (2007) Complementation between mouse Mfn1 and Mfn2 protects mitochondrial fusion defects caused by CMT2A disease mutations. J Cell Biol 176: 405–414 [DOI] [PMC free article] [PubMed] [Google Scholar]
- 32. Malka F, Guillery O, Cifuentes‐Diaz C, Guillou E, Belenguer P, Lombes A, Rojo M (2005) Separate fusion of outer and inner mitochondrial membranes. EMBO Rep 6: 853–859 [DOI] [PMC free article] [PubMed] [Google Scholar]
- 33. Yun J, Puri R, Yang H, Lizzio MA, Wu C, Sheng ZH, Guo M (2014) MUL1 acts in parallel to the PINK1/parkin pathway in regulating mitofusin and compensates for loss of PINK1/parkin. Elife 3: e01958 [DOI] [PMC free article] [PubMed] [Google Scholar]
- 34. Smirnova E, Griparic L, Shurland DL, van der Bliek AM (2001) Dynamin‐related protein Drp1 is required for mitochondrial division in mammalian cells. Mol Biol Cell 12: 2245–2256 [DOI] [PMC free article] [PubMed] [Google Scholar]
- 35. Park J, Lee G, Chung J (2009) The PINK1‐Parkin pathway is involved in the regulation of mitochondrial remodeling process. Biochem Biophys Res Comm 378: 518–523 [DOI] [PubMed] [Google Scholar]
- 36. Banreti A, Hudry B, Sass M, Saurin AJ, Graba Y (2014) Hox proteins mediate developmental and environmental control of autophagy. Dev Cell 28: 56–69 [DOI] [PubMed] [Google Scholar]
- 37. Juhasz G, Erdi B, Sass M, Neufeld TP (2007) Atg7‐dependent autophagy promotes neuronal health, stress tolerance, and longevity but is dispensable for metamorphosis in Drosophila . Genes Dev 21: 3061–3066 [DOI] [PMC free article] [PubMed] [Google Scholar]
- 38. Itsara LS, Kennedy SR, Fox EJ, Yu S, Hewitt JJ, Sanchez‐Contreras M, Cardozo‐Pelaez F, Pallanck LJ (2014) Oxidative stress is not a major contributor to somatic mitochondrial DNA mutations. PLoS Genet 10: e1003974 [DOI] [PMC free article] [PubMed] [Google Scholar]
- 39. Eura Y, Ishihara N, Yokota S, Mihara K (2003) Two mitofusin proteins, mammalian homologues of FZO, with distinct functions are both required for mitochondrial fusion. J Biochem 134: 333–344 [DOI] [PubMed] [Google Scholar]
- 40. Rojo M, Legros F, Chateau D, Lombes A (2002) Membrane topology and mitochondrial targeting of mitofusins, ubiquitous mammalian homologs of the transmembrane GTPase Fzo. J Cell Sci 115: 1663–1674 [DOI] [PubMed] [Google Scholar]
- 41. Cartoni R, Martinou JC (2009) Role of mitofusin 2 mutations in the physiopathology of Charcot‐Marie‐Tooth disease type 2A. Exp Neurol 218: 268–273 [DOI] [PubMed] [Google Scholar]
- 42. Vallat JM, Ouvrier RA, Pollard JD, Magdelaine C, Zhu D, Nicholson GA, Grew S, Ryan MM, Funalot B (2008) Histopathological findings in hereditary motor and sensory neuropathy of axonal type with onset in early childhood associated with mitofusin 2 mutations. J Neuropathol Exp Neurol 67: 1097–1102 [DOI] [PubMed] [Google Scholar]
- 43. Lv H, Wang L, Zhang W, Wang Z, Zuo Y, Liu J, Yuan Y (2015) A cohort study of Han Chinese MFN2‐related Charcot‐Marie‐Tooth 2A. J Neurol Sci 358: 153–157 [DOI] [PubMed] [Google Scholar]
- 44. Ishihara N, Nomura M, Jofuku A, Kato H, Suzuki SO, Masuda K, Otera H, Nakanishi Y, Nonaka I, Goto Y et al (2009) Mitochondrial fission factor Drp1 is essential for embryonic development and synapse formation in mice. Nat Cell Biol 11: 958–966 [DOI] [PubMed] [Google Scholar]
- 45. Wakabayashi J, Zhang Z, Wakabayashi N, Tamura Y, Fukaya M, Kensler TW, Iijima M, Sesaki H (2009) The dynamin‐related GTPase Drp1 is required for embryonic and brain development in mice. J Cell Biol 186: 805–816 [DOI] [PMC free article] [PubMed] [Google Scholar]
- 46. Loiseau D, Chevrollier A, Verny C, Guillet V, Gueguen N, Pou de Crescenzo MA, Ferre M, Malinge MC, Guichet A, Nicolas G et al (2007) Mitochondrial coupling defect in Charcot‐Marie‐Tooth type 2A disease. Ann Neurol 61: 315–323 [DOI] [PubMed] [Google Scholar]
- 47. Amiott EA, Lott P, Soto J, Kang PB, McCaffery JM, DiMauro S, Abel ED, Flanigan KM, Lawson VH, Shaw JM (2008) Mitochondrial fusion and function in Charcot‐Marie‐Tooth type 2A patient fibroblasts with mitofusin 2 mutations. Exp Neurol 211: 115–127 [DOI] [PMC free article] [PubMed] [Google Scholar]
- 48. Rouzier C, Bannwarth S, Chaussenot A, Chevrollier A, Verschueren A, Bonello‐Palot N, Fragaki K, Cano A, Pouget J, Pellissier JF et al (2012) The MFN2 gene is responsible for mitochondrial DNA instability and optic atrophy ‘plus’ phenotype. Brain 135: 23–34 [DOI] [PubMed] [Google Scholar]
- 49. Qi Y, Yan L, Yu C, Guo X, Zhou X, Hu X, Huang X, Rao Z, Lou Z, Hu J (2016) Structures of human mitofusin 1 provide insight into mitochondrial tethering. J Cell Biol 215: 621–629 [DOI] [PMC free article] [PubMed] [Google Scholar]
- 50. Cao YL, Meng S, Chen Y, Feng JX, Gu DD, Yu B, Li YJ, Yang JY, Liao S, Chan DC et al (2017) MFN1 structures reveal nucleotide‐triggered dimerization critical for mitochondrial fusion. Nature 542: 372–376 [DOI] [PMC free article] [PubMed] [Google Scholar]
- 51. Koshiba T, Detmer SA, Kaiser JT, Chen H, McCaffery JM, Chan DC (2004) Structural basis of mitochondrial tethering by mitofusin complexes. Science 305: 858–862 [DOI] [PubMed] [Google Scholar]
- 52. Franco A, Kitsis RN, Fleischer JA, Gavathiotis E, Kornfeld OS, Gong G, Biris N, Benz A, Qvit N, Donnelly SK et al (2016) Correcting mitochondrial fusion by manipulating mitofusin conformations. Nature 540: 74–79 [DOI] [PMC free article] [PubMed] [Google Scholar]
- 53. Low HH, Sachse C, Amos LA, Lowe J (2009) Structure of a bacterial dynamin‐like protein lipid tube provides a mechanism for assembly and membrane curving. Cell 139: 1342–1352 [DOI] [PMC free article] [PubMed] [Google Scholar]
- 54. Berthet A, Margolis EB, Zhang J, Hsieh I, Zhang J, Hnasko TS, Ahmad J, Edwards RH, Sesaki H, Huang EJ et al (2014) Loss of mitochondrial fission depletes axonal mitochondria in midbrain dopamine neurons. J Neurosci 34: 14304–14317 [DOI] [PMC free article] [PubMed] [Google Scholar]
- 55. Stowers RS, Megeath LJ, Gorska‐Andrzejak J, Meinertzhagen IA, Schwarz TL (2002) Axonal transport of mitochondria to synapses depends on milton, a novel Drosophila protein. Neuron 36: 1063–1077 [DOI] [PubMed] [Google Scholar]
- 56. Ma H, Cai Q, Lu W, Sheng ZH, Mochida S (2009) KIF5B motor adaptor syntabulin maintains synaptic transmission in sympathetic neurons. J Neurosci 29: 13019–13029 [DOI] [PMC free article] [PubMed] [Google Scholar]
- 57. Guo X, Macleod GT, Wellington A, Hu F, Panchumarthi S, Schoenfield M, Marin L, Charlton MP, Atwood HL, Zinsmaier KE (2005) The GTPase dMiro is required for axonal transport of mitochondria to Drosophila synapses. Neuron 47: 379–393 [DOI] [PubMed] [Google Scholar]
- 58. Sheng ZH, Cai Q (2012) Mitochondrial transport in neurons: impact on synaptic homeostasis and neurodegeneration. Nat Rev Neurosci 13: 77–93 [DOI] [PMC free article] [PubMed] [Google Scholar]
- 59. Braathen GJ, Hoyer H, Busk OL, Tveten K, Skjelbred CF, Russell MB (2016) Variants in the genes DCTN2, DNAH10, LRIG3, and MYO1A are associated with intermediate Charcot‐Marie‐Tooth disease in a Norwegian family. Acta Neurol Scand 134: 67–75 [DOI] [PMC free article] [PubMed] [Google Scholar]
- 60. Eschbach J, Sinniger J, Bouitbir J, Fergani A, Schlagowski AI, Zoll J, Geny B, Rene F, Larmet Y, Marion V et al (2013) Dynein mutations associated with hereditary motor neuropathies impair mitochondrial morphology and function with age. Neurobiol Dis 58: 220–230 [DOI] [PMC free article] [PubMed] [Google Scholar]
- 61. Twig G, Elorza A, Molina AJ, Mohamed H, Wikstrom JD, Walzer G, Stiles L, Haigh SE, Katz S, Las G et al (2008) Fission and selective fusion govern mitochondrial segregation and elimination by autophagy. EMBO J 27: 433–446 [DOI] [PMC free article] [PubMed] [Google Scholar]
- 62. Frank M, Duvezin‐Caubet S, Koob S, Occhipinti A, Jagasia R, Petcherski A, Ruonala MO, Priault M, Salin B, Reichert AS (2012) Mitophagy is triggered by mild oxidative stress in a mitochondrial fission dependent manner. Biochem Biophys Acta 1823: 2297–2310 [DOI] [PubMed] [Google Scholar]
- 63. Lee Y, Lee HY, Hanna RA, Gustafsson AB (2011) Mitochondrial autophagy by Bnip3 involves Drp1‐mediated mitochondrial fission and recruitment of Parkin in cardiac myocytes. Am J Physiol Heart Circ Physiol 301: H1924–H1931 [DOI] [PMC free article] [PubMed] [Google Scholar]
- 64. Sauvanet C, Duvezin‐Caubet S, Salin B, David C, Massoni‐Laporte A, di Rago JP, Rojo M (2012) Mitochondrial DNA mutations provoke dominant inhibition of mitochondrial inner membrane fusion. PLoS One 7: e49639 [DOI] [PMC free article] [PubMed] [Google Scholar]
- 65. Yue W, Chen Z, Liu H, Yan C, Chen M, Feng D, Yan C, Wu H, Du L, Wang Y et al (2014) A small natural molecule promotes mitochondrial fusion through inhibition of the deubiquitinase USP30. Cell Res 24: 482–496 [DOI] [PMC free article] [PubMed] [Google Scholar]
- 66. Low HH, Lowe J (2006) A bacterial dynamin‐like protein. Nature 444: 766–769 [DOI] [PubMed] [Google Scholar]
- 67. Zhang Y, Skolnick J (2005) TM‐align: a protein structure alignment algorithm based on the TM‐score. Nucleic Acids Res 33: 2302–2309 [DOI] [PMC free article] [PubMed] [Google Scholar]
- 68. Sage D, Donati L, Soulez F, Fortun D, Schmit G, Seitz A, Guiet R, Vonesch C, Unser M (2017) DeconvolutionLab2: an open‐source software for deconvolution microscopy. Methods 115: 28–41 [DOI] [PubMed] [Google Scholar]
- 69. Bolte S, Cordelieres FP (2006) A guided tour into subcellular colocalization analysis in light microscopy. J Microsc 224: 213–232 [DOI] [PubMed] [Google Scholar]
- 70. Chudakov DM, Lukyanov S, Lukyanov KA (2007) Tracking intracellular protein movements using photoswitchable fluorescent proteins PS‐CFP2 and Dendra2. Nat Protoc 2: 2024‐2032 [DOI] [PubMed] [Google Scholar]
- 71. Sandoval H, Yao CK, Chen K, Jaiswal M, Donti T, Lin YQ, Bayat V, Xiong B, Zhang K, David G et al (2014) Mitochondrial fusion but not fission regulates larval growth and synaptic development through steroid hormone production. Elife 3: e03558 [DOI] [PMC free article] [PubMed] [Google Scholar]
- 72. Owusu‐Ansah E, Yavari A, Mandal S, Banerjee U (2008) Distinct mitochondrial retrograde signals control the G1‐S cell cycle checkpoint. Nat Genet 40: 356–361 [DOI] [PubMed] [Google Scholar]
Associated Data
This section collects any data citations, data availability statements, or supplementary materials included in this article.
Supplementary Materials
Appendix
Expanded View Figures PDF
Movies EV1–EV6
Review Process File