

Abstract
In fed cells, syntaxin 17 (Stx17) is associated with microtubules at the endoplasmic reticulum–mitochondria interface and promotes mitochondrial fission by determining the localization and function of the mitochondrial fission factor Drp1. Upon starvation, Stx17 dissociates from microtubules and Drp1, and binds to Atg14L, a subunit of the phosphatidylinositol 3‐kinase complex, to facilitate phosphatidylinositol 3‐phosphate production and thereby autophagosome formation, but the mechanism underlying this phenomenon remains unknown. Here we identify MAP1B‐LC1 (microtubule‐associated protein 1B‐light chain 1) as a critical regulator of Stx17 function. Depletion of MAP1B‐LC1 causes Stx17‐dependent autophagosome accumulation even under nutrient‐rich conditions, whereas its overexpression blocks starvation‐induced autophagosome formation. MAP1B‐LC1 links microtubules and Stx17 in fed cells, and starvation causes the dephosphorylation of MAP1B‐LC1 at Thr217, allowing Stx17 to dissociate from MAP1B‐LC1 and bind to Atg14L. Our results reveal the mechanism by which Stx17 changes its binding partners in response to nutrient status.
Keywords: Atg14L, autophagy, MAP1B‐LC1, microtubules, syntaxin 17
Subject Categories: Autophagy & Cell Death; Cell Adhesion, Polarity & Cytoskeleton
Introduction
Macroautophagy (hereafter autophagy) is an intracellular degradation process in which cytosolic components are sequestered within double‐membrane vesicles termed autophagosomes and delivered to lysosomes. This pathway is activated by nutrient deprivation and other stresses 1. The execution of autophagy is mediated by the Atg (autophagy‐related) proteins in cooperation with proteins involved in membrane trafficking 2, 3, 4, 5.
Autophagy is initiated by the formation of an isolation membrane that emerges from a phosphatidylinositol 3‐phosphate (PI3P)‐enriched, omega‐shaped subdomain of the endoplasmic reticulum (ER) 6. The isolation membrane expands thanks to the presence of curved ER cisternae that surround the isolation membrane 7, 8 as well as to membrane supply from other membrane sources 4, 5. The nascent isolation membrane engulfs cytoplasmic constituents and is finally detached from the ER concomitantly with the closure of the membrane to form an autophagosome. Hamasaki et al 9 demonstrated that in the formation of the isolation membrane, syntaxin 17 (Stx17) plays a pivotal role not as a membrane fusion machinery, but as a scaffold: Upon starvation, Stx17 is activated and redistributed to the mitochondria‐associated membrane (MAM), where it recruits the Vps34‐containing class III PI3‐kinase complex through interaction with the Atg14L, a subunit of the kinase complex 10. This finding is in line with the contribution of mitochondria to autophagosome formation 11. In addition to the initiation of autophagy, Stx17 plays a role in a late stage of autophagy; it interacts with SNAP‐29 and VAMP8 and catalyzes the fusion of autophagosomes with endosomes/lysosomes 12, 13, 14, 15, 16.
We have recently shown that Stx17 has a membrane fusion‐unrelated, unique function in fed cells 17. It promotes mitochondrial fission by determining the localization and activity of the mitochondrial fission factor Drp1. Nocodazole treatment can phenocopy the Stx17 depletion effect, implying the requirement of microtubules (MTs) for the interaction between Stx17 and Drp1. Upon starvation, Stx17 is redistributed from raft‐like membrane structures to non‐raft‐like ones and switches its binding from Drp1 to Atg14L 17, which facilitates the formation of functional autophagosomes 9 and allows mitochondria to elongate for escape from autophagic degradation 18, 19.
Although our previous study established that Stx17 binds to different partners in response to nutritional conditions, the molecular mechanism underlying this partner change remains to be elucidated. In the present study, we demonstrate that MT‐associated protein 1B‐light chain 1 (MAP1B‐LC1), a proteolytic product of the polyprotein MAP1B 20, is a critical factor for the regulation of the Stx17 function. MAP1B‐LC1 contains a MT‐binding domain and can thus bind to MTs independently of the heavy chain (HC), the other proteolytic fragment of MAP1B. Although MAP1B‐LC1 forms a complex and acts together with the HC, a number of studies demonstrated that the LC1 functions independently of the HC 21. Our results show that MAP1B‐LC1, independently of the HC, provides a link between Stx17 and MTs and functions as an inhibitor of autophagy by preventing the interaction of Stx17 with Atg14L in fed cells.
Results
MAP1B‐LC1 links Stx17 and MTs
Our previous study demonstrated that MTs are required for the interaction of Stx17 with Drp1 and that the interaction of Stx17 with Drp1 and MTs is abrogated upon starvation 17. To identify protein(s) that mediate the link between Stx17 and MTs, we performed immunoprecipitation using FLAG‐Stx17 and identified a MT‐associated protein, MAP1B‐LC1, by mass spectroscopy (K. Arasaki, N. Dohmae, and M. Tagaya, manuscript in preparation). This interaction was confirmed by immunoprecipitation experiments in 293T cells (Fig 1C and D).
Figure 1. MAP1B‐LC1 mediates the association between Stx17 with MTs and Drp1 at the ER–mitochondria interface.
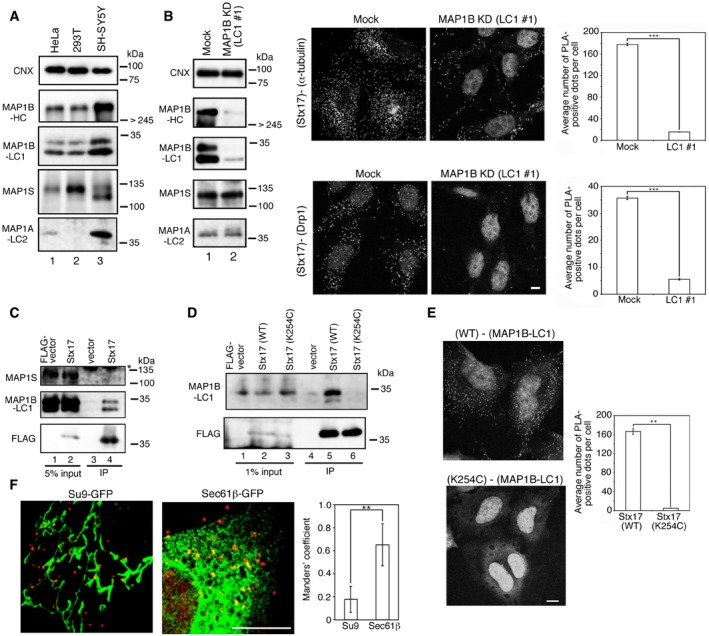
- Cell lysates prepared from each cell line (10 μg protein each) were subjected to SDS–PAGE and analyzed by IB using antibodies against MAP1B (HC and LC1), MAP1A‐LC2, MAP1S, and CNX.
- HeLa cells were mock‐treated (Mock) or treated with siRNA LC1 #1 for 72 h (MAP1B KD), lysed, and analyzed by IB (10 μg protein each). Alternatively, PLA was performed using antibodies against Stx17 and α‐tubulin (upper row) or Drp1 (lower row). Scale bar, 5 μm. Error bars indicate SEM (30 cells/condition, n = 3). ***P ≤ 0.001 (paired Student's t‐test).
- 293T cells were transfected with FLAG vector or FLAG‐Stx17, lysed, immunoprecipitated (IP) with anti‐FLAG M2 beads, and analyzed by IB using antibodies against MAP1S, MAP1B‐LC1, and FLAG (lanes 3 and 4). Five percent of lysates was analyzed as input (lanes 1 and 2). An asterisk indicates a non‐specific band.
- 293T cells were transfected with FLAG‐Stx17 wild type or the K254C mutant and lysed in buffer containing 10 mM NaF and 2 mM sodium vanadate. The lysates were immunoprecipitated (IP) with anti‐FLAG M2 beads and analyzed by IB using antibodies against MAP1B‐LC1 and FLAG (lanes 4–6). One percent of lysates was analyzed as input (lanes 1–3).
- HeLa cells stably expressing FLAG‐Stx17 wild type or the K254C mutant were fixed and subjected to PLA using antibodies against FLAG and MAP1B‐LC1. Scale bars, 5 μm. Error bars indicate SEM (30 cells/condition, n = 3). **P ≤ 0.01 (paired Student's t‐test).
- HeLa cells stably expressing FLAG‐Stx17 wild type were transfected with a plasmid encoding Su9‐GFP (mitochondria) or Sec61β‐GFP (ER). At 24 h after transfection, the cells were subjected to PLA using antibodies against FLAG and MAP1B‐LC1. The bar graph shows the Manders’ coefficients for the colocalization between PLA dots and Su9‐GFP or Sec61β‐GFP. Error bars indicate SD (10 cells/condition, n = 3). **P ≤ 0.01 (paired Student's t‐test). Scale bar, 5 μm.
Source data are available online for this figure.
While previous studies reported that MAP1B is highly expressed in neurons 21, immunoblotting (IB) showed that LC1 as well as HC is expressed in non‐neuronal cells, including HeLa cells (Fig 1A). Consistent with the finding that MAP1B‐LC1 is a proteolytic fragment of the polyprotein MAP1B 20, incubation of HeLa cells with siRNA LC #1, which targets a sequence within the cDNA region encoding MAP1B‐LC1, decreased the expression of MAP1B‐HC as well as MAP1B‐LC1 (Fig 1B, lane 2). Proximity ligation assay (PLA) demonstrated that depletion of MAP1B abrogated the binding of Stx17 to α‐tubulin as well as Drp1 (Fig 1B). Of note is that MAP1S, a ubiquitously expressed MAP species implicated in autophagy 22, 23, 24, was not found in the immunoprecipitates with FLAG‐Stx17 (Fig 1C), and that the expression of MAP1S was not affected by siRNA LC1 #1 (Fig 1B, lane 2), excluding the possibility that MAP1S is critically involved in the connection between Stx17 and MTs.
We noticed that MAP1B‐LC1 was almost always detected as two bands (Fig 1A and B), although their relative intensities varied from occasion to occasion. When cells were incubated with fetal calf serum‐containing medium after transfection, followed by disruption in the presence of the protein phosphatase inhibitors (10 mM NaF and 2 mM sodium vanadate), essentially only the upper band was detected in the cell lysates, and it was coprecipitated with FLAG‐Stx17 (Fig 1D, lane 5), raising the possibility that MAP1B‐LC1 is a phosphoprotein and that the phosphorylated form binds to Stx17. Stx17 is unique among SNARE proteins in that it has a long hairpin‐like C‐terminal hydrophobic domain (CHD) with the C‐terminus facing the cytoplasm 12, 25. Lys254 in the middle of the CHD is critical for the localization of Stx17 at the ER–mitochondria interface as well as the binding to Drp1 17. Immunoprecipitation demonstrated that Lys254 is required for the interaction with MAP1B‐LC1 (Fig 1D, lane 6). The requirement of Lys254 of Stx17 for MAP1B‐LC1 binding was confirmed by means of PLA (Fig 1E). Moreover, PLA analysis combined with fluorescent protein‐tagged organelle markers revealed that Stx17 interacts with MAP1B‐LC1 primarily on the ER, and perhaps at the edge of cleaved mitochondria (Fig 1F), similar to the case of the interaction of Stx17 with Drp1 17. These results together suggest that Stx17 is associated with MAP1B‐LC1 at the ER–mitochondria interface in a manner dependent on Lys254.
MAP1B depletion results in PI3P production, thereby inducing autophagosome accumulation under nutrient‐rich conditions
Given that Stx17 participates in autophagy 9, 12, 13, 14, 15, 16 and dissociates from MTs upon starvation 17, we explored the possible involvement of MAP1B‐LC1 in autophagy. MAP1B depletion with siRNA LC1 #1 caused robust accumulation of autophagosomes, as visualized by LC3 staining, even in the presence of nutrients (Fig 2A, lower row). A similar, but less pronounced accumulation of LC3‐positive puncta was observed (Fig EV1B) when MAP1B‐LC1 expression was reduced by siRNA HC #1 (Fig EV1A), which targets a sequence within the cDNA region encoding MAP1B‐HC. In line with these immunofluorescence observations, immunoelectron microscopy demonstrated the accumulation of autophagosomes in MAP1B‐depleted cells (Fig 2B). MAP1B depletion‐induced autophagosome accumulation was abrogated upon Stx17 depletion by siRNA Stx17 (440) (Fig 2C). This siRNA was used in a previous study and shown to specifically knockdown Stx17 17. This double knockdown experiment suggests that MAP1B depletion‐induced autophagosome accumulation is dependent on Stx17, as seen in normal starvation 9, 17, 26.
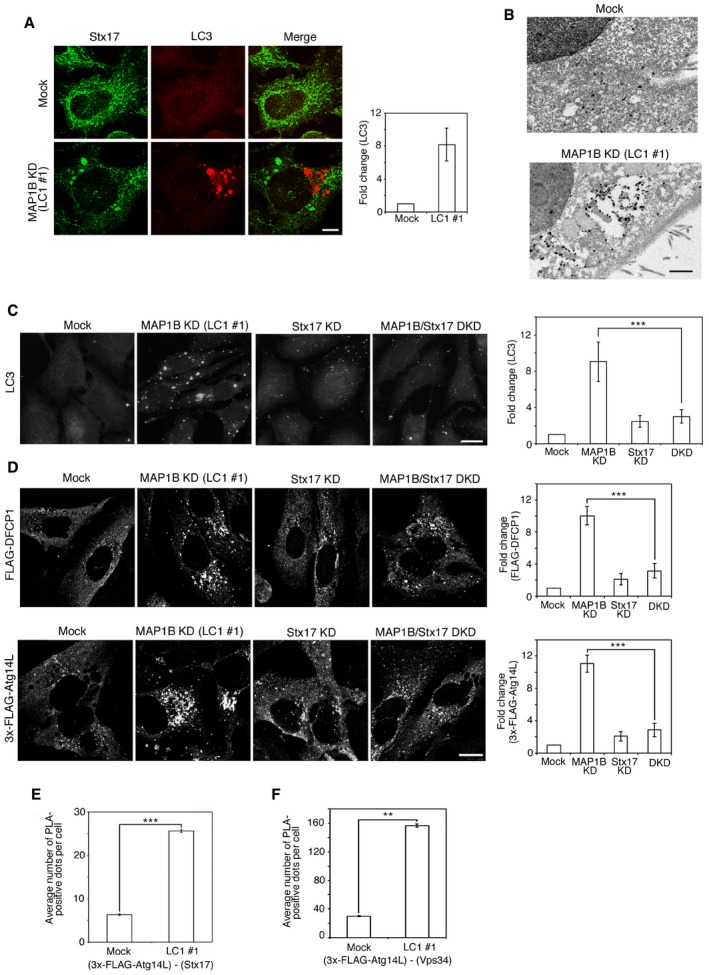
Figure 2. Knockdown of MAP1B‐LC1 induces autophagosome accumulation even under nutrient‐rich conditions.
-
AHeLa cells were mock‐treated (Mock) or treated with siRNA LC1 #1 for 72 h (MAP1B KD) and double‐immunostained for Stx17 and LC3. Scale bar, 5 μm. Data in the bar graph are expressed as a fold change compared with mock‐treated cells. Error bars indicate SD (30 cells/condition, n = 3).
-
BHeLa cells were treated as described in (A) and subjected to immunoelectron microscopic analysis using an antibody against LC3. Scale bar, 1 μm.
-
C, DHeLa cells or ones transiently expressing FLAG‐DFCP1 or 3x‐FLAG‐Atg14L were mock‐treated (Mock) or treated with siRNA LC1 #1 (MAP1B KD), siRNA for Stx17 (Stx17 KD), or both (MAP1B/Stx17 DKD) for 72 h and immunostained for LC3 (C) or FLAG (D). Scale bar, 10 μm. Data in the bar graphs are expressed as a fold change compared with mock‐treated cells. Error bars indicate SD (30 cells/condition (C) and 40 cells/condition (D), n = 3). ***P ≤ 0.001 (paired Student's t‐test).
-
E, FHeLa cells were mock‐transfected or transfected with siRNA LC1 #1. At 48 h after siRNA transfection, the cells were transfected with a plasmid encoding 3x‐FLAG‐Atg14L and incubated for 24 h. The cells were subjected to PLA using antibodies against FLAG and Stx17 (E) or Vps34 (F). Error bars indicate SEM (30 cells/condition, n = 3). **P ≤ 0.01, ***P ≤ 0.001 (paired Student's t‐test).
Source data are available online for this figure.
Figure EV1. Knockdown of MAP1B with siRNA HC #1.
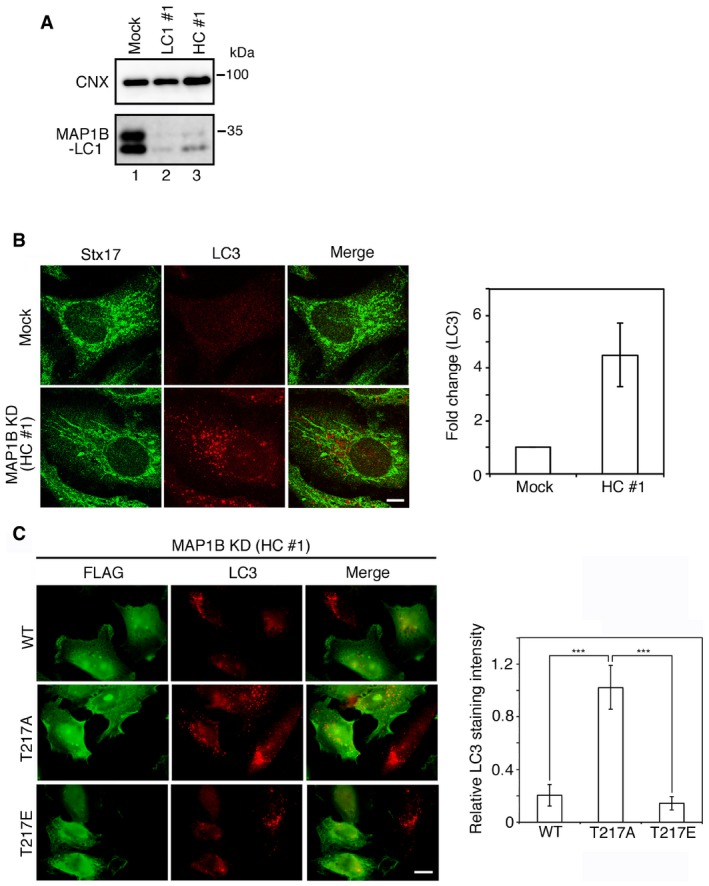
- HeLa cells were mock‐transfected or transfected with siRNA LC1 #1 or HC #1. At 72 h after transfection, cell lysates (5 μg proteins each) were subjected to IB using antibodies against CNX and MAP1B‐LC1.
- HeLa cells were mock‐treated (Mock) or treated with siRNA HC #1 for 72 h (MAP1B KD) and subjected to double‐immunostaining using the indicated antibodies. Scale bar, 5 μm. Data in the bar graph are expressed as a fold change compared with mock‐treated cells. Error bars indicate SD (30 cells/condition, n = 3).
- HeLa cells were transfected with a plasmid encoding the FLAG‐MAP1B‐LC1 wild type, the T217A mutant, or the T217E mutant. After 24 h, the cells were transfected with siRNA HC #1, incubated for 72 h and double‐immunostained using antibodies against FLAG and LC3. Of note is that siRNA HC #1 does not target the MAP1B‐LC1 coding region. Scale bar, 10 μm. The bar graph shows the ratio of the LC3 staining intensity of FLAG‐expressing to that of non‐expressing cells. Error bars indicate SD (20 cells/condition, n = 3). ***P ≤ 0.001 (paired Student's t‐test).
Source data are available online for this figure.
We next examined the distribution of DFCP1 (a PI3P‐binding protein) and Atg14L (a subunit of the PI3‐kinase complex), which have been reported to be recruited to the omegasome 6 and MAM 9, respectively, at an early stage of starvation‐induced autophagy. Similar to the case of starvation, MAP1B depletion induced the redistribution of FLAG‐DFCP1 (Fig 2D, upper row) and 3x‐FLAG‐Atg14L (lower row) to punctate structures. Similar redistribution to punctate structures was observed for another PI3P‐binding protein WIPI2 27 and PI3‐kinase Vps34 (Fig EV2A). In line with the translocation of 3x‐FLAG‐Atg14L and Vps34 to punctate structures, 3x‐FLAG‐Atg14L was found to be in proximity to Stx17 (Fig 2E) and Vps34 (Fig 2F) in MAP1B‐depleted cells. These results suggest that MAP1B depletion induces the formation of the PI3‐kinase complex on the ER and thereby produces PI3P.
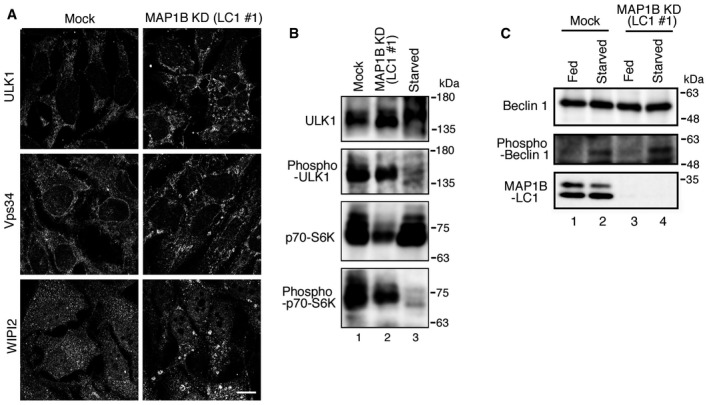
Figure EV2. ULK1 is not activated upon MAP1B depletion.
-
AHeLa cells were mock‐transfected (Mock) or transfected with siRNA LC1 #1 (MAP1B KD). At 72 h after transfection, the cells were immunostained for ULK1, Vps34, and WIPI2. Scale bar, 10 μm.
-
B, CHeLa cells were mock‐transfected (Mock) or transfected with siRNA LC1 #1 (MAP1B KD). At 72 h after transfection, the cells were starved (Starved) or not starved (Fed) for 2 h, lysed, and subjected to IB using the indicated antibodies.
Starvation activates not only the PI3‐kinase complex but also the ULK1 complex 28. Upon starvation, mTORC1 is inactivated, and ULK1 undergoes global dephosphorylation and activation 29, 30 and translocates to punctate structures 28. Although ULK1 was also found to translocate to punctate structures in MAP1B‐depleted cells (Fig EV2A, top row), it was not dephosphorylated (Fig EV2B, lane 2) or activated, as demonstrated by the lack of phosphorylation of Beclin 1 (Fig EV2C, lane 3), a substrate for ULK1 31.
These results taken together suggest that MAP1B depletion causes autophagosome accumulation by facilitating the redistribution of the PI3‐kinase complex to the MAM in a Stx17‐dependent manner without activation of ULK1 kinase.
Starvation induces the consumption of MAP1B‐LC1‐induced autophagosomes
To examine whether autophagosomes formed in the absence of MAP1B in fed cells are competent for fusion with lysosomes, MAP1B‐depleted cells were subjected to starvation. Upon starvation, the accumulated LC3‐positive autophagosomes were substantially reduced (Fig 3A, middle row, right). Before starvation, more p62 (also called SQSTM1) accumulated in MAP1B‐depleted cells than mock‐treated cells (Fig 3B, lane 6 vs. lane 1), suggesting that basal autophagic flux may be blocked upon MAP1B depletion. However, starvation caused a substantial decrease in the amount of p62 in MAP1B‐depleted cells, as well as mock‐treated cells, in a time‐dependent manner (Fig 3B), and this decrease was blocked by bafilomycin A1 (Baf), a reagent that blocks autophagic flux 32. These results suggest that autophagosomes formed in the absence of MAP1B are fusion competent and consumable.
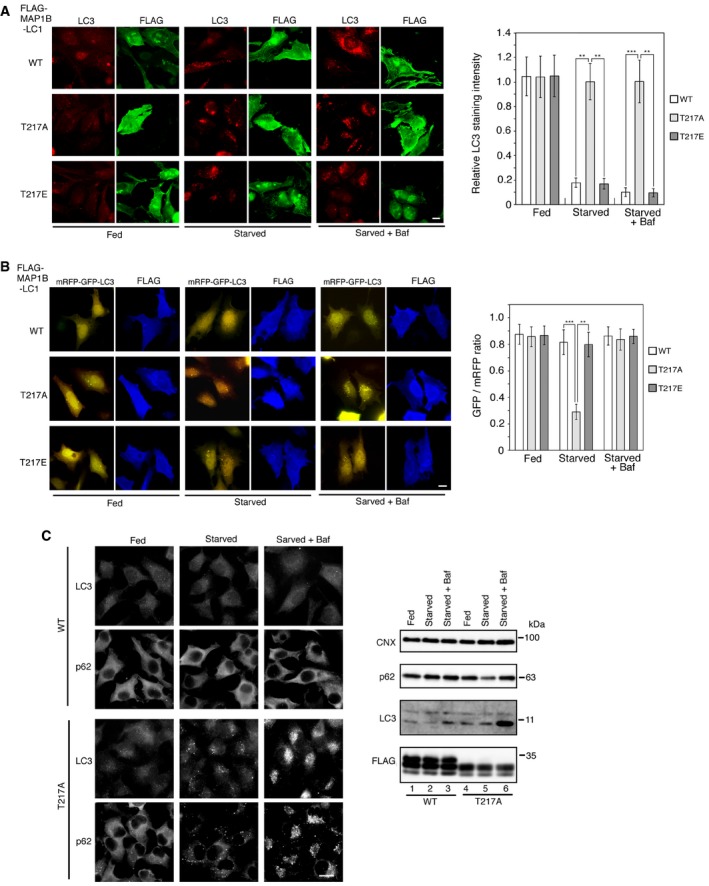
Figure 3. Autophagic flux during starvation is not severely blocked by MAP1B depletion.
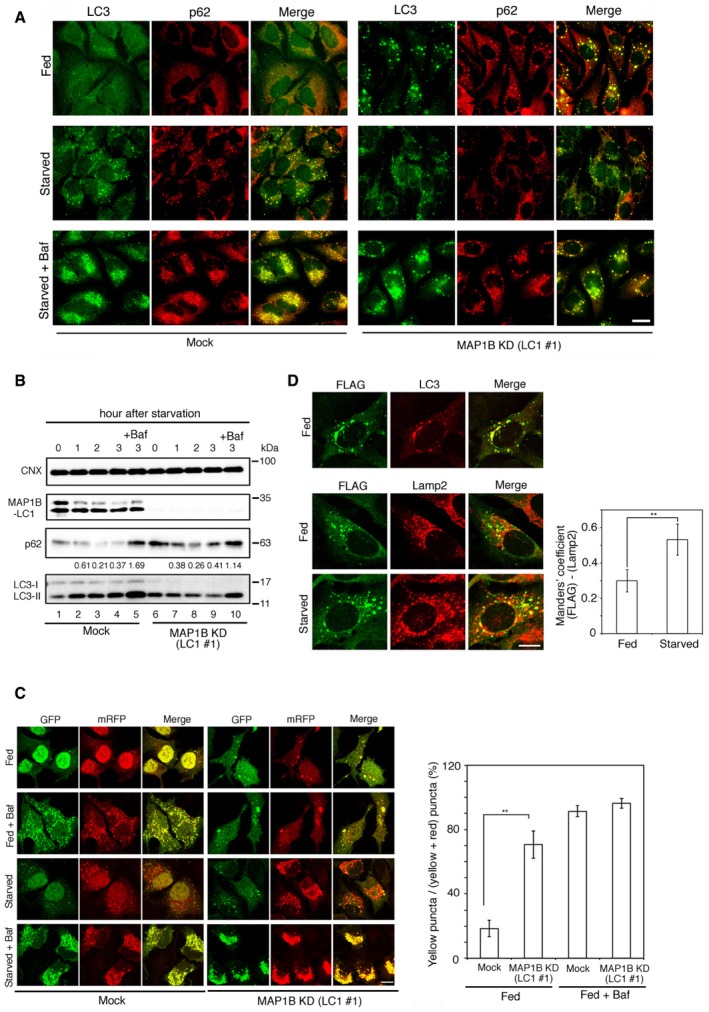
- HeLa cells were mock‐treated (Mock) or treated with siRNA LC1 #1 (MAP1B KD) for 72 h and then without starvation treatment (Fed) or with starvation for 2 h in the absence (Starved) or presence (Starved + Baf) of 0.1 μM Baf. The cells were double‐immunostained using antibodies against LC3 and p62. Scale bar, 10 μm.
- HeLa cells were mock‐treated (Mock) or treated with siRNA LC1 #1 (MAP1B KD) for 72 h and then starved for the indicated times in the absence or presence of 0.1 μM Baf. Cell lysates (10 μg protein each) were analyzed by IB using the indicated antibodies. Values below the p62 strip represent the mean of the p62 intensity (n = 3) normalized to that before starvation.
- HeLa cells were mock‐transfected (Mock) or transfected with siRNA LC1 #1 (MAP1B KD). At 48 h after transfection, the cells were transfected with a plasmid encoding mRFP‐GFP‐LC3. At 24 h after the second transfection, the cells were not subjected to starvation treatment (Fed) or starved for 2 h (Starved) in the absence or presence of 0.1 μM Baf. Scale bar, 10 μm. The bar graph shows the quantification of the merged (both GFP and mRFP) images shown in the left upper two rows. Only, the cytoplasmic puncta were analyzed, and the nuclear staining was ignored. Error bars indicate SD (30 cells/condition, n = 3). **P ≤ 0.01 (paired Student's t‐test).
- HeLa cells stably expressing FLAG‐Stx17 wild type were transfected with siRNA LC1 #1. At 72 h after transfection, the cells were without starvation treatment (Fed) or with starvation for 1 h (Starved) and double‐immunostained with the indicated antibodies. Scale bar, 10 μm. The bar graph shows the Manders’ coefficients for the colocalization between FLAG‐Stx17 and Lamp2. Error bars indicate SD (30 cells/condition, n = 3). **P ≤ 0.01 (paired Student's t‐test).
Source data are available online for this figure.
To further analyze autophagic flux, we used an mRFP‐GFP‐LC3 tandem reporter of which GFP fluorescence is rapidly quenched upon arrival in acidic lysosomes, whereas mRFP fluorescence remains 33. As expected, in mock‐treated cells, starvation caused accumulation of red puncta representing the presence of mRFP‐GFP‐LC3 in autolysosomes (Fig 3C, third row, left), whereas yellow puncta were conspicuously observed in the presence of Baf (bottom row, left). In MAP1B‐depleted cells, yellow puncta were observed under fed conditions (Fig 3C, top row and bar graph), suggesting the blockage of basal autophagy in MAP1B‐depleted cells, and most of them decreased in size upon starvation, accompanied by an accumulation of red puncta (third row, right). This change in color was blocked by Baf (bottom row, right), similar to that observed in mock‐treated cells (bottom row, left). Next, we examined the colocalization of FLAG‐Stx17‐positive autophagosomes with lysosomes. In fed cells depleted of MAP1B, FLAG‐Stx17 was found to be colocalized well with LC3‐positive autophagosomes (Fig 3D, top row), but not with the lysosome marker Lamp2 (middle row). Obviously, starvation promoted the colocalization of FLAG‐Stx17 with Lamp2 (bottom row), consistent with the observation that mRFP‐GFP‐LC3 in MAP1B‐depleted cells became red (i.e., its transport to lysosomes) upon starvation (Fig 3C, third row, right).
Starvation induces the release of Stx17 from MAP1B‐LC1
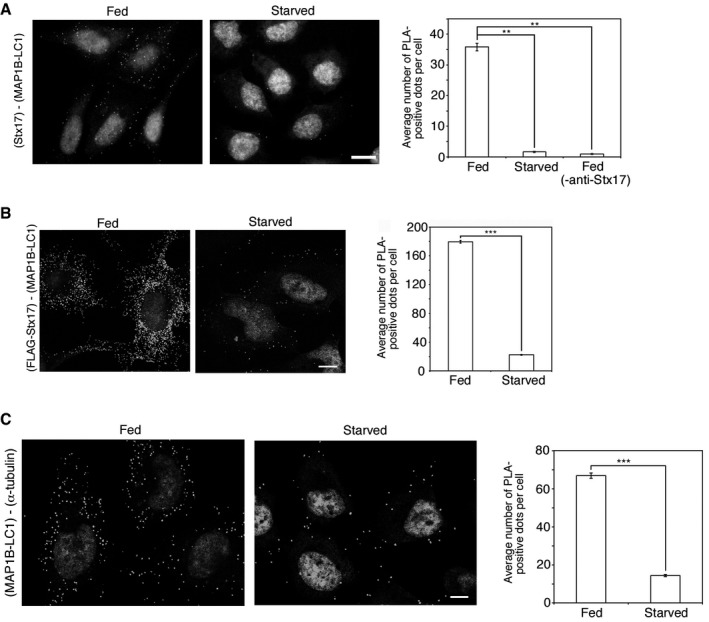
A key question is whether the loss of binding between Stx17 and MAP1B‐LC1 occurs under physiological conditions. We therefore examined whether MAP1B‐LC1 is released from Stx17 upon starvation. PLA showed that the proximity between Stx17 and MAP1B‐LC1 was drastically reduced upon starvation (Fig 4A). A similar reduction in PLA signal was observed between FLAG‐Stx17 and MAP1B‐LC1 (Fig 4B). The proximity between MAP1B‐LC1 and α‐tubulin was also reduced (Fig 4C). These results imply that starvation induces the disassembly of a Stx17‐MAP1B‐LC1‐MT complex.
Figure 4. Starvation induces the release of MAP1B‐LC1 from Stx17 and α‐tubulin.
-
A–CHeLa cells (A and C) or ones stably expressing FLAG‐Stx17 (B) were fixed without treatment (Fed) or after starvation for 2 h (Starved) and subjected to PLA using antibodies against MAP1B‐LC1 alone (‐anti‐Stx17) or MAP1B‐LC1 and Stx17 (A), MAP1B‐LC1 and FLAG (B) or MAP1B‐LC1 and α‐tubulin (C). Scale bars, 5 μm. Error bars indicate SEM (30 cells/condition, n = 3). **P ≤ 0.01, ***P ≤ 0.001 (paired Student's t‐test).
Source data are available online for this figure.
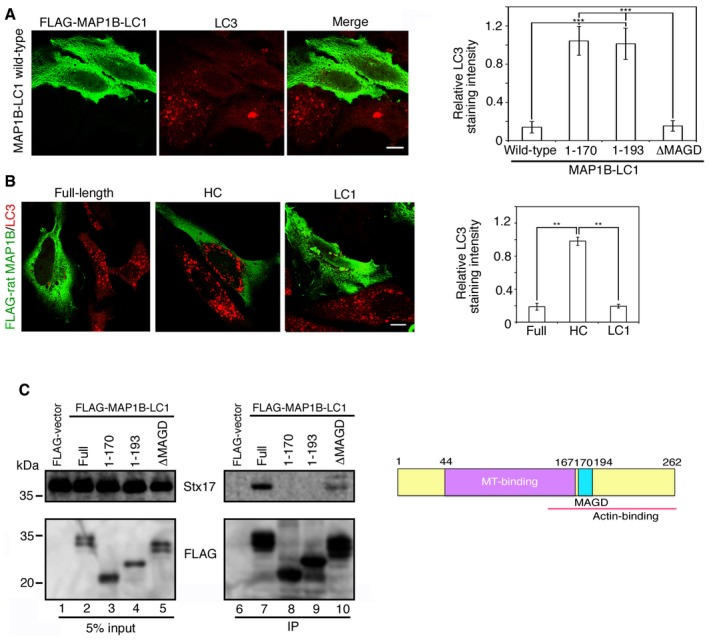
MAB1B‐LC1 overexpression prevents Stx17 from participating in autophagy
If the Stx17‐MAP1B‐LC1 complex dissociation under starvation is due to a decreased affinity of MAP1B‐LC for Stx17, MAP1B‐LC1 overexpression might inhibit starvation‐induced autophagosome formation. As expected, MAP1B‐LC1 overexpression prevented the formation of LC3‐positive structures (Fig 5A). Overexpression of full‐length MAP1B, which is supposed to generate HC and LC1 by proteolytic cleavage, was found to have a similar effect, whereas no suppressive effect was observed when HC was overexpressed (Fig 5B), suggesting that MAP1B‐LC1, not HC, is responsible for this effect. To monitor the autophagic flux in cells expressing full‐length MAP1B, LC1, and HC, we overexpressed them and examined the formation of LC3 puncta and the color of mRFP‐GFP‐LC3. No substantial accumulation of LC3 puncta was seen in cells overexpressing MAP1B full length or MAP1B‐LC1 in starved cells even in the presence of Baf (Fig EV3A, top and bottom rows). In contrast, cells expressing MAP1B‐HC displayed LC3 accumulation upon starvation (Fig EV3A, middle row), and the accumulated mRFP‐GFP‐LC3 puncta became red upon starvation, but remained yellow when Baf was added (Fig EV3B, middle row), as seen in mock‐treated cells (Fig 3C).
Figure 5. Overexpression of MAP1B‐LC1 prevents autophagosome formation induced by starvation.
-
A, BHeLa cells were transfected with one of the FLAG‐tagged MAP1B constructs. At 24 h after transfection, the cells were starved for 2 h and double‐immunostained for FLAG (Alexa Fluor® 488) and LC3 (Alexa Fluor® 594). In (A), only the image of cells expressing MAP1B‐LC1 wild type is shown. Scale bar, 5 μm. The bar graph shows the ratio of the LC3 staining intensity of FLAG‐expressing to that of non‐expressing cells. Error bars indicate SD (20 cells/condition, n = 3). **P ≤ 0.01, ***P ≤ 0.001 (paired Student's t‐test).
-
CSchematic representation of MAP1B‐LC1 (right). Immunoprecipitation data (left). 293T cells were treated as described above except for no starvation treatment, lysed, immunoprecipitated (IP) with anti‐FLAG M2 beads, and analyzed by IB using antibodies against Stx17 and FLAG. Five percent of lysates was analyzed as input.
Source data are available online for this figure.
Figure EV3. Overexpression of MAP1B‐LC1 full‐length and LC1, but not HC, blocks autophagic flux.
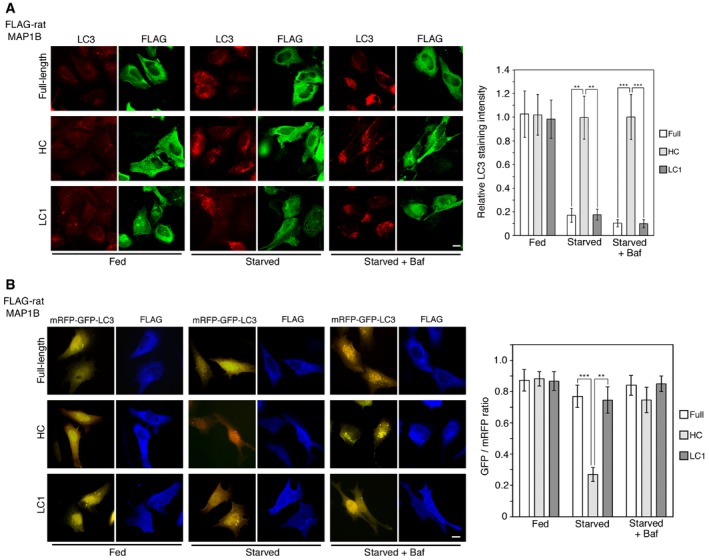
- HeLa cells were transfected with one of the FLAG‐tagged rat MAP1B constructs. At 24 h, the cells were not subjected to starvation treatment (Fed) or starved for 2 h (Starved) in the absence or presence of 0.1 μM Baf and double‐immunostained for FLAG and LC3. Scale bar, 10 μm. The bar graph shows the ratio of the LC3 staining intensity of FLAG‐expressing to that of non‐expressing cells. Error bars indicate SD (20 cells/condition, n = 3). **P ≤ 0.01, ***P ≤ 0.001 (paired Student's t‐test).
- HeLa cells were co‐transfected with one of the FLAG‐tagged rat MAP1B constructs and mRFP‐GFP‐LC3. At 24 h, the cells were not subjected to starvation treatment (Fed) or starved for 2 h (Starved) in the absence or presence of 0.1 μM Baf. Images were captured by a BX53 microscope with a DP53 CCD camera. Scale bar, 10 μm. The bar graph shows the fluorescence intensity of GFP relative to that of mRFP in FLAG‐expressing cells. Because mRFP‐GFP‐LC3 was overexpressed, some fluorescence (yellow) puncta were observed even when full‐length rat MAP1B or LC1 was overexpressed. Error bars indicate SD (20 cells/condition, n = 3). **P ≤ 0.01, ***P ≤ 0.001 (paired Student's t‐test).
Source data are available online for this figure.
To corroborate that overexpressed MAP1B‐LC1 prevents autophagy by binding to Stx17, we examined the correlation between the MAP1B‐LC1 binding to Stx17 and the prevention of autophagy. MAP1B‐LC1 (262 amino acids) contains a MT‐binding domain (amino acids 44–167), an actin‐binding domain (amino acids 143–262), and a MAGD (mitochondrial aggregation and genome destruction) domain (amino acids 170–194) 21. Binding experiments showed that removal of the C‐terminal 69 amino acids of MAP1B‐LC1 (amino acids 1–193) abolished its binding to Stx17 (Fig 5C, lane 9), whereas a mutant with deletion of the MAGD domain (ΔMAGD) retained the binding ability (lane 10). In parallel with this, overexpression of the N‐terminal 193‐amino acid fragment did not suppress the starvation‐induced autophagosome formation, whereas the ΔMAGD overexpression significantly suppressed autophagosome formation (Fig 5A, bar graph), emphasizing a correlation between the ability of MAP1B‐LC1 to bind to Stx17 and its autophagy suppressive effect.
Phosphorylation of Thr217 on MAP1B‐LC1 is responsible for the binding to Stx17
Although the ΔMAGD mutant gave two bands (Fig 5C, lane 5), the N‐terminal 193‐amino acid fragment gave only one band (lane 4). Treatment of FLAG‐MAP1B‐LC1 with bovine intestinal alkaline phosphatase (BIAP) resulted in a marked decrease in the amount of the upper band concomitantly with an increase in the lower band (Fig EV4A, lane 2), suggesting that MAP1B‐LC1 is a phosphoprotein. The abundance of the upper band was decreased upon starvation (Fig EV4B, lane 2) and recovered upon refeeding (lane 3), suggesting the reversibility of this modification. To determine the phosphorylation site of MAP1B‐LC1, we made a series of truncation mutants and found that one mutant (amino acids 1–218) gave two bands (Fig EV4C, lane 5), whereas another mutant (amino acids 1–193), as described, gave one band (lane 9). A further mutant (amino acids 1–207) migrated as two very close bands (lane 7). We therefore assumed that the major phosphorylation site that could be responsible for the blockage of autophagosome formation is present between amino acids 208–217.
Figure EV4. Identification of Thr217 as the phosphorylation site of MAP1B‐LC1.
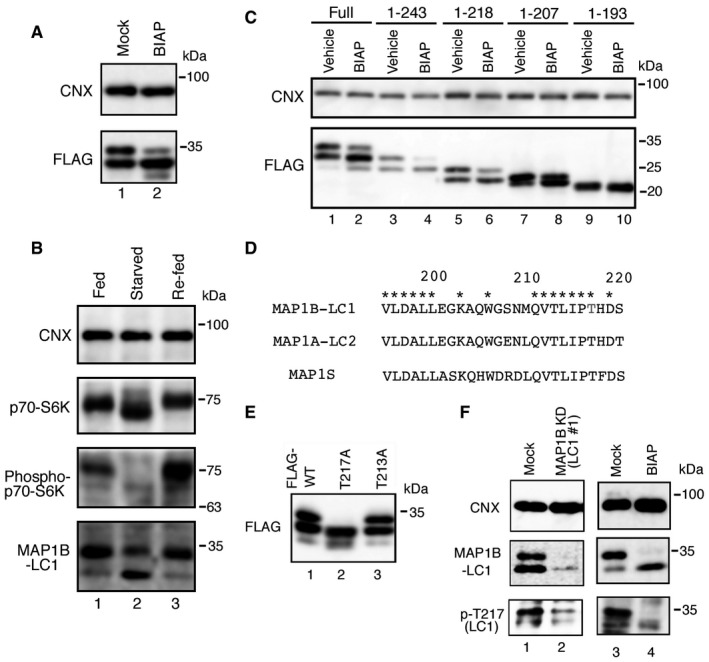
- Lysates (10 μg protein each) from HeLa cells expressing FLAG‐MAP1B‐LC1 were mock‐treated (Mock) or treated with 3 μg/ml BIAP for 1 h (BIAP), and analyzed by IB using antibodies against CNX and FLAG.
- HeLa cells without starvation (Fed), with starvation for 2 h (Starved), or with starvation for 2 h followed by refeeding for 1 h (Re‐fed) were lysed and analyzed by IB using the indicated antibodies.
- HeLa cells were transfected with one of the FLAG‐tagged MAP1B‐LC1 constructs. At 24 h after transfection, cell lysates were prepared, mock‐treated (Vehicle) or treated with BIAP (BIAP) and subjected to IB using antibodies against CNX and FLAG.
- The sequences of MAP1B‐LC1, MAP1A‐LC2, and MAP1S are aligned. Asterisks indicate the amino acids conserved in the three homologues. Amino acids 195–220 of MAP1B‐LC1, including the phosphorylation site (Thr217), are compared.
- HeLa cells were transfected with a plasmid encoding the FLAG‐MAP1B‐LC1 wild type, the T217A mutant, or the T213A mutant, and analyzed by IB using an antibody against FLAG.
- HeLa cells were mock‐treated (Mock) or treated with siRNA LC1 #1 for 72 h (MAP1B KD), or mock‐treated (Mock) or treated with 3 μg/ml BIAP for 1 h (BIAP) and analyzed by IB using antibodies against phospho‐Thr217, MAP1B‐LC1, and CNX.
Since Ser208 is not conserved in other light chain species (MAP1A‐LC2 and MAP1S; Fig EV4D), we focused on Thr213 and Thr217. When Thr217 was replaced by Ala, the resultant mutant migrated as one band, which corresponded to the lower band of the wild‐type MAP1B‐LC1, with additional proteolytic fragments, whereas the replacement of Thr213 by Ala gave two bands, as in the case of the wild‐type protein (Fig EV4E), suggesting that Thr217 is the site of phosphorylation. The phosphorylation of MAP1B‐LC1 on Thr217 was confirmed by an anti‐phospho‐Thr217 antibody. The antibody recognized the upper band, but not the lower band (Fig EV4F, lane 1), and the band reactive to the anti‐phospho‐Thr217 antibody disappeared upon MAP1B knockdown (lane 2) or BIAP treatment (lane 4), emphasizing the specificity of the antibody.
Using this antibody, we were able to show that starvation induced dephosphorylation of Thr217, whereas the effect of Torin1, an mTORC1 inhibitor, on the phosphorylation state of Thr217 was relatively weak (Fig 6A). Consistent with the latter finding, the proximity between FLAG‐Stx17 and MAP1B‐LC1 was moderately disrupted by Torin1 (Fig 6B). We assessed the role of Thr217 phosphorylation using a non‐phosphorylatable mutant (T217A). In contrast to wild‐type MAP1B‐LC1, the T217A mutant neither bound to Stx17 (Fig 6C, lane 4, and D) nor prevented starvation‐induced autophagosome formation (Fig 6E, lower row) or flux (Fig EV5A and B, middle row), nor was it able to reverse MAP1B depletion‐induced autophagosome accumulation (Fig EV1C, middle row). Of note, in FLAG‐tagged, the T217A mutant‐expressing cells, p62 as well as LC3, displayed a punctate staining pattern upon starvation, whereas the diffuse p62 staining pattern was not changed in cells expressing wild‐type MAP1B‐LC1 (Fig EV5C). On the other hand, a phospho‐mimicking mutant (T217E) showed the same effects on autophagy as wild‐type MAP1B‐LC1 (Fig EV5A and B, bottom row) and was able to reverse MAP1B depletion‐induced autophagosome accumulation (Fig EV1C, bottom row). These results suggest that Thr217 is the phosphorylation site responsible for regulating the binding of MAP1B‐LC1 to Stx17.
Figure 6. The interaction between MAP1B‐LC1 with Stx17 is regulated by the phosphorylation–dephosphorylation of MAP1B‐LC1.
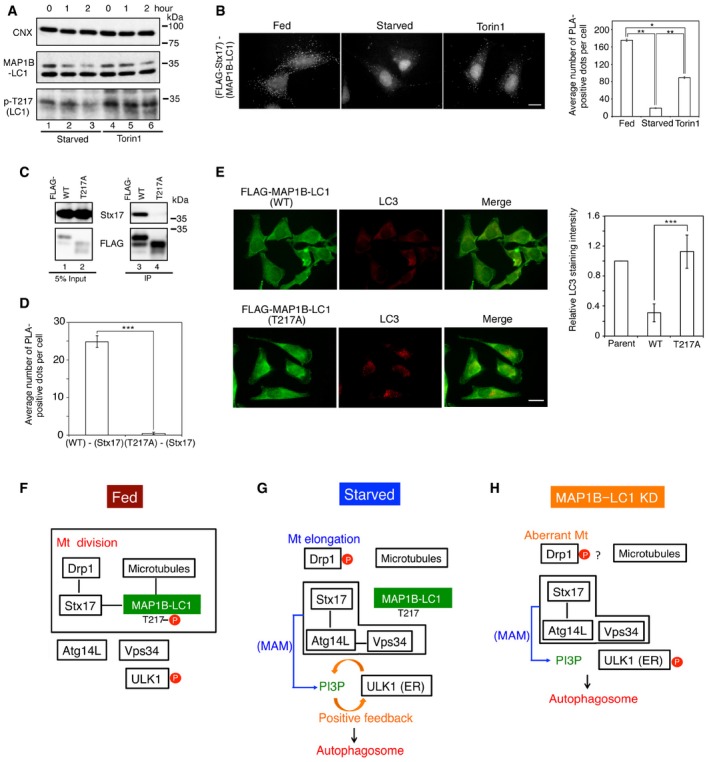
- HeLa cells were starved or incubated with 1 μM Torin1 for the indicated times, and cell lysates were analyzed by IB using antibodies against phospho‐Thr217, MAP1B‐LC1, and CNX.
- HeLa cells stably expressing FLAG‐Stx17 wild type were not starved (Fed), starved for 2 h (Starved), or incubated with 1 μM Torin1 for 2 h (Torin1), and PLA was performed using antibodies against FLAG and MAP1B‐LC1. Scale bar, 10 μm. Error bars indicate SEM (30 cells/condition, n = 3). *P ≤ 0.05, **P ≤ 0.01 (paired Student's t‐test).
- 293T cells were transfected with a plasmid encoding the FLAG‐MAP1B‐LC1 wild type or the T217A mutant, lysed, immunoprecipitated with anti‐FLAG M2 beads, and analyzed by IB using antibodies against Stx17 and FLAG. Five percent of lysates was analyzed as input.
- HeLa cells were co‐transfected with plasmids encoding GFP and FLAG‐MAP1B‐LC1 wild type or the T217A mutant, and subjected to PLA using antibodies against FLAG and Stx17. PLA‐positive dots in GFP‐expressing cells were counted. Error bars indicate SEM (30 cells/condition, n = 3). ***P ≤ 0.001 (paired Student's t‐test).
- HeLa cells stably expressing FLAG‐MAP1B‐LC1 wild type or the T217A mutant were starved for 2 h and double‐immunostained using antibodies against FLAG and LC3. As a control, the parent HeLa cells were used. The bar graph shows the ratio of the LC3 staining intensity of FLAG‐expressing to that of parental cells. Scale bar, 10 μm. Error bars indicate SD (40 cells/condition, n = 3). ***P ≤ 0.001 (paired Student's t‐test).
- In fed cells, Stx17 binds to MTs through Thr217‐phosphorylated MAP1B‐LC1 and facilitates mitochondrial (Mt) division by preventing Drp1 from protein kinase A‐mediated phosphorylation/inactivation.
- Upon starvation, Thr217 on MAP1B‐LC1 is dephosphorylated by unknown phosphatase(s), and Stx17 dissociates from MTs and Drp1 and interacts with Atg14L, leading to the recruitment of Vps34 (PI3‐kinase) to the MAM and thereby inducing PI3P formation. The Vps34 complex in cooperation with the activated ULK1 complex facilitates autophagosome formation.
- In MAP1B‐LC1‐depleted cells, autophagosome formation occurs without marked dephosphorylation of ULK1. ULK1 may translocate to the ER due to the production of PI3P at the MAM and/or its interaction with Atg14L and perhaps other proteins. Phosphorylated ULK1 remains inactive but may function as a scaffold to support the assembly of the autophagy machinery on the ER.
Source data are available online for this figure.
Figure EV5. Overexpression of wild‐type MAP1B‐LC1 and the T217E mutant, but not the T217A mutant, blocks autophagic flux.
- HeLa cells were transfected with one of the FLAG‐tagged MAP1B‐LC1 constructs. At 24 h, the cells were not subjected to starvation treatment (Fed) or starved for 2 h (Starved) in the absence or presence of 0.1 μM Baf and double‐immunostained for FLAG and LC3. Scale bar, 10 μm. The bar graph shows the ratio of the LC3 staining intensity of FLAG‐expressing to that of non‐expressing cells. Error bars indicate SD (20 cells/condition, n = 3). **P ≤ 0.01, ***P ≤ 0.001 (paired Student's t‐test).
- HeLa cells were co‐transfected with one of the FLAG‐tagged MAP1B‐LC1 constructs and mRFP‐GFP‐LC3. At 24 h, the cells were not subjected to starvation treatment (Fed) or starved for 2 h (Starved) in the absence or presence of 0.1 μM Baf. Images were captured by a BX53 microscope with a DP53 CCD camera. Scale bar, 10 μm. The bar graph shows the fluorescence intensity of GFP relative to that of mRFP in FLAG‐expressing cells. Because mRFP‐GFP‐LC3 was overexpressed, some fluorescence (yellow) puncta were observed even when wild‐type MAP1B‐LC1 or the T217E mutant was overexpressed. Error bars indicate SD (20 cells/condition, n = 3). **P ≤ 0.01, ***P ≤ 0.001 (paired Student's t‐test).
- HeLa cells stably expressing FLAG‐MAP1B‐LC1 wild type (Top and second rows) or the T217A mutant (third and bottom rows) were not subjected to starvation treatment (Fed) or starved for 2 h (Starved) in the absence or presence of 0.1 μM Baf and immunostained for LC3 (top and third rows) or p62 (second and bottom rows). Scale bar, 10 μm. Alternatively, cell lysates (10 μg protein each) were analyzed by IB using the indicated antibodies.
Source data are available online for this figure.
Discussion
Stx17 has been suggested to play dual (membrane fusion‐unrelated and membrane fusion‐related) functions in autophagy. In the early stage of autophagy, Stx17 promotes autophagosome formation as a scaffold by recruiting the PI3‐kinase complex through interaction with the PI3‐kinase subunit Atg14L 9, whereas in the late stage it mediates the fusion between autophagosomes and endosomes/lysosomes 12, 13, 14, 15, 16. We recently discovered that in fed cells Stx17 promotes mitochondrial division by interacting with MTs and the mitochondrial fission factor Drp1 17. A key question remained to be answered is how the binding partner of Stx17 is switched from Drp1 to Atg14L in response to the nutrient conditions.
The present data suggest a model in which in fed cells MAP1B‐LC1 links Stx17 with Drp1 and MTs and prevents Stx17 from interacting with Atg14L (Fig 6F). Knockdown of MAP1B‐LC1 causes Stx17 to dissociate from MTs and interact with Atg14L (Fig 6H). This Stx17‐Atg14L association allows the translocation of Vps34 to the MAM and prompts PI3P formation. PI3P formed at the MAM would recruit not only PI3P‐binding proteins such as WIPI2 and DFCP1, but also the ULK1 complex to the ER even it remains phosphorylated and inactive, leading to the formation of autophagosomes. The translocation of the phosphorylated ULK1 complex to the ER is not surprising because PI3P is known to stabilize the translocation of the ULK1 complex to the ER 28: Treatment of cells with wortmannin, a PI3‐kinase inhibitor, blocks the translocation of ULK1 to punctate structure during starvation. Recent studies reported that the ULK1 complex interacts with Atg14L 34, even under fed conditions 35, raising the possibility that ULK1 activation is not prerequisite for translocation to the ER. We envisage that ULK1, even remained phosphorylated, can translocate to the ER when PI3P is abundantly produced at the MAM. We do not exclude the possibility that the inactive ULK1 complex bound to the ER contributes to autophagosome formation because silencing of ULK1 blocks autophagosome formation 36. The ER‐bound ULK1 complex may function as a scaffold to support the assembly of the autophagy machinery on the ER.
MAP1B depletion caused the accumulation of autophagosomes in fed cells. This is probably not solely due to the inhibition of autophagosome fusion with lysosomes in basal autophagy because inhibition of autophagosome fusion with lysosomes by Baf under fed conditions leads to the accumulation of autophagosomes, but does not produce WIPI2‐positive puncta 37, which represent the formation of PI3P at the omegasome and is normally seen in starvation‐induced autophagy 27, 28. Therefore, the formation of DFCP1 and WIPI2 puncta induced by MAP1B depletion may represent enhanced autophagosome formation as a consequence of the interaction of Stx17 with Atg14L, although other explanations may also be possible.
The interaction between MAP1B‐LC1 and Stx17 is regulated by phosphorylation–dephosphorylation (Fig 6F and G). In fed cells, Thr217 on MAP1B‐LC1 is phosphorylated, and starvation induces its dephosphorylation, allowing Stx17 to dissociate from MAP1B‐LC1 and interact with Atg14L for the progression of autophagy. In contrast to starvation treatment, Torin1 treatment marginally affected the phosphorylation state of Thr217 and moderately disrupted the proximity between Stx17 and MAP1B‐LC1 (Fig 6A and B). These observations are consistent with the finding that starvation causes autophagy more rapidly than Torin1 treatment (mTORC1 inhibition) by activating protein phosphatase 2A 30.
The MAP1B function determines mitochondrial localization in cells. In mammalian neurons, MAP1B is involved in the axonal transport of mitochondria 38, as well as axonal elongation, neuronal migration, and axonal guidance 21. In Drosophila, the MAP1B homologue Futsch 39 also regulates the axonal transport of mitochondria 40, 41 by establishing a grid‐like MT organization in cooperation with Ank2‐XL 42. The close relationship between MAP1B and mitochondria was also demonstrated by the finding that the mitochondrial ubiquitin ligase Mitol (also called March5) suppresses excess MT stabilization and prevents neuronal cell death by degrading S‐nitrosylated MAP1B‐LC1 43, whose accumulation causes axon retraction 44. Although previous studies showed that MAP1B (and therefore its proteolytic product MAP1B‐LC1 20) is highly expressed in neurons 21, our data show that it is more ubiquitously expressed than appreciated (Fig 1A).
Proteomic analysis of the autophagy interactions revealed that MAP1B is associated with several Atg proteins such as LC3, Atg3, Atg10, Atg12, and other autophagy‐related proteins such as AMBRA 45. Moreover, the Hippo pathway kinases, STK3/STK4, responsible for the phosphorylation of LC3 46 are also MAP1B‐binding proteins 45, 47, 48. These data in conjunction with our present observations may suggest that MTs sequester the autophagy machinery to prevent autophagy under nutrient‐rich conditions. Beclin 1, a subunit of the PI3‐kinase complex, is also sequestered by MTs through the apoptotic protein Bim in fed cells 49.
In conclusion, our study disclosed that MAP1B‐LC1 mediates the link between Stx17 and MTs in fed cells, and that Stx17 is released from MAP1B‐LC1 and binds to Atg14L in response to the nutrient deprivation. Future work should reveal what specific protein kinase(s) and phosphatase(s) are involved in the phosphorylation and dephosphorylation of MAP1B‐LC1 at Thr217.
Materials and Methods
Animals
All animal procedures and experiments were approved by the Animal Care Committee of Tokyo University of Pharmacy and Life Sciences and conducted according to the guidelines of the committee.
Chemicals and antibodies
Chemicals were obtained from the following sources: Baf (Calbiochem) and Torin1 (Tocris bioscience). The following antibodies were obtained from Sigma‐Aldrich: α‐tubulin (No. T6074: 1/200 for immunofluorescence (IF) and PLA, 1/1,000 for IB), monoclonal FLAG (No. F3165: 1/300 for IF and PLA), and polyclonal FLAG (No. F7425: 1/3,000 for IB). The following antibodies were obtained from BD Bioscience Pharmingen: Calnexin (CNX) (No. 610523: 1/40 for IF, 1/1,000 for IB), Drp1 (No. 611112: 1/40 for IF and PLA), and Tom20 (No. 612278: 1/200 for IF, 1/500 for IB). The following antibodies were obtained from Santa Cruz Biotechnology: polyclonal MAP1B‐LC1 (No. sc‐25729: 1/50 for IF and PLA, 1/500 for IB), monoclonal MAP1B‐LC1 (No. sc‐136472: 1/50 for IF and PLA) and ULK1 (No. sc‐33182: 1/50 for IF, 1/500 for IB). The following antibodies were purchased from MBL: monoclonal LC3 (No. M152‐3: 1/150 for IF), polyclonal LC3 (No. PM036: 1/1,000 for IB), p62 (No. PM045: 1/3,000 for IB), and Beclin 1 (No. PD017: 1/1,000 for IB). The following antibodies were obtained from Cell Signaling: phospho‐ULK1 (No. 14202S: 1/250 for IB), p70‐S6 kinase (No. 2708: 1/500 for IB), phospho‐p70‐S6 kinase (No. 9234: 1/250 for IB), and phospho‐Beclin 1 (Ser15; No. 84966: 1/200 for IB). The following antibodies were obtained from Proteintech: MAP1B‐HC (No. 21633‐1‐AP: 1/1,000 for IB), MAP1S (No. 15695‐1‐AP: 1/1,000 for IB), and Vps34 (No. 12452‐1‐AP: 1/50 for IF and PLA). Antibodies against Lamp2, MAP1A‐LC2, and WIPI2 were obtained from Abcam (No. ab25631: 1/100 for IF), LifeSpan (No. LS‐C314472: 1/1,000 for IB), and (GeneTex No. GTX122101: 1/50 for IF), respectively. Alexa Fluor® 488 and 594 goat anti‐mouse and anti‐rabbit antibodies (No. A‐11001, A‐11005, A‐11008, and A‐11012: 1/200 for IF) were obtained from Invitrogen. The preparation of a polyclonal antibody against Stx17 was described previously 17. An antibody against phospho‐Thr217 was made against a peptide, LIP(pThr)HDSEVMREWYC, and affinity‐purified by GenScript (New Jersey, USA: 1/200 for IB).
Plasmids
Preparation of FLAG‐tagged Stx17 constructs was described previously 17. FLAG‐MAP1B‐LC1 constructs (full length, 1–170, 1–193, and ΔMAGD) were prepared as described 44. Other mutants of MAP1B‐LC1 (1–243, 1–218, 1–207, T217A, and T217E) were generated by inverse PCR. Plasmids for 3x‐FLAG‐ and GFP‐Atg14L were kindly donated by Dr. Noboru Mizushima (University of Tokyo). A plasmid for Su9‐GFP was kindly supplied by Dr. Naotada Ishihara (Kurume University). The cDNAs encoding rat MAP1B full‐length, MAP1B‐HC, and MAP1B‐LC1 were kindly donated by Dr. Friedrich Propst (University of Vienna). mRFP‐GFP‐LC3 was purchased from Addgene.
Cell culture
293T and SH‐SY5Y cells were grown in DMEM supplemented with 50 IU/ml penicillin, 50 μg/ml streptomycin, and 10% fetal calf serum. MDA‐MB‐231 cells were grown in 50% DMEM and 50% RPMI 1640 supplemented with the same materials. HeLa cells (RIKEN, RCB0007) were cultured in α‐MEM supplemented with the same materials plus 2 mM l‐glutamine. Establishment and growth of HeLa cells stably expressing FLAG‐Stx17 wild type or FLAG‐Stx17 (K254C) were described previously 17. For starvation of cells, the cells were rinsed with PBS twice and then incubated in Earle's balanced salt solution (EBSS).
To establish stable transfectants, HeLa cells were transfected with pcDNA3.1/Hygro (+)‐FLAG‐MAP1B‐LC1 wild type or the T217A mutant and cultured in the presence of 250 μg/ml hygromycin B (Wako chemicals).
Transfection
Transfection was carried out using LipofectAMINE 2000 (Invitrogen).
RNA interference
The following siRNAs were used:
MAP1B‐LC1 #1: 5′‐GAAUGUUGAUGUGGAAUUUTT‐3′
MAP1B‐HC #1: 5′‐GGACACAAACCUGAUUGAAUG‐3′
Stx17 (440): 5′‐GGUAGUUCUCAGAGUUUGAUU‐3′
Atg14L: 5′‐UUUGCGUUCAGUUUCCUCACUGCGC‐3′
siRNA Stx17 (440) was used in a previous study and shown to specifically knockdown Stx17 17. siRNAs were purchased from Japan Bio Services (Asaka, Japan). HeLa cells were grown on 35‐mm or 10‐cm dishes, and siRNAs were transfected at a final concentration of 200 nM using Oligofectamine (Invitrogen) according to the manufacturer's protocol.
Immunoprecipitation
Unless otherwise stated, 293T cells expressing FLAG‐tagged proteins were lysed in lysis buffer (20 mM HEPES‐KOH (pH 7.2), 150 mM KCl, 2 mM EDTA, 1 mM dithiothreitol, 1 μg/ml leupeptin, 1 μM pepstatin A, 2 μg/ml aprotinin, and 1 mM phenylmethylsulfonyl fluoride) containing 1% Triton X‐100. After centrifugation, the supernatants were immunoprecipitated with anti‐FLAG M2 affinity beads (Sigma‐Aldrich). The bound proteins were eluted with SDS sample buffer and then analyzed by IB. For the identification of Stx17‐binding proteins, HeLa cells stably expressing FLAG‐Stx17 17 were lysed and immunoprecipitated as described above. The proteins bound to the beads were eluted with a FLAG peptide and subjected to SDS–PAGE followed by mass spectroscopy.
Immunofluorescence microscopy
For immunofluorescence microscopy and colocalization analysis, cells were fixed for 20 min with 4% paraformaldehyde at room temperature or with ice‐cold methanol (Vps34 and ULK1) and then observed routinely under an Olympus Fluoview 300 or 1000 laser scanning microscope. When noted, a BX53 microscope with a DP53 CCD camera was used to capture images. Unless specifically stated, representative images of at least three independent experiments are shown in figures. Colocalization was quantitated by measuring the Manders’ coefficient.
Quantification of LC3‐positive and other autophagy‐related structures
Because LC3‐positive puncta in MAP1B‐depleted cells were highly heterogeneous in size, and occasionally aggregated, when compared with LC3‐positive puncta observed in starvation (e.g., see Fig 2A), we used, as an index of autophagosome formation, the intensity of LC3 staining instead of the number of LC3‐positive puncta.
Immunoelectron microscopy
Immunoelectron microscopy was performed as described previously 50, except that the cells were fixed with 4% paraformaldehyde for 30 min.
Proximity ligation assay
Proximity ligation assay 51 was conducted using a PLA kit (Sigma‐Aldrich) according to the manufacturer's protocol. Thirty cells were analyzed in each assay. Determination of the number of PLA dots was performed using the ImageJ software (NIH).
BIAP treatment
For the BIAP assay, cells were lysed in buffer comprising 5 mM Tris–HCl (pH 8.0), 10 mM NaCl, 1 mM MgCl2, 0.1 mM DTT, 20 mM NaF, and 0.1% SDS at 100°C. After cooling, the lysates were incubated with 3 μg/ml BIAP for 1 h at 37°C.
Statistics
The results were averaged, expressed as the mean with SEM or SD, and analyzed by means of a paired Student's t‐test. The P‐values are indicated by asterisks in the figures with the following notations: *P ≤ 0.05, **P ≤ 0.01; ***P ≤ 0.001.
Author contributions
This study was conceived and designed by HN, KA, and MT. HN, KA, YK, HK, NN, and ND performed the experiments; AY performed the electron microscopic experiments; SY contributed with reagents; YW and HI contributed with expertise in experiments.
Conflict of interest
The authors declare that they have no conflict of interest.
Supporting information
Expanded View Figures PDF
Source Data for Expanded View
Review Process File
Source Data for Figure 1
Source Data for Figure 2
Source Data for Figure 3
Source Data for Figure 4
Source Data for Figure 5
Source Data for Figure 6
Acknowledgements
We thank Dr. N. Mizushima, Dr. N. Ishihara, and Dr. F. Propst for the gifts of plasmids. This paper is dedicated to the memory of Dr. Akitsugu Yamamoto who prematurely passed away on September 28, 2016. This work was supported in part by Grants‐in‐Aid for Scientific Research, #25291029 and #26650066 (to MT), #26111520, #26713016 and #16H01206 (to KA), and MEXT‐Supported Program for the Strategic Research Foundation at Private Universities (to MT and KA) from the Ministry of Education, Culture, Sports, Science and Technology of Japan and the Sumitomo Foundation (KA).
EMBO Reports (2018) 19: e45584
Contributor Information
Kohei Arasaki, Email: karasaki@toyaku.ac.jp.
Mitsuo Tagaya, Email: tagaya@toyaku.ac.jp.
References
- 1. Kroemer G, Mariño G, Levine B (2010) Autophagy and the integrated stress response. Mol Cell 40: 280–293 [DOI] [PMC free article] [PubMed] [Google Scholar]
- 2. Chen Y, Klionsky DJ (2011) The regulation of autophagy—unanswered questions. J Cell Sci 124: 161–170 [DOI] [PMC free article] [PubMed] [Google Scholar]
- 3. Mizushima N, Yoshimori T, Ohsumi Y (2011) The role of Atg proteins in autophagosome formation. Annu Rev Cell Dev Biol 27: 107–132 [DOI] [PubMed] [Google Scholar]
- 4. Carlsson SR, Simonsen A (2015) Membrane dynamics in autophagosome biogenesis. J Cell Sci 128: 193–205 [DOI] [PubMed] [Google Scholar]
- 5. Ktistakis NT, Tooze SA (2016) Digesting the expanding mechanisms of autophagy. Trends Cell Biol 26: 624–635 [DOI] [PubMed] [Google Scholar]
- 6. Axe EL, Walker SA, Manifava M, Chandra P, Roderick HL, Habermann A, Griffiths G, Ktistakis NT (2008) Autophagosome formation from membrane compartments enriched in phosphatidylinositol 3‐phosphate and dynamically connected to the endoplasmic reticulum. J Cell Biol 182: 685–701 [DOI] [PMC free article] [PubMed] [Google Scholar]
- 7. Hayashi‐Nishino M, Fujita N, Noda T, Yamaguchi A, Yoshimori T, Yamamoto A (2009) A subdomain of the endoplasmic reticulum forms a cradle for autophagosome formation. Nat Cell Biol 11: 1433–1437 [DOI] [PubMed] [Google Scholar]
- 8. Ylä‐Anttila P, Vihinen H, Jokitalo E, Eskelinen EL (2009) 3D tomography reveals connections between the phagophore and endoplasmic reticulum. Autophagy 5: 1180–1185 [DOI] [PubMed] [Google Scholar]
- 9. Hamasaki M, Furuta N, Matsuda A, Nezu A, Yamamoto A, Fujita N, Oomori H, Noda T, Haraguchi T, Hiraoka Y et al (2013) Autophagosomes form at ER‐mitochondria contact sites. Nature 495: 389–393 [DOI] [PubMed] [Google Scholar]
- 10. Matsunaga K, Morita E, Saitoh T, Akira S, Ktistakis NT, Izumi T, Noda T, Yoshimori T (2010) Autophagy requires endoplasmic reticulum targeting of the PI3‐kinase complex via Atg14L. J Cell Biol 190: 511–521 [DOI] [PMC free article] [PubMed] [Google Scholar]
- 11. Hailey DW, Rambold AS, Satpute‐Krishnan P, Mitra K, Sougrat R, Kim PK, Lippincott‐Schwartz J (2010) Mitochondria supply membranes for autophagosome biogenesis during starvation. Cell 141: 656–667 [DOI] [PMC free article] [PubMed] [Google Scholar]
- 12. Itakura E, Kishi‐Itakura C, Mizushima N (2012) The hairpin‐type tail‐anchored SNARE syntaxin 17 targets to autophagosomes for fusion with endosomes/lysosomes. Cell 151: 1256–1269 [DOI] [PubMed] [Google Scholar]
- 13. Takáts S, Nagy P, Varga Á, Pircs K, Kárpáti M, Varga K, Kovács AL, Hegedűs K, Juhász G (2013) Autophagosomal syntaxin17‐dependent lysosomal degradation maintains neuronal function in Drosophila . J Cell Biol 201: 531–539 [DOI] [PMC free article] [PubMed] [Google Scholar]
- 14. Jiang P, Nishimura T, Sakamaki Y, Itakura E, Hatta T, Natsume T, Mizushima N (2014) The HOPS complex mediates autophagosome‐lysosome fusion through interaction with syntaxin 17. Mol Biol Cell 25: 1327–1337 [DOI] [PMC free article] [PubMed] [Google Scholar]
- 15. Takáts S, Pircs K, Nagy P, Varga Á, Kárpáti M, Hegedűs K, Kramer H, Kovács AL, Sass M, Juhász G (2014) Interaction of the HOPS complex with syntaxin 17 mediates autophagosome clearance in Drosophila . Mol Biol Cell 25: 1338–1354 [DOI] [PMC free article] [PubMed] [Google Scholar]
- 16. Diao J, Liu R, Rong Y, Zhao M, Zhang J, Lai Y, Zhou Q, Wilz LM, Li J, Vivona S et al (2015) ATG14 promotes membrane tethering and fusion of autophagosomes to endolysosomes. Nature 520: 563–566 [DOI] [PMC free article] [PubMed] [Google Scholar]
- 17. Arasaki K, Shimizu H, Mogari H, Nishida N, Hirota N, Furuno A, Kudo Y, Baba M, Baba N, Cheng J et al (2015) A role for the ancient SNARE syntaxin 17 in regulating mitochondrial division. Dev Cell 32: 304–317 [DOI] [PubMed] [Google Scholar]
- 18. Gomes LC, Di Benedetto G, Scorrano L (2011) During autophagy mitochondria elongate, are spared from degradation and sustain cell viability. Nat Cell Biol 13: 589–598 [DOI] [PMC free article] [PubMed] [Google Scholar]
- 19. Rambold AS, Kostelecky B, Elia N, Lippincott‐Schwartz J (2011) Tubular network formation protects mitochondria from autophagosomal degradation during nutrient starvation. Proc Natl Acad Sci USA 108: 10190–10195 [DOI] [PMC free article] [PubMed] [Google Scholar]
- 20. Hammarback JA, Obar RA, Hughes SM, Vallee RB (1991) MAP1B is encoded as a polyprotein that is processed to form a complex N‐terminal microtubule‐binding domain. Neuron 7: 129–139 [DOI] [PubMed] [Google Scholar]
- 21. Villarroel‐Campos D, Gonzalez‐Billault C (2014) The MAP1B case: an old MAP that is new again. Dev Neurobiol 74: 953–971 [DOI] [PubMed] [Google Scholar]
- 22. Orbán‐Németh Z, Simader H, Badurek S, Tranciková A, Propst F (2005) Microtubule‐associated protein 1S, a short and ubiquitously expressed member of the microtubule‐associated protein 1 family. J Biol Chem 280: 2257–2265 [DOI] [PubMed] [Google Scholar]
- 23. Xie R, Nguyen S, McKeehan K, Wang F, McKeehan WL, Liu L (2011) Microtubule‐associated protein 1S (MAP1S) bridges autophagic components with microtubules and mitochondria to affect autophagosomal biogenesis and degradation. J Biol Chem 286: 10367–10377 [DOI] [PMC free article] [PubMed] [Google Scholar]
- 24. Liu L, McKeehan WL, Wang F, Xie R (2012) MAP1S enhances autophagy to suppress tumorigenesis. Autophagy 8: 278–280 [DOI] [PMC free article] [PubMed] [Google Scholar]
- 25. Steegmaier M, Oorschot V, Klumperman J, Scheller RH (2000) Syntaxin 17 is abundant in steroidogenic cells and implicated in smooth endoplasmic reticulum membrane dynamics. Mol Biol Cell 11: 2719–2731 [DOI] [PMC free article] [PubMed] [Google Scholar]
- 26. Arasaki K, Mikami Y, Shames SR, Inoue H, Wakana Y, Tagaya M (2017) Legionella effector Lpg1137 shuts down ER‐mitochondria communication through cleavage of syntaxin 17. Nat Commun 8: 15406 [DOI] [PMC free article] [PubMed] [Google Scholar]
- 27. Polson HE, de Lartigue J, Rigden DJ, Reedijk M, Urbé S, Clague MJ, Tooze SA (2010) Mammalian Atg18 (WIPI2) localizes to omegasome‐anchored phagophores and positively regulates LC3 lipidation. Autophagy 6: 506–522 [DOI] [PubMed] [Google Scholar]
- 28. Karanasios E, Stapleton E, Manifava M, Kaizuka T, Mizushima N, Walker SA, Ktistakis NT (2013) Dynamic association of the ULK1 complex with omegasomes during autophagy induction. J Cell Sci 126: 5224–5238 [DOI] [PubMed] [Google Scholar]
- 29. Shang L, Chen S, Du F, Li S, Zhao L, Wang X (2011) Nutrient starvation elicits an acute autophagic response mediated by Ulk1 dephosphorylation and its subsequent dissociation from AMPK. Proc Natl Acad Sci USA 108: 4788–4793 [DOI] [PMC free article] [PubMed] [Google Scholar]
- 30. Wong PM, Feng Y, Wang J, Shi R, Jiang X (2015) Regulation of autophagy by coordinated action of mTORC1 and protein phosphatase 2A. Nat Commun 6: 8048 [DOI] [PMC free article] [PubMed] [Google Scholar]
- 31. Russell RC, Tian Y, Yuan H, Park HW, Chang YY, Kim J, Kim H, Neufeld TP, Dillin A, Guan KL (2013) ULK1 induces autophagy by phosphorylating Beclin‐1 and activating VPS34 lipid kinase. Nat Cell Biol 15: 741–750 [DOI] [PMC free article] [PubMed] [Google Scholar]
- 32. Yamamoto A, Tagawa Y, Yoshimori T, Moriyama Y, Masaki R, Tashiro Y (1998) Bafilomycin A1 prevents maturation of autophagic vacuoles by inhibiting fusion between autophagosomes and lysosomes in rat hepatoma cell line, H‐4‐II‐E cells. Cell Struct Funct 23: 33–42 [DOI] [PubMed] [Google Scholar]
- 33. Kimura S, Noda T, Yoshimori T (2007) Dissection of the autophagosom maturation process by a novel reporter protein, tandem fluorescent‐tagged LC3. Autophagy 3: 452–460 [DOI] [PubMed] [Google Scholar]
- 34. Wold MS, Lim J, Lachance V, Deng Z, Yue Z (2016) ULK1‐mediated phosphorylation of ATG14 promotes autophagy and is impaired in Huntington's disease models. Mol Neurodegener 11: 76 [DOI] [PMC free article] [PubMed] [Google Scholar]
- 35. Park JM, Jung CH, Seo M, Otto NM, Grunwald D, Kim KH, Moriarity B, Kim YM, Starker C, Nho RS et al (2016) MTORC1 signaling to the autophagy initiation machinery via binding and phosphorylating ATG14. Autophagy 12: 547–564 [DOI] [PMC free article] [PubMed] [Google Scholar]
- 36. Chan EY, Kir S, Tooze SA (2007) siRNA screening of the kinome identifies ULK1 as a multidomain modulator of autophagy. J Biol Chem 282: 25464–25474 [DOI] [PubMed] [Google Scholar]
- 37. Musiwaro P, Smith M, Manifava M, Walker SA, Ktistakis NT (2013) Characteristics and requirements of basal autophagy in HEK 293 cells. Autophagy 9: 1407–1417 [DOI] [PubMed] [Google Scholar]
- 38. Jiménez‐Mateos EM, González‐Billault C, Dawson HN, Vitek MP, Avila J (2006) Role of MAP1B in axonal retrograde transport of mitochondria. Biochem J 397: 53–59 [DOI] [PMC free article] [PubMed] [Google Scholar]
- 39. Hummel T, Krukkert K, Roos J, Davis G, Klämbt C (2000) Drosophila Futsch/22C10 is a MAP1B‐like protein required for dendritic and axonal development. Neuron 26: 357–370 [DOI] [PubMed] [Google Scholar]
- 40. Bettencourt da Cruz A, Schwärzel M, Schulze S, Niyyati M, Heisenberg M, Kretzschmar D (2005) Disruption of the MAP1B‐related protein FUTSCH leads to changes in the neuronal cytoskeleton, axonal transport defects, and progressive neurodegeneration in Drosophila . Mol Biol Cell 16: 2433–2442 [DOI] [PMC free article] [PubMed] [Google Scholar]
- 41. Lee S, Liu HP, Lin WY, Guo H, Lu B (2010) LRRK2 kinase regulates synaptic morphology through distinct substrates at the presynaptic and postsynaptic compartments of the Drosophila neuromuscular junction. J Neurosci 30: 16959–16969 [DOI] [PMC free article] [PubMed] [Google Scholar]
- 42. Stephan R, Goellner B, Moreno E, Frank CA, Hugenschmidt T, Genoud C, Aberle H, Pielage J (2015) Hierarchical microtubule organization controls axon caliber and transport and determines synaptic structure and stability. Dev Cell 33: 5–21 [DOI] [PMC free article] [PubMed] [Google Scholar]
- 43. Yonashiro R, Kimijima Y, Shimura T, Kawaguchi K, Fukuda T, Inatome R, Yanagi S (2012) Mitochondrial ubiquitin ligase MITOL blocks S‐nitrosylated MAP1B‐light chain 1‐mediated mitochondrial dysfunction and neuronal cell death. Proc Natl Acad Sci USA 109: 2382–2387 [DOI] [PMC free article] [PubMed] [Google Scholar]
- 44. Stroissnigg H, Trancíková A, Descovich L, Fuhrmann J, Kutschera W, Kostan J, Meixner A, Nothias F, Propst F (2007) S‐nitrosylation of microtubule‐associated protein 1B mediates nitric‐oxide‐induced axon retraction. Nat Cell Biol 9: 1035–1045 [DOI] [PubMed] [Google Scholar]
- 45. Behrends C, Sowa ME, Gygi SP, Harper JW (2010) Network organization of the human autophagy system. Nature 466: 68–76 [DOI] [PMC free article] [PubMed] [Google Scholar]
- 46. Wilkinson DS, Jariwala JS, Anderson E, Mitra K, Meisenhelder J, Chang JT, Ideker T, Hunter T, Nizet V, Dillin A et al (2015) Phosphorylation of LC3 by the Hippo kinases STK3/STK4 is essential for autophagy. Mol Cell 57: 55–68 [DOI] [PMC free article] [PubMed] [Google Scholar]
- 47. Varjosalo M, Sacco R, Stukalov A, van Drogen A, Planyavsky M, Hauri S, Aebersold R, Bennett KL, Colinge J, Gstaiger M et al (2013) Interlaboratory reproducibility of large‐scale human protein‐complex analysis by standardized AP‐MS. Nat Methods 10: 307–314 [DOI] [PubMed] [Google Scholar]
- 48. Hauri S, Wepf A, van Drogen A, Varjosalo M, Tapon N, Aebersold R, Gstaiger M (2013) Interaction proteome of human Hippo signaling: modular control of the co‐activator YAP1. Mol Syst Biol 9: 713 [DOI] [PMC free article] [PubMed] [Google Scholar]
- 49. Luo S, Garcia‐Arencibia M, Zhao R, Puri C, Toh PP, Sadiq O, Rubinsztein DC (2012) Bim inhibits autophagy by recruiting Beclin 1 to microtubules. Mol Cell 47: 359–370 [DOI] [PMC free article] [PubMed] [Google Scholar]
- 50. Iinuma T, Aoki T, Arasaki K, Hirose H, Yamamoto A, Samata R, Hauri HP, Arimitsu N, Tagaya M, Tani K (2009) Role of syntaxin 18 in the organization of endoplasmic reticulum subdomains. J Cell Sci 122: 1680–1690 [DOI] [PubMed] [Google Scholar]
- 51. Söderberg O, Gullberg M, Jarvius M, Ridderstråle K, Leuchowius KJ, Jarvius J, Wester K, Hydbring P, Bahram F, Larsson LG et al (2006) Direct observation of individual endogenous protein complexes in situ by proximity ligation. Nat Methods 3: 995–1000 [DOI] [PubMed] [Google Scholar]
Associated Data
This section collects any data citations, data availability statements, or supplementary materials included in this article.
Supplementary Materials
Expanded View Figures PDF
Source Data for Expanded View
Review Process File
Source Data for Figure 1
Source Data for Figure 2
Source Data for Figure 3
Source Data for Figure 4
Source Data for Figure 5
Source Data for Figure 6