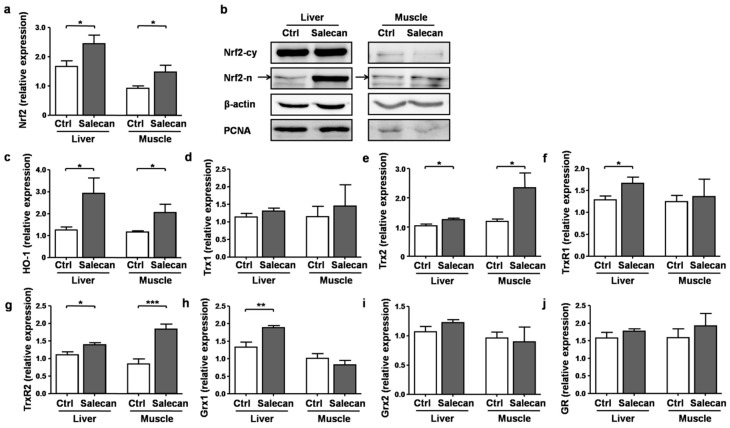
Figure 7.
The mRNA and protein levels of (a,b) Nrf2; mRNA expression levels of (c) HO-1, (d) Trx1, (e) Trx2, (f) TrxR1, (g) TrxR2, (h) Grx1, (i) Grx2, and (j) GR in the liver and muscle of mice from the control and Salecan-treated groups were analyzed. Ctrl, the control group that received phosphate buffer saline (PBS) for three days; Salecan, the group that received high-dose of Salecan treatment for three days. PCNA, proliferating cell nuclear antigen. Data are expressed as mean ± SD, N = 6, * p < 0.05, ** p < 0.01, *** p < 0.001.

