

Abstract
Effective cancer treatment strategy requires an understanding of cancer behavior and development across multiple temporal and spatial scales. This has resulted into a growing interest in developing multiscale mathematical models that can simulate cancer growth, development, and response to drug treatments. This study thus investigates multiscale tumor modeling that integrates drug pharmacokinetic and pharmacodynamic (PK/PD) information using stochastic hybrid system modeling framework. Specifically, (1) pathways modeled by differential equations are adopted for gene regulations at the molecular level; (2) cellular automata (CA) model is proposed for the cellular and multicellular scales. Markov chains are used to model the cell behaviors by taking into account the gene expression levels, cell cycle, and the microenvironment. The proposed model enables the prediction of tumor growth under given molecular properties, microenvironment conditions, and drug PK/PD profile. Simulation results demonstrate the effectiveness of the proposed approach and the results agree with observed tumor behaviors.
Keywords: Multiscale modeling, stochastic hybrid system, PK/PD, genetic regulatory network, drug effect modeling
Introduction
The complexity and heterogeneity of cancer makes it highly difficult to develop effective cancer therapeutics. Mathematical models can help in designing effective cancer therapy and predicting cancer behavior in a more tractable, efficient, and inexpensive manner.1–3 There is an increasing interest in developing multiscale mathematical models that can simulate and predict cancer growth, development, and response to drug treatments due to its potential for enabling patient-oriented predictions, treatment design, planning, and drug delivery.4–9 This is because cancer is a complex disease and its evolution cuts across multiple temporal and spatial biological scales. The spatiotemporal scales are characterized by processes ranging from reactions at the molecular scale to interactions within and among the cells, and to cancer growth, development, and metastasis at the tissue level.10 The multiscale and complex nature of cancer thus calls for modeling frameworks that are able to capture the molecular-, cellular-, tissue-, and organ-level processes involved across the spatiotemporal scales adequately.
Recent studies have highlighted the significance of multiscale modeling to cancer behavior and treatment strategies. For instance, multicellular modeling of the growth and development of cancer through the alteration in the mechanical property of mutant cells has been investigated by Osborne.4 It provides insights into how mutations affect the structures of cells and an approach for the inclusion of cell phenotypic properties with diverse mechanical features associated with cellular Potts models is given.4 Yan et al7 developed a 3-dimensional (3D) multiscale model to examine the progression of glioblastoma (GBM) by exploring tumor development under diverse microenvironment conditions. The effect of feedback among diverse types of cell and cross talk between vascular endothelial cells and glioma stem cells were explored. A partial disruption of the cross talk link results in tumor size reduction but does not increase the invasive potential. Thus, the cross talk link may be exploited as a new therapeutic target for GBM therapy.7 To show that telomerase inhibitions repress the rate of cell death detects and increases the cell senescence rate, a cell compartment approach was implemented to investigate the time-dependent and dose-based impacts of the anticancer agent (RHPS4) on the HCT116 cancer cell line.8
The dynamic behavior and phenotypic properties of a single tumor cell to an external therapeutic agent may be influenced by the cell’s interaction with the diverse neighboring cells; hence, the effect of treatments may deviate significantly from the expected outcome based solely on the individual cell’s phenotypic features. Thus, Brown et al9 investigated 4 beneficial and detrimental aggregation effects in cancer cell populations by applying the evolutionary and ecological concept to multiscale mathematical modeling while accounting for the relationships among diverse group of tumor cells. The model shows the importance of exploiting the detrimental aggregation effects in designing evolutionary-based drugs that can take advantage of the deleterious effects that neighbor cells might have on one another.9
In cancer system modeling and drug therapeutics, it is vital to understand the response of the system to perturbations and how to obtain a desired effect via a modification to the system. For effective drug discovery and intervention, it is critical to have an understanding of the complex mapping between genotype and phenotype, an evaluation of the regulatory interaction among genes, proteins, and other molecules and the effect of perturbations and other biological processes at the molecular, cellular, and tissue/organ scales.8,11–13 Thus, it is imperative to have models that can predict and provide functional insights into disease-drug interactions and pharmacokinetics/pharmacodynamics (PK/PD) information, to ensure that therapeutic intervention becomes a more systematic and faster process. A major challenge is linking drug PK characteristics with PD information for a better grasp of the time course of drug effects after drug intake. Mathematical modeling14 and simulation tools are indispensable in integrating PK/PD information and optimizing drug regimen. Thus, this study presents a systematic and multiscale mathematical model to study drug effects under the assumption that the drug target corresponds to a gene or protein in the proposed model.15,16 The goal is to investigate the system responses at various scales under drug perturbations to provide suggestion for effective therapeutic intervention.
The various components of the proposed multiscale model are depicted as shown in Figure 1, where the molecular level, cellular level, and multicellular levels are considered. An ordinary differential equation (ODE) pathway model is adopted at the molecular level, where the concentration of proteins and gene expression levels are treated as continuous values. Cellular automata of a 2-dimensional grid at the cellular level are used. Each individual cell is treated as a discrete entity, and cell fate is derived using a Markov chain. The transition probability of the Markov chain is determined by the downstream gene expression levels of the pathway of interest and the microenvironment (mE). At the multicellular level, the cells affected by the drug exhibit progressive degrees of decay from the surface to the core assuming a solid tumor. From the biological signal transduction perspective, biological signals and drug perturbation at the molecular scale trigger intracellular signaling in various pathways. At the cellular scale, the biological signals coupled with the cell cycle and microenvironment cues determine cell fate such as proliferation and apoptosis. At the multicellular scale, the population of cells and their behavior determines the structure and behavior of the resulting tumor.
Figure 1.

The schematic representation of the proposed multiscale model and the components.
The detailed model setup is discussed in section “Multiscale Model Formulation.” Simulation studies are presented in Section “Simulation Results.” Section “Discussion” presents additional discussions, whereas section “Conclusions” provides a conclusion to the article.
Multiscale Model Formulation
Mathematical cancer models usually follow the discrete, continuous, or hybrid modeling methods.17 Discrete modeling approaches involve the explicit representation of individual cells, for instance, using biological rules. Discrete modeling methods are usually based on the lattice-free modeling (agent-based modeling [ABM]) or the lattice-based modeling (CA) approaches. The ABMs can be lattice based too and CA may be considered a special case of ABM.18–20 These techniques have the capability to describe the evolving population-level dynamics without prior knowledge of tumor behaviors.
Continuous mathematical models describe the large-scale tumor growth dynamics by treating the tumor size as a continuous medium instead of the resolutions of individual cells. Hybrid modeling approaches involve the integration of both the continuous and discrete entities used to describe the concentrations or density fields and the individual cells, respectively. Continuum mathematical modeling methods are commonly based on ordinary and partial differential equations. These modeling methods have the ability to describe the common behaviors of tumors, simulate experimental observations, and recommend modification as well as test theoretical hypotheses.
Hybrid models combine the strengths of both continuous and discrete modeling approaches. Stochastic hybrid system can also model randomness that may be inherent to the system being modeled. In this work, stochastic hybrid modeling method is proposed to integrate randomness and exploit the advantages of both the discrete and the continuous modeling frameworks to stochastically simulate the behavior of the tumor cells.6,7
Because cancer tumor cells divide uninhibitedly and they often grow and develop with the goal of optimizing their proliferation potentials, they are categorized as proliferating, quiescent, or decaying/dead in the proposed model. It is assumed that each proliferating cell from the cancer cell population may produce daughter cells with similar kinetic characteristics when the cell cycle and microenvironment permit. It is also assumed that the cells will go through a series of decay until dead when damaged. Figure 1 has 4 major parts with each part described in the remainder of this section as follows.
Part I: pharmacokinetic and pharmacodynamic models
Pharmacokinetics define the drug dose concentration-time response, ie, how the drug is absorbed, distributed, metabolized, and excreted, whereas pharmacodynamics explore the concentration-response of drug effects.1 Our model includes a drug effect factor in equation (1) that is related to the time course of drug effects (PK/PD) after drug perturbation (ie, links PK and PD). An integrated PK and PD model is vital in adequately describing the time course of drug effects because such model bridges between a pair of classical topics in pharmacology.21
The PK model
The concentration of the drug at the effect site is vital for the pharmacological effect of the drug. As illustrated by Kuh et al,22 the drug’s intracellular concentrations increase exponentially when the drug is absorbed following each intake of the drug. The concentration of the drug may change slowly (this is approximated as a flat line in our model) when the drug’s intracellular and extracellular concentrations approach equilibrium. Then, the concentration decreases exponentially as the drug elimination rate is higher than the rate of entering the effect site, resulting in diminishing effects. According to Kuh et al,22 a widely used modeling curve for the concentration-time profile of the drug is the PK plot shown in Part I of Figure 1. The proposed modeling approach is generalized enough to handle diverse cases even though different drugs function differently. The concentration increase stage may be ignored if the drug concentration increases very rapidly, or the equilibrium phase may be neglected if it is very short. By adjustment of the model, one can represent specific drug characteristic.
The PD model
Generally, drug pharmacologic effect magnitude is directly proportional to the dose before it eventually reaches saturation.23 The most widely used concentration response model is the logistic model or the Hill equation, equally referred to as the sigmoidal model.24 It is assumed in our model that the drug effect coefficient (where the drug target is according to equation (1)) relates to the concentration via a sigmoidal function approximated by the PD plot in Part I of Figure 1, where the drugs only begin to be effective after the concentration level exceeds a lower threshold and the effect of the drug reaches saturation after the concentration level rises above an upper threshold . The PK curve is sampled for each time instant and the corresponding drug concentration level is fed into the PD curve to obtain the drug effect factor (linked to Part II).
Part II: proliferation and survival pathway modeling
At the molecular level, the proliferation and survival pathway (see the work by Li at al25 for pathway and equations) is considered. The RAS/RAF/MEK/ERK pathway is usually associated with cell proliferation, prevention of programmed cell death, and resistance to therapies. This pathway is exploited by growth factors and mitogens in transmitting signals from the receptors for regulating gene expression and preventing apoptosis or programmed cell death. Some of the proliferation pathways’ components (for instance, RAS, B-RAF) undergo mutations or overexpressions in human cancer (for instance, breast and prostate cancers).26 However, PI3K/AKT/mTOR pathway signifies a prototypical survival pathway which is activated in various types of cancer. The pathway is usually activated by diverse processes some of which include mutations or amplifications of the PI3K, loss of the tumor suppressor (PTEN) function, activations of the growth factor receptors, amplifications or mutations of AKT, exposure to carcinogen, and so on. After it is activated, signaling through AKT may propagate to various array of substrates that includes mTOR, a crucial regulator of protein translation. The survival pathway functions as an appealing drug target for cancer therapy because it serves as a point of convergence for various growth stimuli. It is equally responsible for the regulation of cellular processes that contribute to cancer growth and development via the downstream substrates. In addition, activation of the AKT/mTOR pathway bolsters resistances to many cancer treatment approaches, and it thus constitutes one of the poor prognostic factors for several types of cancer.27
Genetic regulation in a pathway with drug perturbation can be modeled with rate equations that express the differences between production and degradation rates,11,28,29 as follows:
| (1) |
where and represent gene (protein) expression levels, is targeted by the drug and it is also regulated by . is a synthesis factor and is a degradation factor. represents the drug effect factor which is determined by the pharmacologic model of the drug. The state of the switch depends on the drug perturbation.
Using the rate equations, the proliferation and survival pathways that biologists currently understand, for example, the Kegg collection of pathways (https://www.genome.jp/kegg/pathway.html) and the NIH BioCarta pathway collections (https://cgap.nci.nih.gov/Pathways/BioCarta_Pathways), are illustrated in the works by Dougherty and colleagues,25,30,31 which provides the pathway dynamics (following equation (1)) for the proteins and complexes together with input from drug lapatinib.25 The expected effect of the drug (lapatinib) is the suppression of the pathway, that is, reducing the concentration level of ERK and thus preventing the tumor cells from proliferation. It is assumed that the lower the ERK concentration, the more effective the drug is and the lower the number of proliferating cells. After solving the system of coupled ODEs describing the pathway at each instant, the concentration of downstream ERK ([ERK]) is obtained and linked to Part III.
Parts III and IV: cellular/multicellular level
A CA model is proposed at the cellular level in an grid to describe the intracellular and intercellular interactions among the cells, drug profile, and the microenvironment (mE) conditions. Specifically, it is assumed that each cell is in one of the states at a given time. For each cell, the gene expression levels and the microenvironment conditions such as nutrients and the number and types of neighboring cells, as well as the current cell states and cell cycle, determine the transition probabilities in the proposed Markov chain as shown in Part III of Figure 1. For instance, If [ERK] is above a threshold, it is expected that and will be high because high ERK concentration implies that more cells are expected to be in a proliferating state. It is assumed that once a cell enters the decaying state, it will never transition back to the quiescent or proliferating state and it is eventually dead based on a progressive degree of decay similar to the transit compartment model.32,33
Proliferation of cells potentially increases the number of cells in the grid. It results in a cell duplicating into a pair of similar offspring cells. The proliferating cells with a good microenvironment condition (based on the transition probability) search for an empty space to deliver their offspring. Because each grid site may be occupied by a single cell, one offspring cell resides in the mother’s grid site and the second is situated in an empty grid site34 as illustrated in Part IV of Figure 1. The procedures for simulating the above process are illustrated in Algorithm 1.
Algorithm 1.
Procedures for simulating the phenotypic decision process for cancer cells.
|
1: Input: Pathway parameters, drug dosage, initial transition probabilities , initial number of cells, initial gene expression levels 2: Output: Cell phenotype, percent of nonproliferating cells 3: for do 4: for each cell do 5: Get from drug PK/PD curve 6: Solve pathway ODEs and obtain [ERK] 7: If ([ERK] ) then 8: adjust 9: Sample Markov chain 10: 11: end if 12: if then 13: if & then 14: Add new cell 15: end if 16: end if 17: return Number of cells |
Simulation Results
Simulations have been performed in MATLAB using the proposed model. The simulations incorporate a baseline run of the pathway ODEs by following the procedure in Algorithm 1. The computational simulation of the proposed model is performed to analyze the model’s performance following drug treatments in silico. The output results correspond to the time series data of the number and type of individual cells.
As the tumor grows and develops, the cells at the core of the tumor are starved of nutrients and thus become dead cells (Figure 2) which are characteristic of tumors. Dead cells far away from the core of the tumor are removed from the lattice. Taking into account the typical duration of the cell cycle (about 24 hours)35,36 and the effective drug half-life (approximately 24 hours for lapatinib),37 the Markov chain is sampled in about every 10-hour interval divided into time slots of 1 hour each. The growth patterns of the cells after some iterations showing a snapshot of spatial and temporal evolutions of cancer cells with no drug perturbation and with drug administration (low dose and high dose) are shown in Figure 2. Simulation depicts a tumor having a necrotic core that is surrounded by cells in a quiescent and proliferating state, respectively. When the periodic drug intake has a high dose, the constant drug concentration in plasma is high enough causing the drug PD value to fall into the effective region in contrast with the drug being administered periodically at low dose that causes the drug PD value to fall in the ineffective range. Thus, the growth of cancer cells is slowed down following the drug administration (Figure 2C) as compared with the case with no drug administration (Figure 2A) as evidenced by the decreased number of cancer cells following the drug administration. This may be due to the administered drug being effective in inhibiting the expression level of ERK and decreasing its concentration, thereby repressing the proliferation pathway. The spatial and temporal patterns depict a tumor having a compact shape and a boundary that is irregular, as it has been observed in some solid tumours.20
Figure 2.
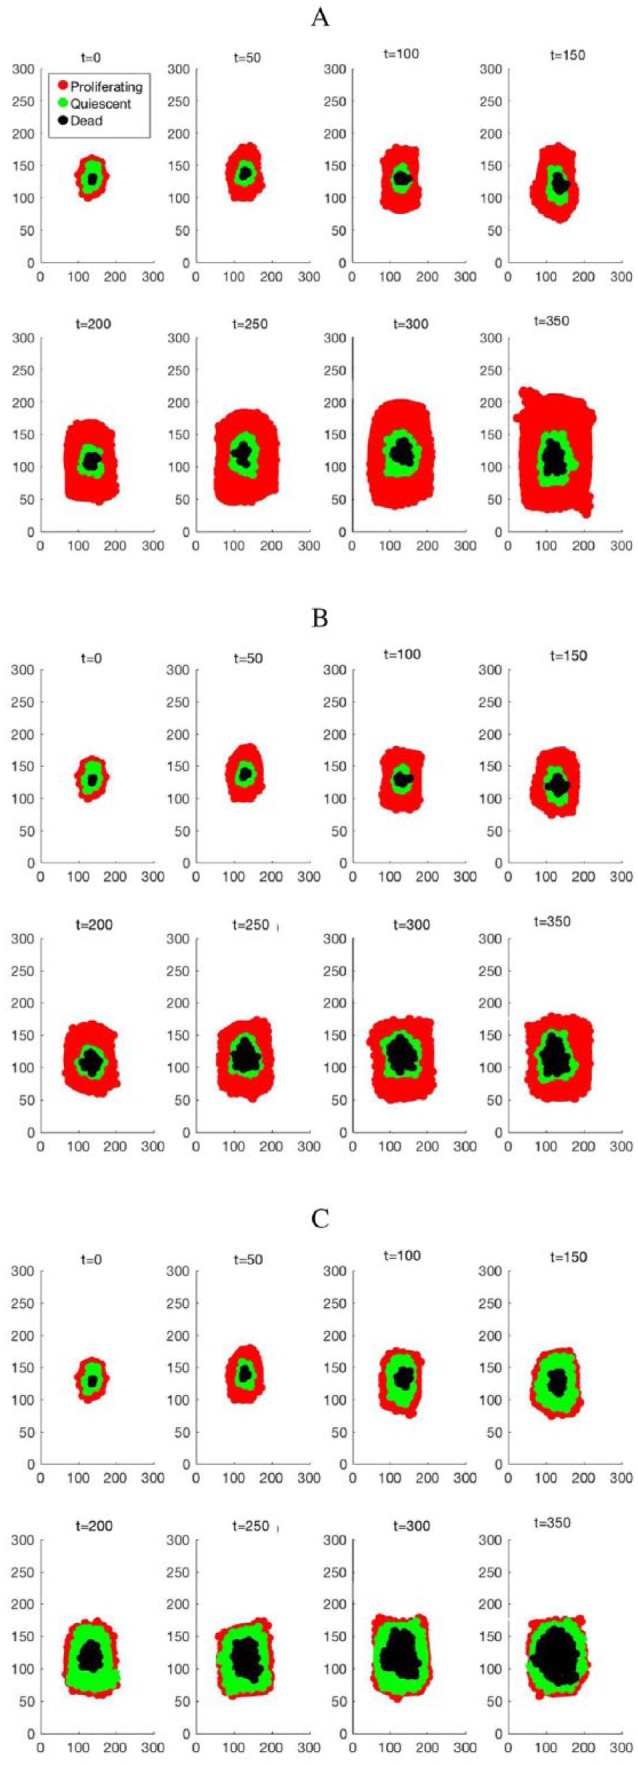
Growth patterns of the cancer cells after 50, 100, 150, 200, 250, 300, and 350 iterations, showing a snapshot of spatial and temporal evolutions of cancer cells (A) with no drug perturbation, (B) with low dose drug intake, and (C) with high dose drug intake.
Figure 3 shows the evolution of the cells with and without drug perturbations. The proliferating cell population typically grows exponentially when they are not exposed to any anticancer drug (Figure 3A) or when a low dose of the drug is administered (Figure 3B) as the drug PD value falls in the ineffective range. It is shown that cancer cell proliferation happens at a much greater speed in comparison with cell death when there is no drug administered or when the administered dose is too low. With a high dose drug intake, the constant drug concentration in plasma is high enough to eventually cause the drug PD value fall within the effective region, Figure 3C shows the effectiveness of the drug administration on the number of proliferating cells and it is observed that the cancer cell proliferation initially happens at a much greater speed than that of cell death and the trend is eventually reversed as the drug becomes more effective in repressing the proliferating cells. Overall, the results show that gene or protein network perturbation by drug at the subcellular level manifests as functional changes at the intercellular, intracellular, and multicellular scales.
Figure 3.
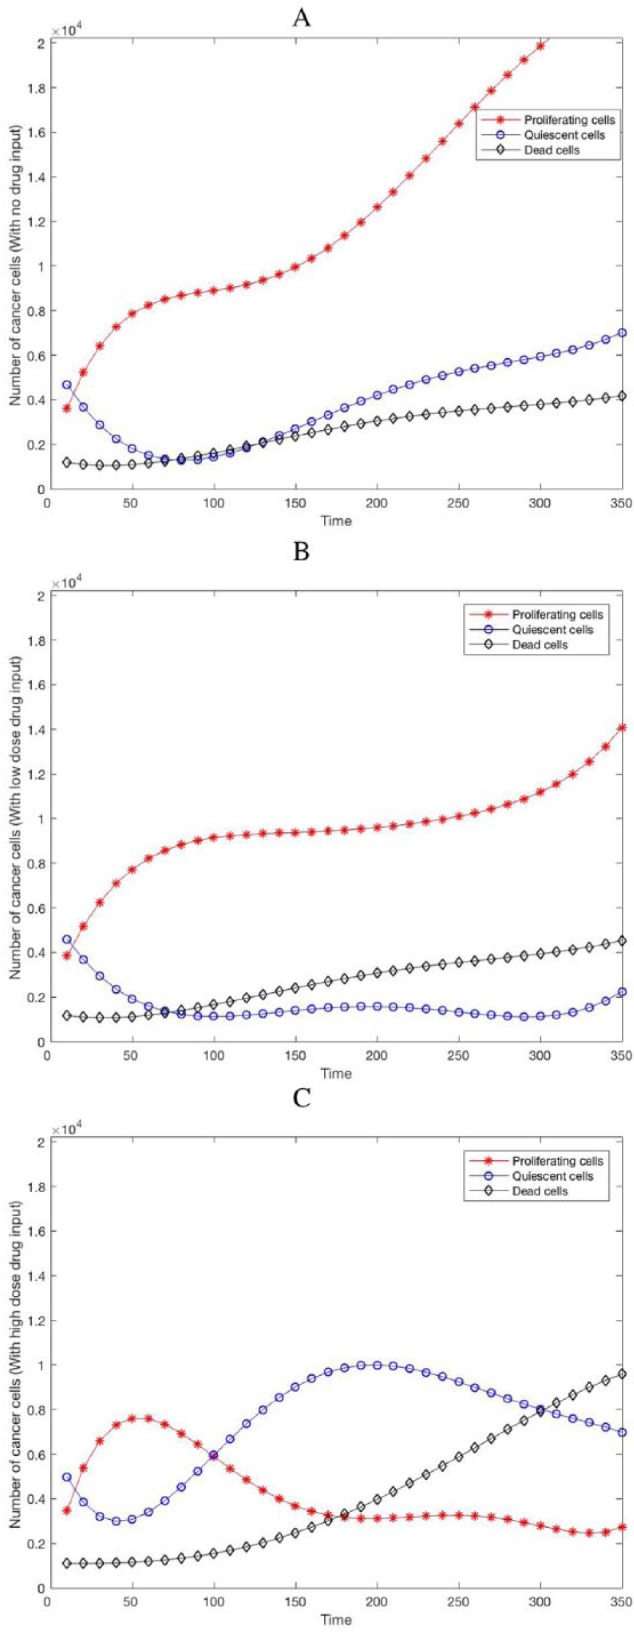
Dynamics or evolution of proliferating, quiescent and dead cells (A) with no drug administration, (B) with low dose drug administration, and (C) with high dose drug perturbation.
Another measure of the repression of the proliferation and survival pathway is the percentage change in number of nonproliferating tumor cells according to the TGen experiments on HCT116 cancer cell line.25 To capture a vital measure of drug effectiveness, the percentage of nonproliferating tumor cells versus the simulation time can be observed from Figure 3. Figure 3C shows that the drug administration represses the proliferating cancer cells as time progresses resulting in the increment observed in the percentage of nonproliferating cells as compared with Figure 3A and B in which the proliferating cells continue to increase as there is no drug administered to repress the cells or the dose of the administered drug is too low (drug PD value falls in the ineffective region) and the drug becomes ineffective in killing the cells. The observed difference may be due to the effectiveness of the drug in targeting the proliferating cells and repressing the pathway.
Discussion
Mathematical models are increasingly being used in the area of quantitative multiscale cancer modeling.38 Although several modeling approaches have been explored in the literature, the actual biosystems are far more complex to the point that current available computational tools are not able to sufficiently describe all the details. In addition, such mathematical models are usually computationally demanding and should therefore be designed in a way that maintains a balance between model complexity and mathematical tractability or simplicity with the aid of clinical or experimental data. In modeling such type of integrated systems and experimental modeling method, associated challenges that researchers may encounter include availability of pertinent biomedical/experimental data, model validation, estimation of model parameters, uncertainty and sensitivity analyses, variable choice for model inclusions, and access to data standards facilitating sharing of results and information.39 Access to proven biomedical or experimental data, model validation against in vivo experiments and high-level innovative mathematical and simulation tools may help to mitigate some of the challenges.
To limit the complexity of the model and to focus primarily on system modeling, we have not incorporated processes such as angiogenesis, vascularization, cell heterogeneity, drug resistance, 3D tumor morphology, and several other biological and biochemical mechanisms into the proposed model. There have been many studies integrating some of these processes into multiscale tumor models and interested readers may refer to the previous works.6,40–43 However, many existing models do not usually integrate the relevant and detailed modeling of the regulatory networks or signaling pathways and the drug pharmacology information. The proposed model is simulated on a fixed grid size for the sake of simplicity and in the case of real cells; the regulation and interaction processes are much more complicated as several hundreds of biochemical reactions occur in the cells. The proposed multiscale model is conceptual and the model parameters are not directly estimated from clinical/experimental data. They are obtained based on general understanding of tumor behavior and via literature search. Availability of various clinical or in vivo data and assays (for instance, drug delivery and metabolism data) may help improve the prediction accuracy of the model. For a more realistic application toward precision medicine, future work on the model could incorporate detailed descriptions of some of these processes and the dynamic changes in tissue morphology resulting from the evolutionary competition among the cells.
Conclusions
This study has proposed a multiscale mathematical model depicting the dynamics of cancer cell population with different drug perturbations. The model has been implemented at the subcellular, cellular, and multicellular hierarchical levels. It is shown by simulations that the tumor cell population typically grows exponentially when they are not exposed to anticancer drug or low dosage of drugs, whereas the growth of tumor cells is repressed with high dose of drugs. The proposed multiscale model could provide vital insight into tumor growth, development, and therapeutic strategies while taking into account specific PK/PD profiles and genetic pathway information. As further experimental/biomedical data become available, the model parameters could be better refined, estimated, and calibrated. Additional study is needed to extend the modeling approach to describe cancer cells in primary cultures and tumor tissues. This may provide further insights into the growth dynamics and response to drug treatments of cancer cell population in vivo.
Footnotes
Declaration of conflicting interests:The author(s) declared no potential conflicts of interest with respect to the research, authorship, and/or publication of this article.
Funding:The author(s) disclosed receipt of the following financial support for the research, authorship, and/or publication of this article: This research work is supported by the US National Science Foundation (NSF) award (1464387 and 1736196) and the Texas A&M University System Chancellor’s Research Initiative (CRI).
Author Contributions: WO and XL performed the literature review, developed and implemented the algorithm, conducted all simulations and data processing and wrote the initial draft of the paper. XL advised WO on algorithm development. WO and XL both read and approved the final version of the paper.
References
- 1. Clancy CE, An G, Cannon WR, et al. Multiscale modeling in the clinic: drug design and development. Ann Biomed Eng. 2016;44:2591-2610. [DOI] [PMC free article] [PubMed] [Google Scholar]
- 2. Wang Z, Butner J, Cristini V, Deisboeck T. Integrated PK-PD and agent-based modeling in oncology. J Pharmacokinet Pharmacodyn. 2015;42:179-189. [DOI] [PMC free article] [PubMed] [Google Scholar]
- 3. Wang Z, Deisboeck T. Mathematical modeling in cancer drug discovery. Drug Discov Today. 2014;19:145-150. [DOI] [PubMed] [Google Scholar]
- 4. Osborne JM. Multiscale model of colorectal cancer using the cellular Potts framework. Cancer Inform. 2015;14:83-93. [DOI] [PMC free article] [PubMed] [Google Scholar]
- 5. Ballesta A, Zhou Q, Zhang X, Lv H, Gallo J. Multiscale design of cell-type-specific pharmacokinetic/pharmacodynamic models for personalized medicine: application to temozolomide in brain tumors. CPT Pharmacometrics Syst Pharmacol. 2014;3:e112. [DOI] [PMC free article] [PubMed] [Google Scholar]
- 6. Zangooei M, Habibi J. Hybrid multiscale modeling and prediction of cancer cell behavior. PLoS ONE. 2017;12:e0183810. [DOI] [PMC free article] [PubMed] [Google Scholar]
- 7. Yan H, Romero-Lopez M, Frieboes HB, Hughes CCW, Lowengrub JS. Multiscale modeling of glioblastoma suggests that the partial disruption of vessel/cancer stem cell crosstalk can promote tumor regression without increasing invasiveness. IEEE T Biomed Eng. 2017;64:538-547. [DOI] [PMC free article] [PubMed] [Google Scholar]
- 8. Johnson L, Byrne H, Willis A, Laughton C. An integrative biological approach to the analysis of tissue culture data: application to the antitumour agent RHPS4. Integr Biol. 2011;3:843-849. [DOI] [PubMed] [Google Scholar]
- 9. Brown J, Cunningham J, Gatenby R. Aggregation effects and population-based dynamics as a source of therapy resistance in cancer. IEEE T Biomed Eng. 2017;64:512-518. [DOI] [PMC free article] [PubMed] [Google Scholar]
- 10. Chakrabarti A, Verbridge S, Stroock AD, Fischbach C, Varner JD. Multiscale models of breast cancer progression. Ann Biomed Eng. 2012;40:2488-2500. [DOI] [PMC free article] [PubMed] [Google Scholar]
- 11. Li X, Qian L, Dougherty E. Dynamical modeling of drug effect using hybrid systems. EURASIP J Bioinform Syst Biol. 2012;2012:19. [DOI] [PMC free article] [PubMed] [Google Scholar]
- 12. Butcher E, Berg E, Kunkel E. System biology in drug discovery. Nat Biotechnol. 2004;22:1253-1259. [DOI] [PubMed] [Google Scholar]
- 13. Kumar N, Hendriks B, Janes K, Graaf D, Lauffenburger D. Applying computational modeling to drug discovery and development. Drug Discov Today. 2006;11:806-811. [DOI] [PubMed] [Google Scholar]
- 14. Kim M, Gillies RJ, Rejniak KA. Current advances in mathematical modeling of anti-cancer drug penetration into tumor tissues. Front Oncol. 2014;3:278. [DOI] [PMC free article] [PubMed] [Google Scholar]
- 15. Li X, Qian L, Hua J, Bittner ML, Dougherty E. Assessing the efficacy of molecularly targeted agents on cell line-based platforms by using system identification. BMC Genomics. 2012;13:S11. [DOI] [PMC free article] [PubMed] [Google Scholar]
- 16. Wang Z, Bordas V, Deisboeck TS. Discovering molecular targets in cancer with multiscale modeling. Drug Dev Res. 2011;72:45-52. [DOI] [PMC free article] [PubMed] [Google Scholar]
- 17. Deisboeck TS, Wang Z, Macklin P, Cristini V. Multiscale cancer modeling. Annu Rev Biomed Eng. 2011;13:127-155. [DOI] [PMC free article] [PubMed] [Google Scholar]
- 18. Wang Z, Butner JD, Kerketta R, Cristini V, Deisboeck TS. Simulating cancer growth with multiscale agent-based modeling. Semin Cancer Biol. 2015;30:70-78. [DOI] [PMC free article] [PubMed] [Google Scholar]
- 19. Wang Z, Birch CM, Sagotsky J, Deisboeck TS. Cross-scale, cross-pathway evaluation using an agent-based non-small cell lung cancer model. Bioinformatics. 2009;25:2389-2396. [DOI] [PMC free article] [PubMed] [Google Scholar]
- 20. Reis E, Santos L, Pinho S. A cellular automata model for avascular solid tumor growth under the effect of therapy. Phys A Stat Mech Appl. 2009;388:1303-1314. [Google Scholar]
- 21. Prez-Urizar J, Granados-Soto V, Flores-Murrieta F, Castada-Hernndez G. Pharmacokinetic-pharmacodynamic modeling: why? Arch Med Res. 2000;31:539-545. [DOI] [PubMed] [Google Scholar]
- 22. Kuh H, Jang S, Wientjes M, Au J. Computational model of intracellular pharmacokinetics of paclitaxel. J Pharmacol Exp Ther. 2000;293:761-770. [PubMed] [Google Scholar]
- 23. Ting N. Introduction and new drug development process. In: Ting N, ed. Dose Finding in Drug Development. New York, NY: Springer; 2006:1-17. [Google Scholar]
- 24. Holford N, Sheiner L. Understanding the dose-effect relationship: clinical application of pharmacokinetic-pharmacodynamic models. Clin Pharmacokinet. 1981;6:429-453. [DOI] [PubMed] [Google Scholar]
- 25. Li X, Qian L, Bittner M, Dougherty E. Drug effect study on proliferation and survival pathways on cell line-based platform: a stochastic hybrid systems approach. Paper presented at: IEEE International Workshop on Genomic Signal Processing and Statistics (GENSIPS); November 17-19, 2013; Houston, TX, pp. 53–57. [Google Scholar]
- 26. McCubrey JA, Steelman LS, Chappell WH, et al. Roles of the RAF/MEK/ERK pathway in cell growth, malignant transformation and drug resistance. Biochim Biophys Acta. 2006;1773:1263-1284. [DOI] [PMC free article] [PubMed] [Google Scholar]
- 27. LoPiccolo J, Blumenthal GM, Bernstein WB, Dennis PA. Targeting the PI3K/AKT/mTOR pathway: effective combinations and clinical considerations. Drug Resist Updat. 2007;11:32-50. [DOI] [PMC free article] [PubMed] [Google Scholar]
- 28. de Jong H. Modeling and simulation of genetic regulatory systems: a literature review. J Comput Biol. 2002;9:67-103. [DOI] [PubMed] [Google Scholar]
- 29. Oduola WO, Li X, Duan C, Qian L, Wu F, Dougherty E. Analysis and control of genetic regulatory systems with switched drug inputs. Paper presented at: IEEE-EMBS 3rd International Conference on Biomedical and Health Informatics (BHI), February 24-27, 2016; Las Vegas, NV, pp. 533–536. [Google Scholar]
- 30. Hua J, Sima C, Cypert M, et al. Tracking transcriptional activities with high-content epifluorescent imaging. J Biomed Opt. 2012;17:046008. [DOI] [PubMed] [Google Scholar]
- 31. Li X, Oduola WO, Qian L, Dougherty ER. Integrating multiscale modeling with drug effects for cancer treatment. Cancer Inform. 2016;5:21-31. [DOI] [PMC free article] [PubMed] [Google Scholar]
- 32. Li X, Qian L, Bittner ML, Dougherty ER. A systems biology approach in therapeutic response study for different dosing regimens—a modeling study of drug effects on tumor growth using hybrid systems. Cancer Inform. 2012;11:41-60. [DOI] [PMC free article] [PubMed] [Google Scholar]
- 33. Simeoni M, Magni P, Cammia C, et al. Predictive pharmacokinetic-pharmacodynamic modeling of tumor growth kinetics in xenograft models after administration of anticancer agents. Cancer Res. 2004;64:1094-1101. [DOI] [PubMed] [Google Scholar]
- 34. Powathil G, Gordon K, Hill L, Chaplain M. Modelling the effects of cell-cycle heterogeneity on the response of a solid tumour to chemotherapy: biological insights from a hybrid multiscale cellular automaton model. J Theor Biol. 2012;308:1-19. [DOI] [PubMed] [Google Scholar]
- 35. Bernerd S, Herzel H. Why do cells cycle with a 24 hour period? Genome Inform. 2006;17:72-79. [PubMed] [Google Scholar]
- 36. Jakesz R, Smith CA, Aitken S, et al. Influence of cell proliferation and cell cycle phase on expression of estrogen receptor in MCF-7 breast cancer cells. Cancer Res. 1984;44:619-625. [PubMed] [Google Scholar]
- 37. Paul B, Trovato JA, Thompson J. Lapatinib: a dual tyrosine kinase inhibitor for metastatic breast cancer. Am J Health Syst Pharm. 2008;65:1703-1710. [DOI] [PubMed] [Google Scholar]
- 38. Oduola WO, Li X, Duan C, Qian L, Dougherty ER. Sequential therapeutic response modeling for tumor treatment using computational hybrid control systems approach. IEEE T Biomed Eng. 2018;65:866-874. [DOI] [PubMed] [Google Scholar]
- 39. Wang Z, Sagotsky J, Taylor T, Shironoshita P, Deisboeck T. Accelerating cancer systems biology research through semantic web technology. Wiley Interdiscip Rev Syst Biol Med. 2013;5:135-151. [DOI] [PMC free article] [PubMed] [Google Scholar]
- 40. Tan H, Li F, Singh J, et al. A 3D multiscale model of cancer stem cell in tumor development. BMC Syst Biol. 2013;7:S12. [DOI] [PMC free article] [PubMed] [Google Scholar]
- 41. Sun X, Bao J, Shao Y. Mathematical modeling of therapy-induced cancer drug resistance: connecting cancer mechanisms to population survival rates. Nature. 2016;6:22498. [DOI] [PMC free article] [PubMed] [Google Scholar]
- 42. Gong C, Milberg O, Wang B, et al. A computational multiscale agent-based model for simulating spatio-temporal tumour immune response to PD1 and PDL1 inhibition. J R Soc Interface. 2017;14:20170320. [DOI] [PMC free article] [PubMed] [Google Scholar]
- 43. Vavourakis V, Wijeratne P, Shipley R, Loizidou M, Stylianopoulos T, Hawkes D. A validated multiscale in-silico model for mechano-sensitive tumour angiogenesis and growth. PLoS Comput Biol. 2017;13:e1005259. [DOI] [PMC free article] [PubMed] [Google Scholar]