

Abstract
Background
Genome-wide association studies have identified >30 common SNPs associated with epithelial ovarian cancer (EOC). We evaluated the combined effects of EOC susceptibility SNPs on predicting EOC risk in an independent prospective cohort study.
Methods
We genotyped ovarian cancer susceptibility single nucleotide polymorphisms (SNPs) in a nested case–control study (750 cases and 1428 controls) from the UK Collaborative Trial of Ovarian Cancer Screening trial. Polygenic risk scores (PRSs) were constructed and their associations with EOC risk were evaluated using logistic regression. The absolute risk of developing ovarian cancer by PRS percentiles was calculated.
Results
The association between serous PRS and serous EOC (OR 1.43, 95% CI 1.29 to 1.58, p=1.3×10⁻¹¹) was stronger than the association between overall PRS and overall EOC risk (OR 1.32, 95% CI 1.21 to 1.45, p=5.4×10⁻¹⁰). Women in the top fifth percentile of the PRS had a 3.4-fold increased EOC risk compared with women in the bottom 5% of the PRS, with the absolute EOC risk by age 80 being 2.9% and 0.9%, respectively, for the two groups of women in the population.
Conclusion
PRSs can be used to predict future risk of developing ovarian cancer for women in the general population. Incorporation of PRSs into risk prediction models for EOC could inform clinical decision-making and health management.
Keywords: polygenic risk scores, ovarian cancer, prospective cohort study, risk prediction, evaluation
Introduction
Ovarian cancer (OC) is the sixth most common cancer in women with 7378 women diagnosed with the cancer in the UK in 2014. Epithelial ovarian cancer (EOC) is the most common type, accounting for 90% of OC, of which two-thirds are serous EOC.1 The overall 10-year survival rate for OC is around 36% and is poorer when diagnosed at an advance stage.2 Therefore, early diagnosis has the potential to improve survival rates; however, most women with symptoms present with advanced stage disease. Epidemiological studies have estimated the risk of OC in first-degree relatives of patients with OC to be threefold greater than the risk in the general population, indicating the importance of genetic factors in disease susceptibility.3 High penetrance mutations in BRCA1 and BRCA2 explain around 25% of the observed familial relative risk (FRR)3 and a further 10% is explained by moderate-risk mutations in MLH1, MSH2, MSH6, RAD51C, RAD51D and BRIP1.4 Genome-wide association studies (GWAS) have identified ~30 common low-risk SNPs that are associated with EOC, accounting for approximately 6.4% of the FRR.5 6 Additional potential susceptibility loci were identified by pleiotropy cancer GWAS analysis.7 Although individually each SNP is associated with a low risk of EOC, in combination their effects on risk may be greater. Their inclusion in EOC risk prediction models may improve risk precision.3 Providing refined personalised cancer risks can result in better risk stratification and hence help in improving early cancer detection and prevention.
Previous published studies investigating the combined effects of EOC SNPs in terms of polygenic risk scores (PRSs) have either been based on retrospective studies or overlapped with the association studies that led to the identification of the SNPs. Here, we use data from an independent prospective population-based cohort study, the UK Collaborative Trial of Ovarian Cancer Screening (UKCTOCS), to evaluate the EOC PRSs in predicting EOC risk prospectively.
Methods
Study subjects
UKCTOCS is a randomised controlled trial for OC screening initiated in 2001. Postmenopausal women between age 50 and 74 years were recruited from 13 regional centres in National Health Service (NHS) Trusts in England, Wales and Northern Ireland.8 9 Exclusion criteria included self-reported previous bilateral oophorectomy or ovarian malignancy, increased risk of OC due to history of OC or breast cancer in the family or known OC predisposing mutations, or had an active non-ovarian malignancy.8–10 All participants provided written informed consent. All women completed a two-page 18-item baseline questionnaire at recruitment which captured data on the known OC risk factors (eg, personal/family cancer history, height/weight, reproductive history, oral contraceptive pill (OCP) and hormone replacement therapy use).9 Two postal follow-up questionnaires were sent to the women, with the first 3–5 years post-randomisation and the second in 2014.8 A blood sample was donated by each woman at recruitment and serum was extracted as previously described.9 Further details on sample processing and DNA extraction are provided in the online supplementary material. Notification of cancer diagnosis and deaths were through NHS Digital for the women residing in England and the Northern Ireland Cancer Registry and Central Services Agency for those residing in Northern Ireland. For women who developed OC, medical notes were retrieved and independently reviewed by an Outcomes Review Committee who assigned histological subtype, stage and grade. For the present study, we used a nested case–control design in women of self-reported white European ancestry. Cases were defined as women diagnosed with incident invasive epithelial ovarian or fallopian tube cancers or primary peritoneal cancer. Two random controls were selected per case, matched on regional centre, age at randomisation and year at recruitment. Following an outcomes review on 31 December 2014,8 a total of 750 EOC cases and 1428 controls were included in the present analysis.
jmedgenet-2018-105313supp001.docx (338.8KB, docx)
SNP selection and genotyping
A panel of 96 SNPs were designed on the basis of their association with EOC risk from the meta-analysis of Kuchenbaecker et al 5 (online supplementary figure 1). These included SNPs from 50 regions that demonstrated associations at genome-wide significance level but also regions with associations at p<10−5. This was done in view of the ongoing OncoArray experiment6 that was being performed on a larger sample size compared with the study of Kuchenbaecker et al. For each region, multiple correlated SNPs were selected for inclusion in the panel to ensure data availability in case of SNP genotyping failures.
Genotyping was performed on 96.96 dynamic arrays using the Fluidigm EP1 system (Fluidigm, San Francisco, California, USA) from 10 ng of DNA following the manufacturer’s conditions using the pre-amplification protocol. The 96 SNPs included inventoried and Custom Assay-by-Design TaqMan probes (Applied Biosystems). Analysis was performed using Genotyping SNP Analysis software (Fluidigm). In total, 52 SNPs failed quality control (QC) due to poor clustering on the serum DNA samples, leaving 44 SNPs for analysis. To ensure consistency with the most recent GWAS results, SNPs were selected for inclusion in the PRS if they were in regions that showed genome-wide significance in the OncoArray experiment6 (online supplementary figure 1). Of the 44 SNPs, 19 SNPs were from 15 genome-wide significant regions reported in the OncoArray experiment (online supplementary figure 1). In total, 191 samples with call rates <80% were excluded (8%); therefore, 2178 samples passed QC (750 cases and 1428 controls). Any 96-well plates with pass rates <80% were excluded for a particular SNP. Also, 131 duplicate samples were included, and the concordance for duplicate samples was 97.6%. SNPs with significant deviations from Hardy-Weinberg equilibrium were assessed for quality of genotype clustering. All demonstrated clear clusters of genotyping calls and were therefore included in the analysis.
SNP selection for inclusion in the PRS
The selection of genotyped SNPs for inclusion in the PRS was based on the latest results from the meta-analysis of GWAS for EOC reported by Phelan et al.6
Two separate PRS were constructed: one for overall EOC and one for serous EOC. The overall PRS was constructed using the set of SNPs that showed associations with overall or any type of EOC at GWAS level. The serous PRS was constructed using the set of SNPs that showed associations with overall or any type of EOC at GWAS level, but also showed associations in the same direction for serous EOC. Only one SNP from each region was used. For each region, if the most significant SNP in the GWAS was among the SNPs genotyped, then it was selected for inclusion in the PRS. If the top SNP was not available, then we used a genotyped SNP (among the 44) from the region which had the highest correlation with the top published SNP. In total, 15 SNPs from 15 regions were included in the overall PRS construction and the same set of SNPs was selected for the serous PRS construction.
Statistical analysis
To construct the PRS, we first evaluated all pairwise SNP interactions among the SNPs included in the PRS for their associations with EOC risk using logistic regression. In each model, the effects of both SNPs were included (as continuous variables taking values 0, 1 and 2) together with an interaction term between the SNPs. The quantile–quantile plot (qqplot) for all pairwise combinations were examined for the null hypothesis of no interaction effect. A Bonferroni correction was applied to adjust for multiple testing. The adjusted p value threshold was set at 8.3×10⁻⁵.
The PRS for individual i was defined as
| (1) |
where gki is the number of effect alleles for SNP k in individual i (taking values 0, 1 and 2) and βk is the per-allele log odds ratio (OR) for developing EOC associated with each copy of the effect allele of SNP k and n is the total number of SNPs used (n=15, online supplementary table 1). The log OR estimates for each SNP were obtained from the combined COGS and OncoArray association analyses of the Ovarian Cancer Association Consortium6 (online supplementary table 1). For the overall PRS, we used the log OR estimates for developing overall EOC; for the serous PRS, we used the log OR estimates for serous EOC. For women with missing SNP genotypes (due to genotyping failures), we used the mean genotypes in controls and cases for each SNP separately.
Logistic regression was used to examine the association between the PRS and outcome. When investigating the overall PRS, the outcome (cases) was all invasive EOC (any histotype). When investigating the PRS for serous EOC, the outcome was serous EOC only. In each case, the PRS was treated as either a continuous or a categorical variable. The PRS was standardised by subtracting the mean in controls and dividing by the standard deviation (SD) in controls. When used as a categorical predictor, the PRS was grouped into the percentiles: [0,5%), [5%,10%), [10%,20%), [20%,40%), [40%,60%), [60%,80%), [80%,90%), [90%,95%) and [95%,100%] on the basis of the PRS distribution in controls with [0,5%) as the lowest 5% PRS group and [95%,100%] as the highest. The middle [40%,60%) group was used as the reference category. The observed ORs by PRS percentiles were compared with the theoretical OR predictions under a multiplicative polygenic model of inheritance.11
Additional analyses were performed by adjusting for age and family history of EOC. Age was considered to be the age at EOC diagnosis for cases and at the age at last follow-up or age at the first non-EOC cancer (whichever occurred first) for controls. Two separate family history variables were constructed indicating (1) the number of relatives diagnosed with EOC in first-degree relatives and (2) indicating the number of affected relatives in both first-degree and second-degree relatives. We performed separate analyses adjusting for each of the two family history variables. Family history information was available at the baseline questionnaire. The discriminatory power of the PRS was assessed by the C-statistic using R package ‘pROC’. All statistical tests were two-tailed, and the significance threshold was set at 0.05.
The age-specific absolute risks of developing EOC by PRS percentiles were calculated by considering the OC incidence by PRS percentile and competing causes of mortality (other than EOC). We used data on EOC incidences and mortality rates were from the UK during 2012–2014.1 12 The OC risks by PRS percentiles were calculated as
| (2) |
where is the OC incidence associated with PRS at age t, is the PRS-specific survival function of being OC free at age t and is the survival function at age t calculated on the basis of incidences of death from causes other than OC. To calculate the OC incidence for each PRS percentile, we assumed that the average, age-specific OC incidences, over all PRS percentiles, agreed with the population OC incidences and calculated the PRS-specific incidence recursively. Details of these methods have been described elsewhere.11 13 14
Results
Data on 1428 controls and 750 EOC cases were included in the overall PRS analysis. Data on the same 1428 controls and 489 serous EOC cases (including 417 high-grade serous) were included in the serous PRS association analysis. Table 1 summarises the study characteristics and provides a breakdown by histology subtype. A summary of the SNPs included the PRS is shown in online supplementary table 1.
Table 1.
A summary of epidemiological characteristics of the subjects included in the nested case–control study
| Controls | Cases | P_difference* | |
| Women (n) | 1428 | 750 | |
| Age at baseline (%) | 0.70 | ||
| <60 | 496 (34.7%) | 256 (34.1%) | |
| 60–69 | 701 (49.1%) | 381 (50.8%) | |
| ≥70 | 231 (16.2%) | 113 (15.1%) | |
| Age at censoring (%) | <0.0001 | ||
| <60 | 50 (3.5%) | 107 (14.3%) | |
| 60–69 | 388 (27.2%) | 354 (47.2%) | |
| 70–79 | 681 (47.7%) | 275 (36.7%) | |
| ≥80 | 309 (21.6%) | 14 (1.9%) | |
| Birth cohort (%) | 0.76 | ||
| <1930 | 28 (2.0%) | 10 (1.3%) | |
| 1930–1939 | 639 (44.7%) | 339 (45.2%) | |
| 1940–1949 | 669 (46.8%) | 354 (47.2%) | |
| ≥1950 | 92 (6.4%) | 47 (6.3%) | |
| Mean age at baseline (SD) | 63 (6.2) | 63 (6.2) | |
| Mean censored age (SD) | 74 (7.1) | 68 (6.6) | |
| Mean PRS (SD) | |||
| Overall | −0.47 (0.27) | −0.39 (0.27) | |
| Serous | −0.55 (0.35) | −0.43 (0.36) | |
| Family history of ovarian cancer (%) | |||
| Considering only first-degree relatives | 0.088 | ||
| Zero affected relatives | 1387 (97.1%) | 718 (95.7%) | |
| One affected relative | 41 (2.9%) | 32 (4.3%) | |
| Considering both first-degree and second- degree relatives | 0.15 | ||
| Zero affected relatives | 1356 (95.0%) | 701 (93.5%) | |
| One or more affected relatives | 72 (5.0%) | 49 (6.5%) | |
| Morphology/histotype (%) | |||
| Serous | 489 (65.2%) | ||
| High grade | 417 (55.6%) | ||
| Low grade | 23 (3.1%) | ||
| Missing | 49 (6.5%) | ||
| Clear cell | 29 (3.9%) | ||
| Endometrioid | 56 (7.5%) | ||
| Mucinous | 24 (3.2%) | ||
| Others | 152 (20.3%) | ||
*χ2 tests for differences in the distributions between cases and controls.
Pairwise SNP*SNP interaction analysis
A total of 105 pairwise SNP*SNP interaction tests were performed but there was no significant evidence of interaction between any SNP pairs after a Bonferroni adjustment. The plot of observed against expected −log10p values did not show a significant departure from the expected values under the null hypothesis of no interaction (figure 1).
Figure 1.
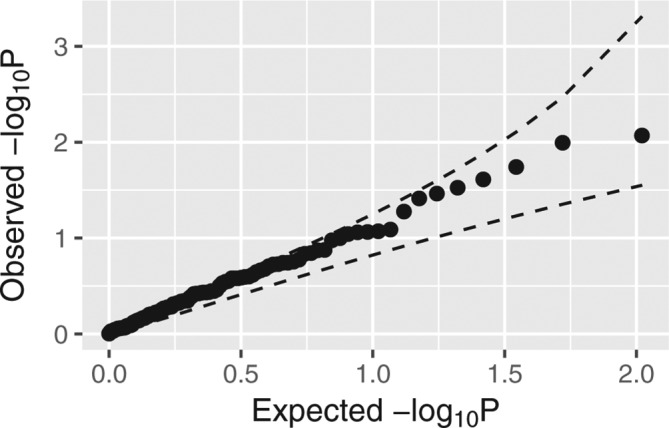
Quantile–quantile plot shows the observed against expected −log10p values of pairwise SNP*SNP interaction tests under the null hypothesis of multiplicative model. The dashed line shows the 95% concentration band.
Association between PRS and ovarian cancer
Figure 2A shows that the PRS follows a nearly normal distribution in both controls and cases where the mean of cases was right shifted by 0.28 for the overall standardised PRS and 0.37 for the serous standardised PRS. There was a significant association between the overall PRS and overall EOC in the nested case–control study and the association was stronger between the serous PRS and serous EOC. The OR per unit SD was estimated to be 1.32 (95% CI 1.21 to 1.45, p=5.38 × 10⁻¹⁰) for the overall PRS and 1.43 (95% CI 1.29 to 1.58, p=1.28 × 10⁻¹¹) for the serous PRS (table 2).
Figure 2.

(A) Distribution of the standardised overall and serous polygenic risk scores (PRSs) in overall and serous ovarian cancer cases and controls. The dashed vertical lines show the PRS means. (B) OR estimates between overall/serous PRS percentiles and overall/serous ovarian cancer risk relative to the middle PRS quintile (40%–60%). The solid line shows the estimated ORs with 95% CI, and the dashed line represents the theoretical OR values assuming multiplicative model.
Table 2.
Association between polygenic risk scores (PRS) and ovarian cancer in different age groups
| Age group | Overall | Serous | ||
| OR (95% CI) | P values | OR (95% CI) | P values | |
| All ages | 1.32 (1.21 to 1.45) | 5.38×10⁻¹⁰ | 1.43 (1.29 to 1.58) | 1.28×10⁻¹¹ |
| <60 | 1.29 (0.91 to 1.86) | 0.16 | 1.46 (1.01 to 2.17) | 0.05 |
| 60–69 | 1.28 (1.11 to 1.49) | 8.99×10⁻⁴ | 1.34 (1.14 to 1.59) | 4.51×10⁻⁴ |
| ≥70 | 1.36 (1.20 to 1.55) | 3.02×10⁻⁶ | 1.47 (1.26 to 1.72) | 7.10×10⁻⁷ |
| Interaction | 1.00 (0.99 to 1.02) | 0.88 | 1.00 (0.98 to 1.02) | 0.95 |
In the overall PRS analysis, we used cases of any type of ovarian cancers and in the serous PRS analysis we used cases of serous ovarian cancer.
The associations between the overall PRS and overall EOC, and between the serous PRS and serous EOC, stratified by age are shown in table 2. No significant interaction between age and EOC was observed in either the overall or the serous group (table 2). Discrimination as measured by the C-statistic was equal to 0.58 (95% CI 0.55 to 0.60) for the overall PRS and 0.60 (95% CI 0.57 to 0.63) for the serous PRS.
The estimated ORs by percentiles of PRS compared with the middle quintile ([40%,60%)) are shown in figure 2B. The ORs increased with increasing PRS percentiles for both the overall and the serous PRS. In the overall group, the OR for developing EOC for women in the lowest overall PRS percentile ([0,5%)) was estimated to be 0.53 (95% CI 0.30 to 0.89) and the OR for those in the highest overall PRS percentile ([95%,100%]) was 1.77 (95% CI 1.20 to 2.61) compared with the women in the middle overall PRS quintile. In the serous group, the OR for developing serous EOC was estimated to be 0.51 (95% CI 0.25 to 0.94) for women in the lowest serous PRS percentile ([0,5%)) and 2.16 (95% CI 1.40 to 3.30) for women in the highest serous PRS percentile ([95%,100%]) compared with the women in the middle serous PRS quintile (table 3). The family history of OC alone did not show significant association with EOC risk (OR for family history in first-degree relatives=1.51, 95% CI 0.94 to 2.41; OR for family history in first-degree and second-degree relatives=1.32, 95% CI 0.90 to 1.91). After adjusting by family history of OC, the OR estimates of PRS percentiles remained similar (table 3) but there was some attenuation in the effect of family history in first-degree and second-degree relatives of 3% on the log-scale. The observed distribution of the OR estimates was in line with the ORs theoretical-predicted values under the assumption that all SNPs interact multiplicatively (figure 2B) with all 95% CI for the observed OR estimates containing the theoretical estimates.
Table 3.
Association between polygenic risk scores (PRS) percentiles and ovarian cancer risk: unadjusted and adjusted by family history of ovarian cancer (FH) in first-degree or in first-degree and second-degree relatives
| PRS percentile category (%) | Controls (n) | Cases (n) | OR (95% CI) | ||
| Unadjusted by FH | Adjusted by first-degree FH | Adjusted by first-degree and second-degree FH | |||
| (a) Overall | |||||
| [0,5) | 72 | 20 | 0.53 (0.30 to 0.89) | 0.53 (0.31 to 0.89) | 0.54 (0.31 to 0.90) |
| [5,10) | 71 | 17 | 0.46 (0.25 to 0.79) | 0.46 (0.25 to 0.79) | 0.46 (0.25 to 0.79) |
| [10,20) | 143 | 47 | 0.63 (0.42 to 0.92) | 0.63 (0.43 to 0.92) | 0.63 (0.43 to 0.92) |
| [20,40) | 285 | 137 | 0.92 (0.69 to 1.22) | 0.92 (0.70 to 1.23) | 0.93 (0.70 to 1.23) |
| [40,60) | 286 | 150 | 1 | 1 | 1 |
| [60,80) | 285 | 159 | 1.06 (0.81 to 1.40) | 1.07 (0.81 to 1.42) | 1.07 (0.81 to 1.41) |
| [80,90) | 143 | 102 | 1.36 (0.99 to 1.88) | 1.37 (0.99 to 1.89) | 1.37 (1.00 to 1.90) |
| [90,95) | 71 | 51 | 1.37 (0.91 to 2.06) | 1.37 (0.91 to 2.06) | 1.37 (0.90 to 2.06) |
| [95,100] | 72 | 67 | 1.77 (1.20 to 2.61) | 1.79 (1.21 to 2.64) | 1.78 (1.21 to 2.62) |
| FH | 1.52 (0.94 to 2.44) | 1.28 (0.88 to 1.87) | |||
| (b) Serous | |||||
| [0,5) | 72 | 12 | 0.51 (0.25 to 0.94) | 0.51 (0.25 to 0.94) | 0.51 (0.25 to 0.95) |
| [5,10) | 71 | 10 | 0.43 (0.20 to 0.83) | 0.43 (0.20 to 0.82) | 0.43 (0.20 to 0.83) |
| [10,20) | 141 | 33 | 0.71 (0.45 to 1.10) | 0.72 (0.46 to 1.11) | 0.72 (0.45 to 1.11) |
| [20,40) | 287 | 78 | 0.83 (0.59 to 1.16) | 0.83 (0.59 to 1.17) | 0.83 (0.59 to 1.17) |
| [40,60) | 286 | 94 | 1 | 1 | 1 |
| [60,80) | 285 | 102 | 1.09 (0.79 to 1.51) | 1.09 (0.79 to 1.51) | 1.09 (0.79 to 1.51) |
| [80,90) | 143 | 68 | 1.45 (1.00 to 2.10) | 1.45 (1.00 to 2.10) | 1.45 (1.00 to 2.10) |
| [90,95) | 71 | 41 | 1.76 (1.12 to 2.75) | 1.77 (1.13 to 2.77) | 1.77 (1.12 to 2.77) |
| [95,100] | 72 | 51 | 2.16 (1.40 to 3.30) | 2.15 (1.40 to 3.30) | 2.14 (1.39 to 3.28) |
| FH | 1.54 (0.88 to 2.63) | 1.36 (0.88 to 2.08) | |||
Absolute risk of developing OC by PRS percentiles
Figure 3 shows the predicted age-specific absolute risk of developing overall EOC by different PRS percentile categories. By age 80, the risks of developing EOC for women in the highest and lowest 5% of the PRS are predicted to be 2.9% and 0.9%, respectively.
Figure 3.

Absolute risk of developing overall ovarian cancers by overall polygenic risk score (PRS) percentiles.
Discussion
Prior to incorporating the effects of common genetic variants into risk prediction models, it is important to calibrate the magnitude of their associations in studies which are independent of the original GWAS. This is the first prospective cohort study to evaluate the combined effects of GWAS identified common SNPs on EOC risk. We used data from a cohort of women in which women with known strong family history of OC or with known high-risk mutations were excluded. Therefore, the results are more applicable to women at ‘low risk’ of developing OC. Our results show that SNPs combine multiplicatively on EOC risk and that the PRS predicts EOC risk prospectively. There was a stronger association with the serous EOC for predicting the risk of serous EOC. This was expected as most of the SNPs used in the PRS construction showed stronger associations with serous EOC in the published GWAS. The empirical OR estimates for EOC associated with different percentiles of the PRS were in line with the theoretical expected values under the multiplicative model, suggesting the PRS is calibrated at the extremes of the distribution, although the OR estimates are associated with wide CIs. There was 3.4-fold difference in the risk of EOC between women at the 5th and 95th percentiles of the PRS. However, the discriminatory ability of the ‘PRS alone’ is modest with an area under the receiver-operating characteristic curve of 0.58–0.60 (based on 1428 controls, 750 overall OC cases, 489 serous OC cases).
There was no evidence of an interaction between the PRS and age in our study, suggesting that the relative effect of the PRS remains constant with age. Little changes were observed in the OR estimates associated with the PRS after adjusting for family history of OC (table 3). Overall, family history of OC was not significantly associated with EOC risk in the present study, but this could be a consequence of the study design. One of the eligibility criteria for inclusion in the UKCTOCS trial was that women had to be at low risk of familial OC; therefore, the overall cohort is ‘biased’ towards women without significant family history of OC. However, the reduction in the effect size for family history after adjusting for the PRS is consistent with the predicted contribution of the SNPs to the familial risk of OC. To assess the effect of family history on OC accurately and the possible attenuation in the family history association after taking into account the PRS, larger studies with more representative samples of women from the population (with respect to family history) would be required.
The current estimate of lifetime EOC risk in the UK general population is 1.86% based on 2014 data. Our results show that using the PRS alone results in a cumulative EOC risk by age 80 of 2.92% for women in the highest 5% of the overall PRS percentiles and 0.88% for women in the lowest 5% of the PRS. Although such differences alone may not lead to changes in the clinical management of women (eg, use of risk-reducing treatments such as salpingo-oophorectomy), the PRS in combination with other established risk factors for EOC such as family history, other known rare genetic susceptibility variants and epidemiological risk factors (eg, OCP use, parity, endometriosis, tubal ligation) is likely to improve EOC risk stratification and help stratify the women in different risk categories.3 15 16 For example, under Jervis et al’s model,3 the risk of developing EOC by age 80 for a woman at the highest 5% of the observed PRS is 6.6% if she has a mother diagnosed with EOC at age 50. Furthermore, by combining all risk factors together, it has been demonstrated that there is a gradient of lifetime risk in unselected populations which ranges from 0.35% to 8.78%.17 Although the present study is limited by the inclusion of women with no significant family history of OC, the findings are relevant to tailoring screening efforts in the future. In addition, these PRS can result in clinically significant differences in risk when used in combination with mutations in moderate penetrance genes such as RAD51C, RAD51D and BRIP1.16 Hence, risk modelling incorporating a combination of PRS, other rare genetic susceptibility variants, family history and epidemiological factors may enable population risk stratification to identify individuals who will benefit from targeted interventions. For example, risk-reducing salpingo-oophorectomy has been suggested to be cost-effective at >4%–5% lifetime risk of OC.18 19 This may provide clinical utility for undertaking surgical prevention above these levels of risk. A change in guidelines to enable women at above these risk thresholds to benefit from surgical prevention has been advocated.20
The present study has also several limitations. Some of the study participants had been diagnosed with another cancer prior to their recruitment into the study. These women were included in the analysis (52 incident cases, 111 controls) in line with previous GWAS. After excluding the women with a history of cancer, the results remain similar and the conclusions were not influenced by these assumptions (online supplementary tables 2–4 and supplementary figure 2–5). Although the UKCTOCS study was not included in the recent GWAS,6 since this is a national study, it is possible that some incidental overlaps may exist with samples included in the Phelan et al study,6 if study participants enrolled independently in other studies. On further investigation by the coordinating centre, 34 incident OC cases and 5 of the controls in the study were also included in one of the case–control studies included in Phelan et al.6 After excluding the overlapping individuals the results remained virtually identical (data not shown). Another limitation is that the majority of the women were eligible to participate in the UKCTOCS study if they did not have family history of OC. Therefore, we were not able to obtain an unbiased estimates of the effect of family history. In the present study, the OR estimate associated with family history of OC is substantially lower compared with studies of familial risks of OC,3 but this is expected under the present design. A possible further implication of the present study design (ie, women selected for no family history) is a possible attenuation of the effect of the PRS due to the fact that common variants are expected to be confounded with family history of OC. However, the OR estimates for different percentiles of the PRS were in line with those expected under a multiplicative model, suggesting that this is unlikely to result in a substantial bias in the PRS associations. We note that although the multiplicative model assumption is further supported by the fact that no SNP*SNP interactions were detected, the current study is underpowered to investigate pairwise interactions of modest effects (online supplementary table 5). Larger studies will have to investigate this. The sample size is also limited for assessing the associations of the PRS with different histotypes, other than serous EOC. Although GWAS have demonstrated associations between SNPs and other EOC histotypes, the number of endometrioid, clear cell and mucinous cancers were too small and the PRS did not show evidence associations with these histotypes (online supplementary table 6). Additionally, the latest GWAS has identified many more common SNPs (~30) associated with EOC which were estimated to account for 6.4% of the polygenic risk in the population.6 The 15 SNPs included in the PRS and evaluated in the present study explained only 3.4% of the polygenic risk. Therefore, further improvement could be achieved by incorporating these additional SNPs into the PRS or by constructing PRS which include both genomewide significant SNPs and SNPs with higher p values of association using penalised regression models.21–23
In conclusion, this paper is the first evaluation of the association of the PRS with EOC in a prospective general population cohort. It demonstrates that the PRS based on published SNP effect sizes is well calibrated and the PRS is a strong risk factor for EOC that contributes towards the discrimination of women who will develop EOC. It will be necessary to incorporate the PRS in comprehensive OC risk prediction models together with other risk factors for the disease and assess the improvement in risk prediction in prospective studies. Such comprehensive risk models will facilitate the clinical decision-making and health management for at-risk women and provide more personalised risk management.
Acknowledgments
The authors are particularly grateful to the women throughout the UK who are participating in the trial and to the centre leads and the entire medical, nursing and administrative staff who work on the UKCTOCS.
Footnotes
Contributors: XY and ACA performed the data analysis and drafted the manuscript. ACA, AG-M, UM and IJ conceived and designed the study. GL, AG-M and AR were involved in the data processing and data management. MI, SAG and SJR performed the genotyping. AG-M, AR, JKK, IJ and UM are coordinating the UKCTOCS study (PIs: IJ, UM). AL, JT, FG, RM and PDPP contributed to the analytical design and/or interpretation of data. All authors critically reviewed the manuscript.
Funding: This work has been supported by grants from Cancer Research UK (C12292/A20861, C1005/A12677) including the PROMISE research programme and the Eve Appeal. UKCTOCS was core funded by the Medical Research Council, Cancer Research UK (C1005/A12677), and the Department of Health with additional support from the Eve Appeal, Special Trustees of Bart’s and the London, and Special Trustees of UCLH and supported by researchers at the National Institute for Health Research University College London Hospitals Biomedical Research Centre.
Disclaimer: The funding source or the sponsor had no role in data collection, data analysis, data interpretation or writing of the report. The researchers are independent from the funders.
Competing interests: UM and IJ have a financial interest through Abcodia Ltd in the third party exploitation of the trial biobank.
Patient consent: Not required.
Ethics approval: UKCTOCS was approved by the UK North West Multicentre Research Ethics Committees (North West MREC 00/8/34) on 21 June 2000 with site-specific approval from the local regional ethics committees and the Caldicott guardians (data controllers) of the primary care trusts. The SNP protocol was approved by NRES Committee North West – Liverpool Central (14/NW1026) in June 2014.
Provenance and peer review: Not commissioned; externally peer reviewed.
Data sharing statement: Requests for access to data should be addressed for consideration to the UKCTOCS PI UM.
References
- 1. Cancer Research UK. Let’s beat cancer sooner. https://www.cancerresearchuk.org/ (acessed 18 Jan 2018).
- 2. Baldwin LA, Huang B, Miller RW, Tucker T, Goodrich ST, Podzielinski I, DeSimone CP, Ueland FR, van Nagell JR, Seamon LG. Ten-year relative survival for epithelial ovarian cancer. Obstet Gynecol 2012;120:612–8. 10.1097/AOG.0b013e318264f794 [DOI] [PubMed] [Google Scholar]
- 3. Jervis S, Song H, Lee A, Dicks E, Harrington P, Baynes C, Manchanda R, Easton DF, Jacobs I, Pharoah PP, Antoniou AC. A risk prediction algorithm for ovarian cancer incorporating BRCA1, BRCA2, common alleles and other familial effects. J Med Genet 2015;52:465–75. 10.1136/jmedgenet-2015-103077 [DOI] [PMC free article] [PubMed] [Google Scholar]
- 4. Bahcall O. Common variation and heritability estimates for breast, ovarian and prostate cancers. http://www.nature.com/icogs/primer/common-variation-and-heritability-estimates-for-breast-ovarian-and-prostate-cancers/ (acessed 18 Jan 2018).
- 5. Kuchenbaecker KB, Ramus SJ, Tyrer J, Lee A, Shen HC, Beesley J, Lawrenson K, McGuffog L, Healey S, Lee JM, Spindler TJ, Lin YG, Pejovic T, Bean Y, Li Q, Coetzee S, Hazelett D, Miron A, Southey M, Terry MB, Goldgar DE, Buys SS, Janavicius R, Dorfling CM, van Rensburg EJ, Neuhausen SL, Ding YC, Hansen TV, Jønson L, Gerdes AM, Ejlertsen B, Barrowdale D, Dennis J, Benitez J, Osorio A, Garcia MJ, Komenaka I, Weitzel JN, Ganschow P, Peterlongo P, Bernard L, Viel A, Bonanni B, Peissel B, Manoukian S, Radice P, Papi L, Ottini L, Fostira F, Konstantopoulou I, Garber J, Frost D, Perkins J, Platte R, Ellis S, Godwin AK, Schmutzler RK, Meindl A, Engel C, Sutter C, Sinilnikova OM, Damiola F, Mazoyer S, Stoppa-Lyonnet D, Claes K, De Leeneer K, Kirk J, Rodriguez GC, Piedmonte M, O’Malley DM, de la Hoya M, Caldes T, Aittomäki K, Nevanlinna H, Collée JM, Rookus MA, Oosterwijk JC, Tihomirova L, Tung N, Hamann U, Isaccs C, Tischkowitz M, Imyanitov EN, Caligo MA, Campbell IG, Hogervorst FB, Olah E, Diez O, Blanco I, Brunet J, Lazaro C, Pujana MA, Jakubowska A, Gronwald J, Lubinski J, Sukiennicki G, Barkardottir RB, Plante M, Simard J, Soucy P, Montagna M, Tognazzo S, Teixeira MR, Pankratz VS, Wang X, Lindor N, Szabo CI, Kauff N, Vijai J, Aghajanian CA, Pfeiler G, Berger A, Singer CF, Tea MK, Phelan CM, Greene MH, Mai PL, Rennert G, Mulligan AM, Tchatchou S, Andrulis IL, Glendon G, Toland AE, Jensen UB, Kruse TA, Thomassen M, Bojesen A, Zidan J, Friedman E, Laitman Y, Soller M, Liljegren A, Arver B, Einbeigi Z, Stenmark-Askmalm M, Olopade OI, Nussbaum RL, Rebbeck TR, Nathanson KL, Domchek SM, Lu KH, Karlan BY, Walsh C, Lester J, Hein A, Ekici AB, Beckmann MW, Fasching PA, Lambrechts D, Van Nieuwenhuysen E, Vergote I, Lambrechts S, Dicks E, Doherty JA, Wicklund KG, Rossing MA, Rudolph A, Chang-Claude J, Wang-Gohrke S, Eilber U, Moysich KB, Odunsi K, Sucheston L, Lele S, Wilkens LR, Goodman MT, Thompson PJ, Shvetsov YB, Runnebaum IB, Dürst M, Hillemanns P, Dörk T, Antonenkova N, Bogdanova N, Leminen A, Pelttari LM, Butzow R, Modugno F, Kelley JL, Edwards RP, Ness RB, du Bois A, Heitz F, Schwaab I, Harter P, Matsuo K, Hosono S, Orsulic S, Jensen A, Kjaer SK, Hogdall E, Hasmad HN, Azmi MA, Teo SH, Woo YL, Fridley BL, Goode EL, Cunningham JM, Vierkant RA, Bruinsma F, Giles GG, Liang D, Hildebrandt MA, Wu X, Levine DA, Bisogna M, Berchuck A, Iversen ES, Schildkraut JM, Concannon P, Weber RP, Cramer DW, Terry KL, Poole EM, Tworoger SS, Bandera EV, Orlow I, Olson SH, Krakstad C, Salvesen HB, Tangen IL, Bjorge L, van Altena AM, Aben KK, Kiemeney LA, Massuger LF, Kellar M, Brooks-Wilson A, Kelemen LE, Cook LS, Le ND, Cybulski C, Yang H, Lissowska J, Brinton LA, Wentzensen N, Hogdall C, Lundvall L, Nedergaard L, Baker H, Song H, Eccles D, McNeish I, Paul J, Carty K, Siddiqui N, Glasspool R, Whittemore AS, Rothstein JH, McGuire V, Sieh W, Ji BT, Zheng W, Shu XO, Gao YT, Rosen B, Risch HA, McLaughlin JR, Narod SA, Monteiro AN, Chen A, Lin HY, Permuth-Wey J, Sellers TA, Tsai YY, Chen Z, Ziogas A, Anton-Culver H, Gentry-Maharaj A, Menon U, Harrington P, Lee AW, Wu AH, Pearce CL, Coetzee G, Pike MC, Dansonka-Mieszkowska A, Timorek A, Rzepecka IK, Kupryjanczyk J, Freedman M, Noushmehr H, Easton DF, Offit K, Couch FJ, Gayther S, Pharoah PP, Antoniou AC, Chenevix-Trench G. EMBRACE GEMO Study Collaborators Breast Cancer Family Registry HEBON KConFab Investigators Australian Cancer Study (Ovarian Cancer Investigators) Australian Ovarian Cancer Study Group Consortium of Investigators of Modifiers of BRCA1 and BRCA2. Identification of six new susceptibility loci for invasive epithelial ovarian cancer. Nat Genet 2015;47:164–71. 10.1038/ng.3185 [DOI] [PMC free article] [PubMed] [Google Scholar]
- 6. Phelan CM, Kuchenbaecker KB, Tyrer JP, Kar SP, Lawrenson K, Winham SJ, Dennis J, Pirie A, Riggan MJ, Chornokur G, Earp MA, Lyra PC, Lee JM, Coetzee S, Beesley J, McGuffog L, Soucy P, Dicks E, Lee A, Barrowdale D, Lecarpentier J, Leslie G, Aalfs CM, Aben KKH, Adams M, Adlard J, Andrulis IL, Anton-Culver H, Antonenkova N, Aravantinos G, Arnold N, Arun BK, Arver B, Azzollini J, Balmaña J, Banerjee SN, Barjhoux L, Barkardottir RB, Bean Y, Beckmann MW, Beeghly-Fadiel A, Benitez J, Bermisheva M, Bernardini MQ, Birrer MJ, Bjorge L, Black A, Blankstein K, Blok MJ, Bodelon C, Bogdanova N, Bojesen A, Bonanni B, Borg Å, Bradbury AR, Brenton JD, Brewer C, Brinton L, Broberg P, Brooks-Wilson A, Bruinsma F, Brunet J, Buecher B, Butzow R, Buys SS, Caldes T, Caligo MA, Campbell I, Cannioto R, Carney ME, Cescon T, Chan SB, Chang-Claude J, Chanock S, Chen XQ, Chiew YE, Chiquette J, Chung WK, Claes KBM, Conner T, Cook LS, Cook J, Cramer DW, Cunningham JM, D’Aloisio AA, Daly MB, Damiola F, Damirovna SD, Dansonka-Mieszkowska A, Dao F, Davidson R, DeFazio A, Delnatte C, Doheny KF, Diez O, Ding YC, Doherty JA, Domchek SM, Dorfling CM, Dörk T, Dossus L, Duran M, Dürst M, Dworniczak B, Eccles D, Edwards T, Eeles R, Eilber U, Ejlertsen B, Ekici AB, Ellis S, Elvira M, Eng KH, Engel C, Evans DG, Fasching PA, Ferguson S, Ferrer SF, Flanagan JM, Fogarty ZC, Fortner RT, Fostira F, Foulkes WD, Fountzilas G, Fridley BL, Friebel TM, Friedman E, Frost D, Ganz PA, Garber J, García MJ, Garcia-Barberan V, Gehrig A, Gentry-Maharaj A, Gerdes AM, Giles GG, Glasspool R, Glendon G, Godwin AK, Goldgar DE, Goranova T, Gore M, Greene MH, Gronwald J, Gruber S, Hahnen E, Haiman CA, Håkansson N, Hamann U, Hansen TVO, Harrington PA, Harris HR, Hauke J, Hein A, Henderson A, Hildebrandt MAT, Hillemanns P, Hodgson S, Høgdall CK, Høgdall E, Hogervorst FBL, Holland H, Hooning MJ, Hosking K, Huang RY, Hulick PJ, Hung J, Hunter DJ, Huntsman DG, Huzarski T, Imyanitov EN, Isaacs C, Iversen ES, Izatt L, Izquierdo A, Jakubowska A, James P, Janavicius R, Jernetz M, Jensen A, Jensen UB, John EM, Johnatty S, Jones ME, Kannisto P, Karlan BY, Karnezis A, Kast K, Kennedy CJ, Khusnutdinova E, Kiemeney LA, Kiiski JI, Kim SW, Kjaer SK, Köbel M, Kopperud RK, Kruse TA, Kupryjanczyk J, Kwong A, Laitman Y, Lambrechts D, Larrañaga N, Larson MC, Lazaro C, Le ND, Le Marchand L, Lee JW, Lele SB, Leminen A, Leroux D, Lester J, Lesueur F, Levine DA, Liang D, Liebrich C, Lilyquist J, Lipworth L, Lissowska J, Lu KH, Lubinński J, Luccarini C, Lundvall L, Mai PL, Mendoza-Fandiño G, Manoukian S, Massuger L, May T, Mazoyer S, McAlpine JN, McGuire V, McLaughlin JR, McNeish I, Meijers-Heijboer H, Meindl A, Menon U, Mensenkamp AR, Merritt MA, Milne RL, Mitchell G, Modugno F, Moes-Sosnowska J, Moffitt M, Montagna M, Moysich KB, Mulligan AM, Musinsky J, Nathanson KL, Nedergaard L, Ness RB, Neuhausen SL, Nevanlinna H, Niederacher D, Nussbaum RL, Odunsi K, Olah E, Olopade OI, Olsson H, Olswold C, O’Malley DM, Ong KR, Onland-Moret NC, Orr N, Orsulic S, Osorio A, Palli D, Papi L, Park-Simon TW, Paul J, Pearce CL, Pedersen IS, Peeters PHM, Peissel B, Peixoto A, Pejovic T, Pelttari LM, Permuth JB, Peterlongo P, Pezzani L, Pfeiler G, Phillips KA, Piedmonte M, Pike MC, Piskorz AM, Poblete SR, Pocza T, Poole EM, Poppe B, Porteous ME, Prieur F, Prokofyeva D, Pugh E, Pujana MA, Pujol P, Radice P, Rantala J, Rappaport-Fuerhauser C, Rennert G, Rhiem K, Rice P, Richardson A, Robson M, Rodriguez GC, Rodríguez-Antona C, Romm J, Rookus MA, Rossing MA, Rothstein JH, Rudolph A, Runnebaum IB, Salvesen HB, Sandler DP, Schoemaker MJ, Senter L, Setiawan VW, Severi G, Sharma P, Shelford T, Siddiqui N, Side LE, Sieh W, Singer CF, Sobol H, Song H, Southey MC, Spurdle AB, Stadler Z, Steinemann D, Stoppa-Lyonnet D, Sucheston-Campbell LE, Sukiennicki G, Sutphen R, Sutter C, Swerdlow AJ, Szabo CI, Szafron L, Tan YY, Taylor JA, Tea MK, Teixeira MR, Teo SH, Terry KL, Thompson PJ, Thomsen LCV, Thull DL, Tihomirova L, Tinker AV, Tischkowitz M, Tognazzo S, Toland AE, Tone A, Trabert B, Travis RC, Trichopoulou A, Tung N, Tworoger SS, van Altena AM, Van Den Berg D, van der Hout AH, van der Luijt RB, Van Heetvelde M, Van Nieuwenhuysen E, van Rensburg EJ, Vanderstichele A, Varon-Mateeva R, Vega A, Edwards DV, Vergote I, Vierkant RA, Vijai J, Vratimos A, Walker L, Walsh C, Wand D, Wang-Gohrke S, Wappenschmidt B, Webb PM, Weinberg CR, Weitzel JN, Wentzensen N, Whittemore AS, Wijnen JT, Wilkens LR, Wolk A, Woo M, Wu X, Wu AH, Yang H, Yannoukakos D, Ziogas A, Zorn KK, Narod SA, Easton DF, Amos CI, Schildkraut JM, Ramus SJ, Ottini L, Goodman MT, Park SK, Kelemen LE, Risch HA, Thomassen M, Offit K, Simard J, Schmutzler RK, Hazelett D, Monteiro AN, Couch FJ, Berchuck A, Chenevix-Trench G, Goode EL, Sellers TA, Gayther SA, Antoniou AC, Pharoah PDP. AOCS study group EMBRACE Study GEMO Study Collaborators HEBON Study KConFab Investigators OPAL study group. Identification of 12 new susceptibility loci for different histotypes of epithelial ovarian cancer. Nat Genet 2017;49:680–91. 10.1038/ng.3826 [DOI] [PMC free article] [PubMed] [Google Scholar]
- 7. Kar SP, Beesley J, Amin Al Olama A, Michailidou K, Tyrer J, Kote-Jarai Z, Lawrenson K, Lindstrom S, Ramus SJ, Thompson DJ, Kibel AS, Dansonka-Mieszkowska A, Michael A, Dieffenbach AK, Gentry-Maharaj A, Whittemore AS, Wolk A, Monteiro A, Peixoto A, Kierzek A, Cox A, Rudolph A, Gonzalez-Neira A, Wu AH, Lindblom A, Swerdlow A, Ziogas A, Ekici AB, Burwinkel B, Karlan BY, Nordestgaard BG, Blomqvist C, Phelan C, McLean C, Pearce CL, Vachon C, Cybulski C, Slavov C, Stegmaier C, Maier C, Ambrosone CB, Høgdall CK, Teerlink CC, Kang D, Tessier DC, Schaid DJ, Stram DO, Cramer DW, Neal DE, Eccles D, Flesch-Janys D, Edwards DR, Wokozorczyk D, Levine DA, Yannoukakos D, Sawyer EJ, Bandera EV, Poole EM, Goode EL, Khusnutdinova E, Høgdall E, Song F, Bruinsma F, Heitz F, Modugno F, Hamdy FC, Wiklund F, Giles GG, Olsson H, Wildiers H, Ulmer HU, Pandha H, Risch HA, Darabi H, Salvesen HB, Nevanlinna H, Gronberg H, Brenner H, Brauch H, Anton-Culver H, Song H, Lim HY, McNeish I, Campbell I, Vergote I, Gronwald J, Lubiński J, Stanford JL, Benítez J, Doherty JA, Permuth JB, Chang-Claude J, Donovan JL, Dennis J, Schildkraut JM, Schleutker J, Hopper JL, Kupryjanczyk J, Park JY, Figueroa J, Clements JA, Knight JA, Peto J, Cunningham JM, Pow-Sang J, Batra J, Czene K, Lu KH, Herkommer K, Khaw KT, Matsuo K, Muir K, Offitt K, Chen K, Moysich KB, Aittomäki K, Odunsi K, Kiemeney LA, Massuger LF, Fitzgerald LM, Cook LS, Cannon-Albright L, Hooning MJ, Pike MC, Bolla MK, Luedeke M, Teixeira MR, Goodman MT, Schmidt MK, Riggan M, Aly M, Rossing MA, Beckmann MW, Moisse M, Sanderson M, Southey MC, Jones M, Lush M, Hildebrandt MA, Hou MF, Schoemaker MJ, Garcia-Closas M, Bogdanova N, Rahman N, Le ND, Orr N, Wentzensen N, Pashayan N, Peterlongo P, Guénel P, Brennan P, Paulo P, Webb PM, Broberg P, Fasching PA, Devilee P, Wang Q, Cai Q, Li Q, Kaneva R, Butzow R, Kopperud RK, Schmutzler RK, Stephenson RA, MacInnis RJ, Hoover RN, Winqvist R, Ness R, Milne RL, Travis RC, Benlloch S, Olson SH, McDonnell SK, Tworoger SS, Maia S, Berndt S, Lee SC, Teo SH, Thibodeau SN, Bojesen SE, Gapstur SM, Kjær SK, Pejovic T, Tammela TL, Dörk T, Brüning T, Wahlfors T, Key TJ, Edwards TL, Menon U, Hamann U, Mitev V, Kosma VM, Setiawan VW, Kristensen V, Arndt V, Vogel W, Zheng W, Sieh W, Blot WJ, Kluzniak W, Shu XO, Gao YT, Schumacher F, Freedman ML, Berchuck A, Dunning AM, Simard J, Haiman CA, Spurdle A, Sellers TA, Hunter DJ, Henderson BE, Kraft P, Chanock SJ, Couch FJ, Hall P, Gayther SA, Easton DF, Chenevix-Trench G, Eeles R, Pharoah PD, Lambrechts D. ABCTB Investigators AOCS Study Group & Australian Cancer Study (Ovarian Cancer) APCB BioResource kConFab Investigators NBCS Investigators GENICA Network PRACTICAL consortium. Genome-Wide Meta-Analyses of Breast, Ovarian, and Prostate Cancer Association Studies Identify Multiple New Susceptibility Loci Shared by at Least Two Cancer Types. Cancer Discov 2016;6:1052–67. 10.1158/2159-8290.CD-15-1227 [DOI] [PMC free article] [PubMed] [Google Scholar]
- 8. Jacobs IJ, Menon U, Ryan A, Gentry-Maharaj A, Burnell M, Kalsi JK, Amso NN, Apostolidou S, Benjamin E, Cruickshank D, Crump DN, Davies SK, Dawnay A, Dobbs S, Fletcher G, Ford J, Godfrey K, Gunu R, Habib M, Hallett R, Herod J, Jenkins H, Karpinskyj C, Leeson S, Lewis SJ, Liston WR, Lopes A, Mould T, Murdoch J, Oram D, Rabideau DJ, Reynolds K, Scott I, Seif MW, Sharma A, Singh N, Taylor J, Warburton F, Widschwendter M, Williamson K, Woolas R, Fallowfield L, McGuire AJ, Campbell S, Parmar M, Skates SJ. Ovarian cancer screening and mortality in the UK Collaborative Trial of Ovarian Cancer Screening (UKCTOCS): a randomised controlled trial. Lancet 2016;387:945–56. 10.1016/S0140-6736(15)01224-6 [DOI] [PMC free article] [PubMed] [Google Scholar]
- 9. Menon U, Gentry-Maharaj A, Ryan A, Sharma A, Burnell M, Hallett R, Lewis S, Lopez A, Godfrey K, Oram D, Herod J, Williamson K, Seif M, Scott I, Mould T, Woolas R, Murdoch J, Dobbs S, Amso N, Leeson S, Cruickshank D, McGuire A, Campbell S, Fallowfield L, Skates S, Parmar M, Jacobs I. Recruitment to multicentre trials--lessons from UKCTOCS: descriptive study. BMJ 2008;337:a2079 10.1136/bmj.a2079 [DOI] [PMC free article] [PubMed] [Google Scholar]
- 10. Menon U, Gentry-Maharaj A, Hallett R, Ryan A, Burnell M, Sharma A, Lewis S, Davies S, Philpott S, Lopes A, Godfrey K, Oram D, Herod J, Williamson K, Seif MW, Scott I, Mould T, Woolas R, Murdoch J, Dobbs S, Amso NN, Leeson S, Cruickshank D, Mcguire A, Campbell S, Fallowfield L, Singh N, Dawnay A, Skates SJ, Parmar M, Jacobs I. Sensitivity and specificity of multimodal and ultrasound screening for ovarian cancer, and stage distribution of detected cancers: results of the prevalence screen of the UK Collaborative Trial of Ovarian Cancer Screening (UKCTOCS). Lancet Oncol 2009;10:327–40. 10.1016/S1470-2045(09)70026-9 [DOI] [PubMed] [Google Scholar]
- 11. Mavaddat N, Pharoah PD, Michailidou K, Tyrer J, Brook MN, Bolla MK, Wang Q, Dennis J, Dunning AM, Shah M, Luben R, Brown J, Bojesen SE, Nordestgaard BG, Nielsen SF, Flyger H, Czene K, Darabi H, Eriksson M, Peto J, Dos-Santos-Silva I, Dudbridge F, Johnson N, Schmidt MK, Broeks A, Verhoef S, Rutgers EJ, Swerdlow A, Ashworth A, Orr N, Schoemaker MJ, Figueroa J, Chanock SJ, Brinton L, Lissowska J, Couch FJ, Olson JE, Vachon C, Pankratz VS, Lambrechts D, Wildiers H, Van Ongeval C, van Limbergen E, Kristensen V, Grenaker Alnæs G, Nord S, Borresen-Dale AL, Nevanlinna H, Muranen TA, Aittomäki K, Blomqvist C, Chang-Claude J, Rudolph A, Seibold P, Flesch-Janys D, Fasching PA, Haeberle L, Ekici AB, Beckmann MW, Burwinkel B, Marme F, Schneeweiss A, Sohn C, Trentham-Dietz A, Newcomb P, Titus L, Egan KM, Hunter DJ, Lindstrom S, Tamimi RM, Kraft P, Rahman N, Turnbull C, Renwick A, Seal S, Li J, Liu J, Humphreys K, Benitez J, Pilar Zamora M, Arias Perez JI, Menéndez P, Jakubowska A, Lubinski J, Jaworska-Bieniek K, Durda K, Bogdanova NV, Antonenkova NN, Dörk T, Anton-Culver H, Neuhausen SL, Ziogas A, Bernstein L, Devilee P, Tollenaar RA, Seynaeve C, van Asperen CJ, Cox A, Cross SS, Reed MW, Khusnutdinova E, Bermisheva M, Prokofyeva D, Takhirova Z, Meindl A, Schmutzler RK, Sutter C, Yang R, Schürmann P, Bremer M, Christiansen H, Park-Simon TW, Hillemanns P, Guénel P, Truong T, Menegaux F, Sanchez M, Radice P, Peterlongo P, Manoukian S, Pensotti V, Hopper JL, Tsimiklis H, Apicella C, Southey MC, Brauch H, Brüning T, Ko YD, Sigurdson AJ, Doody MM, Hamann U, Torres D, Ulmer HU, Försti A, Sawyer EJ, Tomlinson I, Kerin MJ, Miller N, Andrulis IL, Knight JA, Glendon G, Marie Mulligan A, Chenevix-Trench G, Balleine R, Giles GG, Milne RL, McLean C, Lindblom A, Margolin S, Haiman CA, Henderson BE, Schumacher F, Le Marchand L, Eilber U, Wang-Gohrke S, Hooning MJ, Hollestelle A, van den Ouweland AM, Koppert LB, Carpenter J, Clarke C, Scott R, Mannermaa A, Kataja V, Kosma VM, Hartikainen JM, Brenner H, Arndt V, Stegmaier C, Karina Dieffenbach A, Winqvist R, Pylkäs K, Jukkola-Vuorinen A, Grip M, Offit K, Vijai J, Robson M, Rau-Murthy R, Dwek M, Swann R, Annie Perkins K, Goldberg MS, Labrèche F, Dumont M, Eccles DM, Tapper WJ, Rafiq S, John EM, Whittemore AS, Slager S, Yannoukakos D, Toland AE, Yao S, Zheng W, Halverson SL, González-Neira A, Pita G, Rosario Alonso M, Álvarez N, Herrero D, Tessier DC, Vincent D, Bacot F, Luccarini C, Baynes C, Ahmed S, Maranian M, Healey CS, Simard J, Hall P, Easton DF, Garcia-Closas M. Prediction of breast cancer risk based on profiling with common genetic variants. J Natl Cancer Inst 2015;107:djv036 10.1093/jnci/djv036 [DOI] [PMC free article] [PubMed] [Google Scholar]
- 12. Office for National Statistics. Headline news, figures and publications. https://www.ons.gov.uk/ (acessed 18 Jan 2018).
- 13. Amin Al Olama A, Benlloch S, Antoniou AC, Giles GG, Severi G, Neal DE, Hamdy FC, Donovan JL, Muir K, Schleutker J, Henderson BE, Haiman CA, Schumacher FR, Pashayan N, Pharoah PDP, Ostrander EA, Stanford JL, Batra J, Clements JA, Chambers SK, Weischer M, Nordestgaard BG, Ingles SA, Sorensen KD, Orntoft TF, Park JY, Cybulski C, Maier C, Doerk T, Dickinson JL, Cannon-Albright L, Brenner H, Rebbeck TR, Zeigler-Johnson C, Habuchi T, Thibodeau SN, Cooney KA, Chappuis PO, Hutter P, Kaneva RP, Foulkes WD, Zeegers MP, Lu Y-J, Zhang H-W, Stephenson R, Cox A, Southey MC, Spurdle AB, FitzGerald L, Leongamornlert D, Saunders E, Tymrakiewicz M, Guy M, Dadaev T, Little SJ, Govindasami K, Sawyer E, Wilkinson R, Herkommer K, Hopper JL, Lophatonanon A, Rinckleb AE, Kote-Jarai Z, Eeles RA, Easton DF. Risk Analysis of Prostate Cancer in PRACTICAL, a Multinational Consortium, Using 25 Known Prostate Cancer Susceptibility Loci. Cancer Epidemiology Biomarkers & Prevention 2015;24:1121–9. 10.1158/1055-9965.EPI-14-0317 [DOI] [PMC free article] [PubMed] [Google Scholar]
- 14. Antoniou AC, Beesley J, McGuffog L, Sinilnikova OM, Healey S, Neuhausen SL, Ding YC, Rebbeck TR, Weitzel JN, Lynch HT, Isaacs C, Ganz PA, Tomlinson G, Olopade OI, Couch FJ, Wang X, Lindor NM, Pankratz VS, Radice P, Manoukian S, Peissel B, Zaffaroni D, Barile M, Viel A, Allavena A, Dall’Olio V, Peterlongo P, Szabo CI, Zikan M, Claes K, Poppe B, Foretova L, Mai PL, Greene MH, Rennert G, Lejbkowicz F, Glendon G, Ozcelik H, Andrulis IL, Thomassen M, Gerdes AM, Sunde L, Cruger D, Birk Jensen U, Caligo M, Friedman E, Kaufman B, Laitman Y, Milgrom R, Dubrovsky M, Cohen S, Borg A, Jernström H, Lindblom A, Rantala J, Stenmark-Askmalm M, Melin B, Nathanson K, Domchek S, Jakubowska A, Lubinski J, Huzarski T, Osorio A, Lasa A, Durán M, Tejada MI, Godino J, Benitez J, Hamann U, Kriege M, Hoogerbrugge N, van der Luijt RB, van Asperen CJ, Devilee P, Meijers-Heijboer EJ, Blok MJ, Aalfs CM, Hogervorst F, Rookus M, Cook M, Oliver C, Frost D, Conroy D, Evans DG, Lalloo F, Pichert G, Davidson R, Cole T, Cook J, Paterson J, Hodgson S, Morrison PJ, Porteous ME, Walker L, Kennedy MJ, Dorkins H, Peock S, Godwin AK, Stoppa-Lyonnet D, de Pauw A, Mazoyer S, Bonadona V, Lasset C, Dreyfus H, Leroux D, Hardouin A, Berthet P, Faivre L, Loustalot C, Noguchi T, Sobol H, Rouleau E, Nogues C, Frénay M, Vénat-Bouvet L, Hopper JL, Daly MB, Terry MB, John EM, Buys SS, Yassin Y, Miron A, Goldgar D, Singer CF, Dressler AC, Gschwantler-Kaulich D, Pfeiler G, Hansen TV, Jønson L, Agnarsson BA, Kirchhoff T, Offit K, Devlin V, Dutra-Clarke A, Piedmonte M, Rodriguez GC, Wakeley K, Boggess JF, Basil J, Schwartz PE, Blank SV, Toland AE, Montagna M, Casella C, Imyanitov E, Tihomirova L, Blanco I, Lazaro C, Ramus SJ, Sucheston L, Karlan BY, Gross J, Schmutzler R, Wappenschmidt B, Engel C, Meindl A, Lochmann M, Arnold N, Heidemann S, Varon-Mateeva R, Niederacher D, Sutter C, Deissler H, Gadzicki D, Preisler-Adams S, Kast K, Schönbuchner I, Caldes T, de la Hoya M, Aittomäki K, Nevanlinna H, Simard J, Spurdle AB, Holland H, Chen X, Platte R, Chenevix-Trench G, Easton DF. Ontario Cancer Genetics Network SWE-BRCA HEBON EMBRACE GEMO Breast Cancer Family Registry kConFab CIMBA. Common breast cancer susceptibility alleles and the risk of breast cancer for BRCA1 and BRCA2 mutation carriers: implications for risk prediction. Cancer Res 2010;70:9742–54. 10.1158/0008-5472.CAN-10-1907 [DOI] [PMC free article] [PubMed] [Google Scholar]
- 15. Pearce CL, Rossing MA, Lee AW, Ness RB, Webb PM, Chenevix-Trench G, Jordan SM, Stram DA, Chang-Claude J, Hein R, Nickels S, Lurie G, Thompson PJ, Carney ME, Goodman MT, Moysich K, Hogdall E, Jensen A, Goode EL, Fridley BL, Cunningham JM, Vierkant RA, Weber RP, Ziogas A, Anton-Culver H, Gayther SA, Gentry-Maharaj A, Menon U, Ramus SJ, Brinton L, Wentzensen N, Lissowska J, Garcia-Closas M, Massuger LF, Kiemeney LA, Van Altena AM, Aben KK, Berchuck A, Doherty JA, Iversen E, McGuire V, Moorman PG, Pharoah P, Pike MC, Risch H, Sieh W, Stram DO, Terry KL, Whittemore A, Wu AH, Schildkraut JM, Kjaer SK. for Australian Cancer Study (Ovarian Cancer) Australian Ovarian Cancer Study Group Ovarian Cancer Association Consortium. Combined and interactive effects of environmental and GWAS-identified risk factors in ovarian cancer. Cancer Epidemiol Biomarkers Prev 2013;22:880–90. 10.1158/1055-9965.EPI-12-1030-T [DOI] [PMC free article] [PubMed] [Google Scholar]
- 16. Ramus SJ, Song H, Dicks E, Tyrer JP, Rosenthal AN, Intermaggio MP, Fraser L, Gentry-Maharaj A, Hayward J, Philpott S, Anderson C, Edlund CK, Conti D, Harrington P, Barrowdale D, Bowtell DD, Alsop K, Mitchell G, Cicek MS, Cunningham JM, Fridley BL, Alsop J, Jimenez-Linan M, Poblete S, Lele S, Sucheston-Campbell L, Moysich KB, Sieh W, McGuire V, Lester J, Bogdanova N, Dürst M, Hillemanns P, Odunsi K, Whittemore AS, Karlan BY, Dörk T, Goode EL, Menon U, Jacobs IJ, Antoniou AC, Pharoah PDP, Gayther SA. Germline Mutations in the BRIP1, BARD1, PALB2, and NBN Genes in Women With Ovarian Cancer. JNCI: Journal of the National Cancer Institute 2015;107 10.1093/jnci/djv214 [DOI] [PMC free article] [PubMed] [Google Scholar]
- 17. Pearce CL, Stram DO, Ness RB, Stram DA, Roman LD, Templeman C, Lee AW, Menon U, Fasching PA, McAlpine JN, Doherty JA, Modugno F, Schildkraut JM, Rossing MA, Huntsman DG, Wu AH, Berchuck A, Pike MC, Pharoah PDP. Population distribution of lifetime risk of ovarian cancer in the United States. Cancer Epidemiol Biomarkers Prev 2015;24:671–6. 10.1158/1055-9965.EPI-14-1128 [DOI] [PMC free article] [PubMed] [Google Scholar]
- 18. Manchanda R, Legood R, Antoniou AC, Gordeev VS, Menon U. Specifying the ovarian cancer risk threshold of ‘premenopausal risk-reducing salpingo-oophorectomy’ for ovarian cancer prevention: a cost-effectiveness analysis. J Med Genet 2016;53:591–9. 10.1136/jmedgenet-2016-103800 [DOI] [PubMed] [Google Scholar]
- 19. Manchanda R, Legood R, Pearce L, Menon U. Defining the risk threshold for risk reducing salpingo-oophorectomy for ovarian cancer prevention in low risk postmenopausal women. Gynecol Oncol 2015;139:487–94. 10.1016/j.ygyno.2015.10.001 [DOI] [PubMed] [Google Scholar]
- 20. Manchanda R, Legood R, Antoniou AC, Pearce L, Menon U. Commentary on changing the risk threshold for surgical prevention of ovarian cancer. BJOG 2018;125 10.1111/1471-0528.14763 [DOI] [PubMed] [Google Scholar]
- 21. Evans DM, Visscher PM, Wray NR. Harnessing the information contained within genome-wide association studies to improve individual prediction of complex disease risk. Hum Mol Genet 2009;18:3525–31. 10.1093/hmg/ddp295 [DOI] [PubMed] [Google Scholar]
- 22. Won S, Choi H, Park S, Lee J, Park C, Kwon S. Evaluation of Penalized and Nonpenalized Methods for Disease Prediction with Large-Scale Genetic Data. Biomed Res Int 2015;2015:1–10. 10.1155/2015/605891 [DOI] [PMC free article] [PubMed] [Google Scholar]
- 23. Austin E, Pan W, Shen X. Penalized regression and risk prediction in genome-wide association studies. Stat Anal Data Min 2013;6:315–28. 10.1002/sam.11183 [DOI] [PMC free article] [PubMed] [Google Scholar]
Associated Data
This section collects any data citations, data availability statements, or supplementary materials included in this article.
Supplementary Materials
jmedgenet-2018-105313supp001.docx (338.8KB, docx)