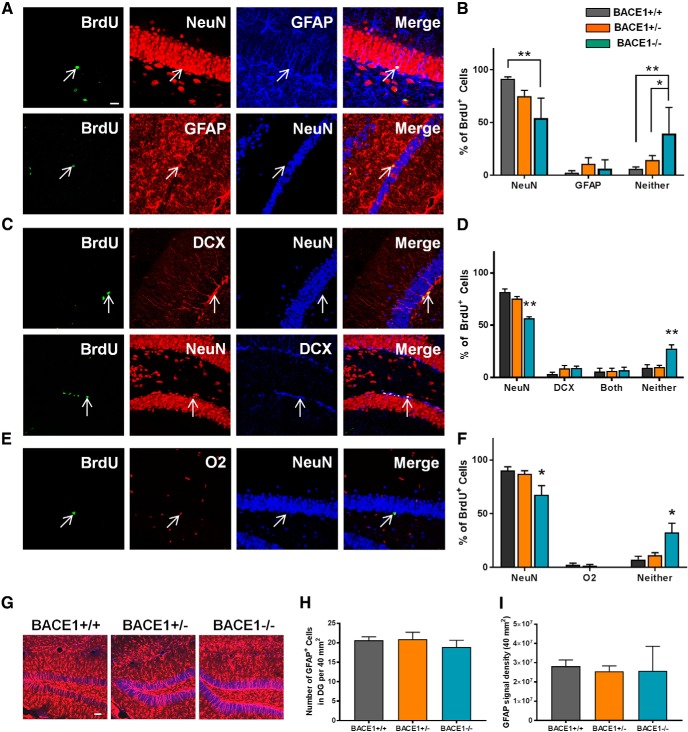
Figure 3.
Loss of BACE1 alters neuronal fate differentiation of NPCs. A, Representative confocal images of BrdU+ cells colabeled with NeuN (upper panels) or GFAP (lower panels). Arrows indicate the position of BrdU+ cells. Scale bar: 20 µm. B, Percentage of BrdU+ cells colabeled with NeuN or GFAP, or neither of them (mean ± SEM; n = 6 in BACE1+/+, 8 in BACE1+/–, and 5 in BACE1–/– mice). For NeuN, F(2,16) = 9.501, p = 0.0019. For GFAP, F(2,16) = 0.786, p = 0.4725. For neither, F(2,16) = 7.551, p = 0.0049; *, p < 0.05; **, p < 0.01. C, Representative confocal images of BrdU+ cells colabeled with DCX but not NeuN (upper panels), or with DCX and NeuN (lower panels). D, Percentage of BrdU+ cells colabeled with NeuN or DCX, both, or neither of them (mean ± SEM; n = 6 in BACE1+/+, 8 in BACE1+/–, and 5 in BACE1–/– mice). For NeuN, F(2,16) = 28.34, p < 0.0001. For DCX, F(2,16) = 1.566, p = 0.2392. For both, F(2,16) = 0.03229, p = 0.9863. For neither, F(2,16) = 13.63, p = 0.0004; **, p < 0.01. E, Representative confocal images of BrdU+ cells colabeled with O2. F, Percentage of BrdU+ cells colabeled with NeuN or O2, or neither of them (mean ± SEM; n = 4 in BACE1+/+, 6 in BACE1+/–, and 4 in BACE1–/– mice). For NeuN, F(2,11) = 5.607, p = 0.0210. For O2, F(2,11) = 1.235, p = 0.3283. For neither, F(2,11) = 7.3, p = 0.0096; *, p < 0.05. G, Representative confocal images of GFAP+ astrocytes in the DG of BACE1+/+, BACE1+/–, and BACE1–/– mice. Red, GFAP+ cells; blue, NeuN+ cells. Scale bar: 50 µm. H, Quantification of GFAP+ cells (mean ± SEM; n = 5 per group; F(2,12) = 0.5162, p = 0.6095). I, GFAP signal intensity (mean ± SEM; n = 5 per group; F(2,12) = 0.0344, p = 0.9662).

