Abstract
BACKGROUND
Information on LMS parameters and percentiles reference for Saudi children and adolescents is not available.
OBJECTIVE
To report the L, M, and S parameters and percentile reference graphs for growth.
DESIGN
Field survey of a population-based sample of Saudi school-age children and adolescents (5–18 years of age).
SETTING
A stratified listing of the Saudi population.
SUBJECTS AND METHODS
Data from the national study of healthy children were reanalyzed using the Lamba-Mu-Sigma (LMS) methodology. The LMS parameters of percentiles for weight, height, and body mass index for age were calculated for children and adolescents from 5 to 18 years of age.
MAIN OUTCOME MEASURE
The main outcomes were the LMS parameters and percentiles of growth.
RESULTS
There were 19 299 and 9827 (50.9%) were boys. The data for weight, height, and BMI for age for boys and girls are reported for the 3rd, 5th, 10th, 25th, 50th, 75th, 90th, 95th, and 97th percentiles including LMS parameters for each percentile and age. Figures corresponding to each table are color coded (blue for boys and pink for girls).
CONCLUSIONS
This report provides a reference for growth and nutrition of Saudi school-age children and adolescents. The detailed LMS and percentile tables and graphs provide essential information for clinical assessment of nutritional status and growth in various clinical conditions and for research.
LIMITATIONS
This report does not reflect regional variations in growth.
Growth charts have long been used worldwide to assess nutritional status. However, regular revisions were performed to account for secular changes in growth and to take advantage of modern statistical techniques.1 The American growth charts, including the previous 1978 National Center for Health Statistics (NCHS) and the current revised National Center for Disease Control reference growth charts (CDC 2000), which reflect the growth of children of the United States, are commonly used.2,3 However, in an attempt to provide growth charts more applicable to populations other than the United States, the World Health Organization (WHO) created the WHO Growth Reference Charts for School-age Children and Adolescents in 2007.4 Despite the common use of the CDC 2000 and WHO growth reference charts in some countries, others developed local growth reference more suitable to their population.5–8
In Saudi Arabia, growth charts from a representative sample of children have been published in the form of charts only.9 Therefore, the objective of this article is to report detailed percentile values of commonly used growth parameters, including LMS values, in children and adolescents from 5 to 18 years of age.
SUBJECTS AND METHODS
The methodology has been reported in a previous study.9 In brief, multistage probability sampling was used to select a representative sample from each region of the country. Only healthy children were included. Weight is expressed in kilograms (kg) and length/height in centimeter (cm). As in previous analysis, the age was converted in Gregorian to facilitate comparison with growth charts of other populations.
Statistical methods
The L, M, and S method was used to synthesize the distribution of growth parameters as a function of age. The LMS parameters are the median (M), the generalized coefficient of variation (S), and the power in the Box-Cox transformation (L). The method models the entire distribution taking into account degree of skewness (L), central tendency (M), and dispersion (S). The parameters L, M and S were calculated according to the method of maximum penalized likelihood.10 Percentiles for all the anthropometric measures were calculated using the following formula.11
Where the L, M, and S are the values from the appropriate table corresponding to the age in years of the child. Z is the z-score that corresponds to the percentile.
For this study, we have calculated the 3rd, 5th, 10th, 25th, 50th, 75th, 90th, 95th and the 97th percentiles for weight, height, and added the 85th percentile for body mass index, commonly used to define overweight. The LMS Chart Maker Light 2.1 (Medical Research Council, London, UK) was used to process the data and Q-test was used to assess the goodness of fit of all L, M, and S models.12
This analysis is based on data from health profile of Saudi children and adolescents study funded and approved by King Abdul Aziz City for Science and Technology, Riyadh, Saudi Arabia.
RESULTS
The sample size consisted of 19 299 Saudi children and adolescents from 5 to 18 year of age. All were Saudi nationals and 9 827 (50.9 %) were boys. For boys, the L, M, and S parameters and percentiles for weight for age, height for age, and BMI for age are presented in the
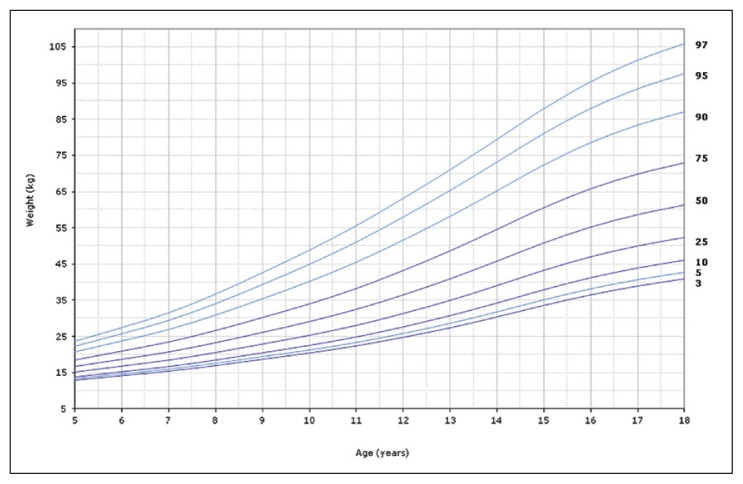
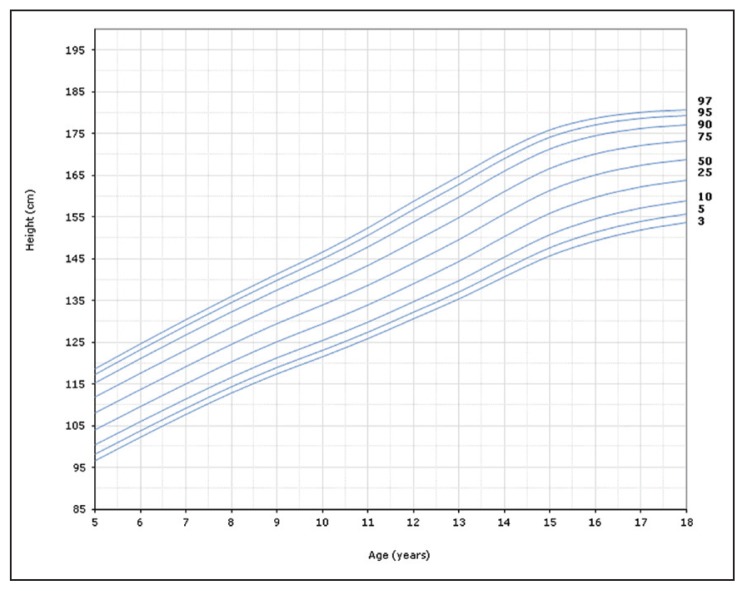
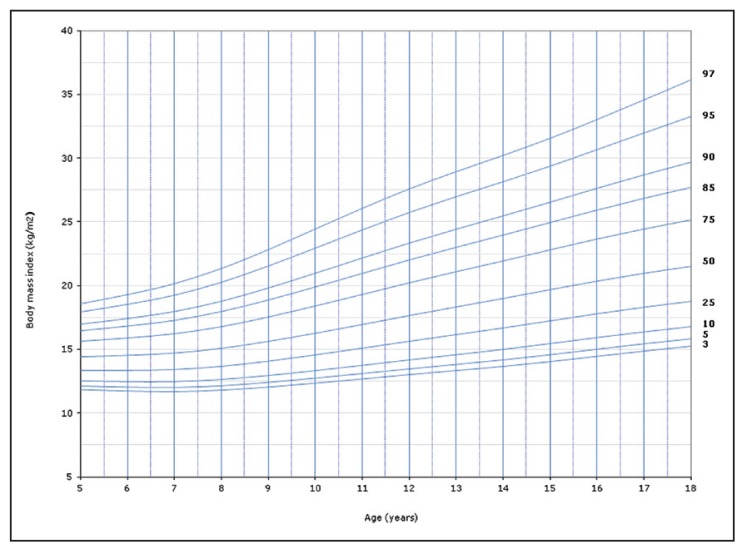
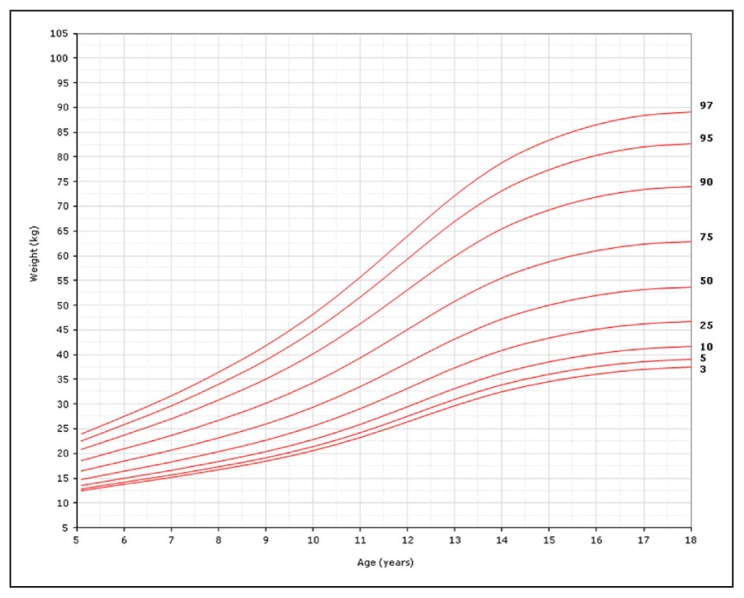
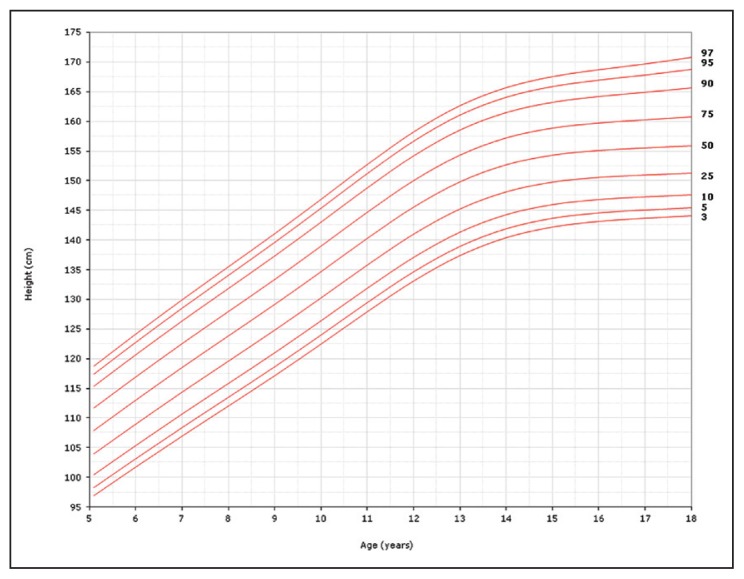
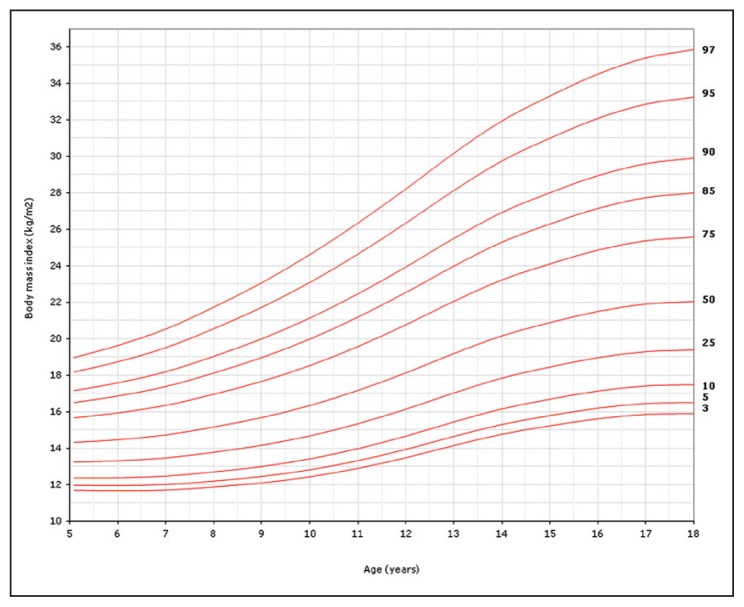
Tables 1 to 3, respectively, and the Figures 1 to 3 represent plots corresponding to the tables. Similarly, Tables 4 to 6 show L, M, and S parameters and percentiles for girls, including weight for age, height for age, and BMI for age. Figures 4 to 6 are plots of the data in Tables 4 to 6.
Table 1.
L, M, and S parameters and percentiles for weight for age: boys 5 to 18 years.
| Age (y) | L | M | S | 3rd | 5th | 10th | 25th | 50th | 75th | 90th | 95th | 97th |
|---|---|---|---|---|---|---|---|---|---|---|---|---|
| 5 | −1.046774 | 16.65079 | 0.1550993 | 12.90855 | 13.28112 | 13.89993 | 15.07723 | 16.65079 | 18.60172 | 20.80742 | 22.40426 | 23.58309 |
| 6 | −1.032594 | 18.64088 | 0.1685233 | 14.17041 | 14.60824 | 15.33896 | 16.74133 | 18.64088 | 21.03668 | 23.80084 | 25.83963 | 27.36547 |
| 7 | −1.015487 | 20.66037 | 0.1819188 | 15.40283 | 15.90975 | 16.75961 | 18.4042 | 20.66037 | 23.55329 | 26.95761 | 29.51515 | 31.45556 |
| 8 | −0.991157 | 23.2016 | 0.1951612 | 16.96528 | 17.558 | 18.55585 | 20.5014 | 23.2016 | 26.71622 | 30.92749 | 34.14503 | 36.61717 |
| 9 | −0.9524795 | 26.06358 | 0.2080576 | 18.68911 | 19.38161 | 20.55156 | 22.84711 | 26.06358 | 30.30098 | 35.4506 | 39.43634 | 42.52811 |
| 10 | −0.8979311 | 29.04166 | 0.2201021 | 20.42467 | 21.22672 | 22.58539 | 25.26373 | 29.04166 | 34.05786 | 40.20527 | 44.99669 | 48.73124 |
| 11 | −0.8295125 | 32.4206 | 0.2305578 | 22.38467 | 23.31419 | 24.89148 | 28.00907 | 32.4206 | 38.29382 | 45.50162 | 51.1186 | 55.49237 |
| 12 | −0.7531365 | 36.42373 | 0.2388563 | 24.73617 | 25.81763 | 27.65393 | 31.28576 | 36.42373 | 43.24885 | 51.58274 | 58.03479 | 63.02903 |
| 13 | −0.678714 | 40.85276 | 0.2446715 | 27.37162 | 28.62171 | 30.74394 | 34.93716 | 40.85276 | 48.66688 | 58.12203 | 65.36768 | 70.92835 |
| 14 | −0.6195751 | 45.73953 | 0.2479675 | 30.36456 | 31.79524 | 34.22245 | 39.01013 | 45.73953 | 54.57247 | 65.16076 | 73.1944 | 79.31055 |
| 15 | −0.5869272 | 50.75983 | 0.2490815 | 33.55655 | 35.16184 | 37.88363 | 43.24485 | 50.75983 | 60.58089 | 72.28175 | 81.10396 | 87.78738 |
| 16 | −0.5862568 | 55.13887 | 0.2485967 | 36.47562 | 38.21821 | 41.17227 | 46.98918 | 55.13887 | 65.78262 | 78.45399 | 88.00129 | 95.23035 |
| 17 | −0.6082383 | 58.58773 | 0.2471192 | 38.90816 | 40.74362 | 43.85572 | 49.98706 | 58.58773 | 69.84454 | 83.28848 | 93.45201 | 101.1684 |
| 18 | −0.6401284 | 61.25766 | 0.2451296 | 40.89868 | 42.79431 | 46.00937 | 52.34879 | 61.25766 | 72.95528 | 86.9922 | 97.65765 | 105.788 |
Table 2.
L, M, and S parameters and percentiles for height for age: boys 5 to 18 years.
| Age (y) | L | M | S | 3rd | 5th | 10th | 25th | 50th | 75th | 90th | 95th | 97th |
|---|---|---|---|---|---|---|---|---|---|---|---|---|
| 5 | 1.484274 | 107.9784 | 5.40E-02 | 96.72755 | 98.17271 | 100.3781 | 104.0118 | 107.9784 | 111.8757 | 115.3279 | 117.3701 | 118.6872 |
| 6 | 1.139618 | 113.6109 | 5.22E-02 | 102.3724 | 103.7914 | 105.971 | 109.5992 | 113.6109 | 117.6028 | 121.1796 | 123.3131 | 124.6959 |
| 7 | 0.9419675 | 119.1193 | 5.06E-02 | 107.8147 | 109.2292 | 111.4093 | 115.0578 | 119.1193 | 123.1889 | 126.8584 | 129.0574 | 130.4867 |
| 8 | 0.9449131 | 124.4657 | 4.94E-02 | 112.9265 | 114.3706 | 116.5963 | 120.3204 | 124.4657 | 128.6186 | 132.3627 | 134.6062 | 136.0643 |
| 9 | 0.9488391 | 129.4396 | 4.91E-02 | 117.5055 | 118.9993 | 121.3014 | 125.1531 | 129.4396 | 133.7335 | 137.6041 | 139.9232 | 141.4304 |
| 10 | 0.6246465 | 133.9074 | 4.98E-02 | 121.5972 | 123.117 | 125.4709 | 129.4415 | 133.9074 | 138.4299 | 142.5483 | 145.0346 | 146.6579 |
| 11 | 9.42E-02 | 138.638 | 5.08E-02 | 125.9425 | 127.4751 | 129.8681 | 133.9576 | 138.638 | 143.4659 | 147.9409 | 150.6791 | 152.4818 |
| 12 | −7.27E-02 | 144.0198 | 5.19E-02 | 130.6711 | 132.2703 | 134.774 | 139.0717 | 144.0198 | 149.1572 | 153.9494 | 156.8961 | 158.8421 |
| 13 | 0.2517995 | 149.6053 | 5.24E-02 | 135.4007 | 137.1248 | 139.8117 | 144.3891 | 149.6053 | 154.9613 | 159.9034 | 162.9168 | 164.8965 |
| 14 | 0.9325199 | 155.8014 | 5.17E-02 | 140.697 | 142.5861 | 145.4981 | 150.3728 | 155.8014 | 161.2428 | 166.1509 | 169.0929 | 171.0054 |
| 15 | 1.843215 | 161.4386 | 4.97E-02 | 145.703 | 147.7542 | 150.8666 | 155.9498 | 161.4386 | 166.7743 | 171.4564 | 174.2076 | 175.9748 |
| 16 | 2.715764 | 165.1562 | 4.69E-02 | 149.2968 | 151.4456 | 154.6555 | 159.7773 | 165.1562 | 170.2502 | 174.6213 | 177.1498 | 178.7593 |
| 17 | 3.411383 | 167.4663 | 4.42E-02 | 151.8744 | 154.0466 | 157.2535 | 162.2847 | 167.4663 | 172.2878 | 176.3651 | 178.7004 | 180.1785 |
| 18 | 3.980551 | 168.8105 | 0.0417342 | 153.6481 | 155.8031 | 158.9572 | 163.8451 | 168.8105 | 173.3751 | 177.1976 | 179.3726 | 180.7441 |
Table 3.
L, M, and S parameters and percentiles for body mass index for age: boys 5 to 18 years.
| Age (y) | L | M | S | 3rd | 5th | 10th | 25th | 50th | 75th | 85th | 90th | 95th | 97th |
|---|---|---|---|---|---|---|---|---|---|---|---|---|---|
| 5 | −1.1546 | 14.425 | 0.11715 | 11.85398 | 12.12153 | 12.56001 | 13.37456 | 14.42514 | 15.67127 | 16.44123 | 17.01084 | 17.93816 | 18.60128 |
| 6 | −1.1749 | 14.535 | 0.12861 | 11.74748 | 12.03238 | 12.50179 | 13.38225 | 14.53462 | 15.92714 | 16.80206 | 17.45674 | 18.53642 | 19.31935 |
| 7 | −1.1943 | 14.712 | 0.13997 | 11.70181 | 12.00415 | 12.50487 | 13.45289 | 14.71178 | 16.26175 | 17.25246 | 18.00262 | 19.25692 | 20.18026 |
| 8 | −1.2098 | 15.083 | 0.15111 | 11.81397 | 12.13688 | 12.67425 | 13.70075 | 15.08292 | 16.81615 | 17.9431 | 18.80676 | 20.27145 | 21.36678 |
| 9 | −1.2071 | 15.628 | 0.16196 | 12.0571 | 12.40471 | 12.98559 | 14.10385 | 15.62799 | 17.57034 | 18.85257 | 19.84589 | 21.55233 | 22.84696 |
| 10 | −1.1782 | 16.265 | 0.17227 | 12.36124 | 12.7369 | 13.36675 | 14.5866 | 16.26476 | 18.42953 | 19.87483 | 21.00345 | 22.96081 | 24.46162 |
| 11 | −1.1235 | 16.946 | 0.18163 | 12.69091 | 13.09729 | 13.78019 | 15.10806 | 16.94554 | 19.33282 | 20.93661 | 22.1942 | 24.38563 | 26.07443 |
| 12 | −1.0488 | 17.642 | 0.18983 | 13.0272 | 13.46638 | 14.20533 | 15.64509 | 17.6423 | 20.2427 | 21.9916 | 23.36342 | 25.75361 | 27.59449 |
| 13 | −0.9647 | 18.314 | 0.1968 | 13.3455 | 13.81801 | 14.61342 | 16.1639 | 18.31431 | 21.10948 | 22.98428 | 24.45111 | 26.99756 | 28.94971 |
| 14 | −0.8892 | 18.98 | 0.20253 | 13.67167 | 14.1767 | 15.02697 | 16.68413 | 18.97991 | 21.95556 | 23.94398 | 25.49473 | 28.17519 | 30.21912 |
| 15 | −0.8478 | 19.666 | 0.20714 | 14.04488 | 14.57897 | 15.47866 | 17.23341 | 19.66593 | 22.81892 | 24.92463 | 26.56565 | 29.39888 | 31.55593 |
| 16 | −0.8615 | 20.334 | 0.21081 | 14.45751 | 15.01265 | 15.94931 | 17.78165 | 20.33412 | 23.66469 | 25.90323 | 27.65583 | 30.69856 | 33.02959 |
| 17 | −0.9132 | 20.943 | 0.21387 | 14.86774 | 15.43648 | 16.39831 | 18.28857 | 20.94259 | 24.4459 | 26.82817 | 28.70968 | 32.01193 | 34.57371 |
| 18 | −0.9786 | 21.486 | 0.21658 | 15.25003 | 15.82811 | 16.80817 | 18.74401 | 21.4863 | 25.15499 | 27.68465 | 29.704 | 33.29661 | 36.1284 |
Figure 1.
Weight-for-age percentiles for boys, 5 to 18 years.
Figure 2.
Height-for-age percentiles for boys, 5 to 18 years.
Figure 3.
Body mass index-for-age percentiles for boys, 5 to 18 year
Table 4.
L, M, and S parameters and percentiles for weight for age: girls 5 to 18 years.
| Age (y) | L | M | S | 3rd | 5th | 10th | 25th | 50th | 75th | 90th | 95th | 97th |
|---|---|---|---|---|---|---|---|---|---|---|---|---|
| 5 | −0.938951 | 16.42919 | 0.1685386 | 12.4482 | 12.84134 | 13.49605 | 14.74714 | 16.42919 | 18.52782 | 20.9147 | 22.65023 | 23.93477 |
| 6 | −0.9157015 | 18.45433 | 0.178501 | 13.77099 | 14.2287 | 14.99332 | 16.46255 | 18.45433 | 20.96522 | 23.85503 | 25.97861 | 27.56234 |
| 7 | −0.8899531 | 20.6649 | 0.1893735 | 15.16592 | 15.69748 | 16.58836 | 18.31021 | 20.6649 | 23.66574 | 27.16288 | 29.76165 | 31.71543 |
| 8 | −0.8623634 | 23.17324 | 0.1999672 | 16.73087 | 17.34735 | 18.38368 | 20.39738 | 23.17324 | 26.74599 | 30.95694 | 34.11781 | 36.51143 |
| 9 | −0.8322223 | 25.97128 | 0.2097031 | 18.4657 | 19.17783 | 20.37801 | 22.72062 | 25.97128 | 30.18894 | 35.205 | 39 | 41.88993 |
| 10 | −0.7994724 | 29.38699 | 0.2178778 | 20.61651 | 21.44358 | 22.84008 | 25.57478 | 29.38699 | 34.35965 | 40.30696 | 44.82735 | 48.28041 |
| 11 | −0.7663324 | 33.57265 | 0.2237808 | 23.31085 | 24.27543 | 25.90588 | 29.10424 | 33.57265 | 39.41382 | 46.41186 | 51.73588 | 55.8042 |
| 12 | −0.7413344 | 38.38703 | 0.2270551 | 26.48859 | 27.60592 | 29.49531 | 33.20366 | 38.38703 | 45.16304 | 53.27594 | 59.44133 | 64.14745 |
| 13 | −0.731925 | 43.22614 | 0.2279888 | 29.77024 | 31.03381 | 33.17061 | 37.36462 | 43.22614 | 50.88586 | 60.05038 | 67.00912 | 72.31693 |
| 14 | −0.7383584 | 47.25764 | 0.2272233 | 32.59572 | 33.97274 | 36.30124 | 40.87108 | 47.25764 | 55.60431 | 65.59375 | 73.18195 | 78.97207 |
| 15 | −0.7550535 | 50.08248 | 0.2255488 | 34.66291 | 36.11118 | 38.55988 | 43.36541 | 50.08248 | 58.86646 | 69.39174 | 77.39851 | 83.51566 |
| 16 | −0.777939 | 52.04097 | 0.2236553 | 36.16599 | 37.65651 | 40.17663 | 45.12304 | 52.04097 | 61.09903 | 71.97591 | 80.2705 | 86.62072 |
| 17 | −0.80327 | 53.22288 | 0.2218783 | 37.13643 | 38.64573 | 41.19784 | 46.20867 | 53.22288 | 62.42283 | 73.50063 | 81.97466 | 88.47912 |
| 18 | −0.8281887 | 53.68508 | 0.2202955 | 37.59686 | 39.10506 | 41.65562 | 46.66542 | 53.68508 | 62.90914 | 74.04828 | 82.59687 | 89.17638 |
Table 5.
L, M, and S parameters and percentiles for height for age: girls 5 to 18 years.
| Age (y) | L | M | S | 3rd | 5th | 10th | 25th | 50th | 75th | 90th | 95th | 97th |
|---|---|---|---|---|---|---|---|---|---|---|---|---|
| 5 | 0.9887214 | 107.8352 | 5.39E-02 | 96.89977 | 98.27086 | 100.3825 | 103.912 | 107.8352 | 111.7599 | 115.2937 | 117.4091 | 118.7831 |
| 6 | 1.021588 | 113.0171 | 5.28E-02 | 101.7718 | 103.1839 | 105.3575 | 108.9872 | 113.0171 | 117.0439 | 120.6655 | 122.8318 | 124.2382 |
| 7 | 1.047814 | 118.522 | 0.051654 | 106.9798 | 108.4309 | 110.6634 | 114.3892 | 118.522 | 122.6479 | 126.3557 | 128.5722 | 130.0106 |
| 8 | 1.046376 | 123.8421 | 5.05E-02 | 112.0533 | 113.5352 | 115.8153 | 119.6207 | 123.8421 | 128.0569 | 131.8449 | 134.1094 | 135.5791 |
| 9 | 1.01275 | 129.1633 | 4.94E-02 | 117.1632 | 118.6694 | 120.9882 | 124.8615 | 129.1633 | 133.4632 | 137.3318 | 139.6463 | 141.1491 |
| 10 | 0.9565817 | 134.6863 | 4.82E-02 | 122.4892 | 124.0165 | 126.3698 | 130.3064 | 134.6863 | 139.0724 | 143.0252 | 145.393 | 146.9317 |
| 11 | 0.8806756 | 140.31 | 0.0471158 | 127.9437 | 129.4875 | 131.8689 | 135.8596 | 140.31 | 144.7774 | 148.8122 | 151.2332 | 152.8079 |
| 12 | 0.7635555 | 145.5699 | 4.60E-02 | 133.1145 | 134.6625 | 137.0543 | 141.0729 | 145.5699 | 150.0999 | 154.2049 | 156.6741 | 158.2826 |
| 13 | 0.5740123 | 149.8175 | 0.0449087 | 137.392 | 138.9255 | 141.3011 | 145.3088 | 149.8175 | 154.3848 | 158.5453 | 161.0578 | 162.6984 |
| 14 | 0.286931 | 152.6869 | 4.41E-02 | 140.3951 | 141.8969 | 144.2317 | 148.1941 | 152.6869 | 157.2761 | 161.4898 | 164.0497 | 165.7275 |
| 15 | −0.1007422 | 154.3053 | 4.37E-02 | 142.1866 | 143.6478 | 145.93 | 149.8333 | 154.3053 | 158.9247 | 163.2127 | 165.8397 | 167.5707 |
| 16 | −0.5813157 | 155.1001 | 4.37E-02 | 143.1323 | 144.5521 | 146.7822 | 150.632 | 155.1001 | 159.7814 | 164.1887 | 166.919 | 168.7308 |
| 17 | −1.140942 | 155.5257 | 4.42E-02 | 143.6594 | 145.041 | 147.2248 | 151.0356 | 155.5257 | 160.3117 | 164.8976 | 167.7792 | 169.7091 |
| 18 | −1.765896 | 155.8763 | 4.49E-02 | 144.071 | 145.417 | 147.5594 | 151.3422 | 155.8763 | 160.8071 | 165.6338 | 168.7209 | 170.813 |
Table 6.
L, M, and S parameters and percentiles for body mass index for age: girls 5 to 18 years.
| Age (y) | L | M | S | 3rd | 5th | 10th | 25th | 50th | 75th | 85th | 90th | 95th | 97th |
|---|---|---|---|---|---|---|---|---|---|---|---|---|---|
| 5 | −1.312917 | 14.32989 | 0.1244782 | 11.68381 | 11.95329 | 12.39768 | 13.23284 | 14.32989 | 15.66306 | 16.50564 | 17.13892 | 18.18902 | 18.95529 |
| 6 | −1.2939 | 14.48028 | 0.1335916 | 11.64918 | 11.93405 | 12.40551 | 13.29727 | 14.48028 | 15.93621 | 16.86706 | 17.57226 | 18.75246 | 19.62239 |
| 7 | −1.27238 | 14.74155 | 0.1436224 | 11.68709 | 11.99053 | 12.4946 | 13.45457 | 14.74155 | 16.34713 | 17.3866 | 18.18098 | 19.52405 | 20.52522 |
| 8 | −1.246668 | 15.17908 | 0.1536925 | 11.85864 | 12.18451 | 12.72778 | 13.76909 | 15.17908 | 16.96106 | 18.12861 | 19.02841 | 20.56485 | 21.72278 |
| 9 | −1.214775 | 15.69607 | 0.1634513 | 12.08774 | 12.43806 | 13.02391 | 14.15329 | 15.69607 | 17.6683 | 18.97423 | 19.98816 | 21.73473 | 23.06392 |
| 10 | −1.17507 | 16.35505 | 0.1724243 | 12.42587 | 12.80402 | 13.43804 | 14.66594 | 16.35505 | 18.53366 | 19.98798 | 21.12348 | 23.09243 | 24.60179 |
| 11 | −1.129133 | 17.17908 | 0.1801299 | 12.89472 | 13.30453 | 13.99292 | 15.33042 | 17.17908 | 19.57733 | 21.1863 | 22.44677 | 24.64075 | 26.32944 |
| 12 | −1.085184 | 18.14618 | 0.186309 | 13.48377 | 13.92795 | 14.67501 | 16.12963 | 18.14618 | 20.77105 | 22.53679 | 23.92236 | 26.33827 | 28.20093 |
| 13 | −1.050285 | 19.2067 | 0.1910618 | 14.15941 | 14.6389 | 15.44607 | 17.02012 | 19.2067 | 22.05912 | 23.98107 | 25.49064 | 28.12516 | 30.158 |
| 14 | −1.02617 | 20.1722 | 0.1946503 | 14.78322 | 15.29402 | 16.15452 | 17.83455 | 20.1722 | 23.22719 | 25.28849 | 26.90886 | 29.73912 | 31.92471 |
| 15 | −1.01184 | 20.89756 | 0.1974603 | 15.24643 | 15.78093 | 16.68194 | 18.44307 | 20.89756 | 24.11151 | 26.28365 | 27.99302 | 30.98236 | 33.29374 |
| 16 | −1.006032 | 21.50933 | 0.1999027 | 15.63638 | 16.1905 | 17.12522 | 18.95463 | 21.50933 | 24.86311 | 27.13513 | 28.92606 | 32.06425 | 34.49603 |
| 17 | −1.002935 | 21.91292 | 0.2022514 | 15.87659 | 16.44464 | 17.40358 | 19.28292 | 21.91292 | 25.37526 | 27.72699 | 29.58424 | 32.84599 | 35.37991 |
| 18 | −0.998486 | 22.05139 | 0.2046199 | 15.92218 | 16.49753 | 17.4695 | 19.37684 | 22.05139 | 25.58162 | 27.98535 | 29.88696 | 33.23357 | 35.83947 |
Figure 4.
Weight-for-age percentiles for girls, 5 to 18 years.
Figure 5.
Height-for-age percentiles for girls, 5 to 18 years.
Figure 6.
Body mass index-for-age percentiles for girls, 5 to 18 years
DISCUSSION
Worldwide variations of human growth are well known, suggesting that the use of growth references from another population is potentially risky.13 Previous studies from Saudi Arabia demonstrated marked differences in growth between Saudi children and their American counterparts.14–16 More recently reported differences between Saudi and both CDC 2000 and WHO growth charts confirm previous studies.17,18 The implication of these differences are considerable with the potential of overestimation of prevalence of short stature and malnutrition potentially resulting in unnecessary referrals and patient and parent anxiety.
The percentile system is commonly used in clinics and hospitals for the assessment of growth and nutrition in clinical setting.19 The percentile ranks of individuals define the nutritional and growth status in comparison with peers of the same age and gender. Children and adolescents are growing subjects and regular evaluation of their growth and nutritional status is mandatory. This is especially true for those affected by chronic medical conditions potentially affecting growth and nutrition. In addition, the LMS parameters and tables of percentiles allow the incorporation of growth charts in electronic hospital and clinic records.
The L, M, and S parameters and growth percentile reference has recently been reported in Saudi preschool children.20 However, to our knowledge, no reference has been reported for Saudi school-age children and adolescents. In this report, growth indicators (weight for age, height for age, and BMI for age) are presented, allowing more accurate assessment of growth and nutritional status. Regular follow up of growth parameter percentiles at different ages helps detection and definition of malnutrition. For example, a flat growth line crossing more than one percentile curve in a weight for age or below the 3rd percentile define failure to grow, also called failure to thrive. Similarly, height for age dropping below the 3rd percentile is a sign of short stature. In addition, the BMI is increasingly used to define thinness (BMI < 5th percentile), overweight (BMI > 85th percentile) and obesity (BMI > 95th percentile).21
In conclusion, the availability of L, M, and S parameters, percentiles tables, and reference charts for height for age, BMI for age and to lesser extent weight for age for school-age children and adolescents is important for research and health care.
Acknowledgment
The authors extend their appreciations to the Deanship of Scientific Research at King Saud University for funding this work through Research Group No. RGP-1436-007.
REFERENCES
- 1.Cole TJ. The development of growth references and growth charts. Ann Hum Biol. 2012;39:382–94. doi: 10.3109/03014460.2012.694475. [DOI] [PMC free article] [PubMed] [Google Scholar]
- 2.Hamill PVV, Drizd TA, Johnson CL, Reed RB, Roche AF, Moore WM. Physical growth: National Center for Health Statistics percentiles. The Am J of Clin Nutr. 1979;32:607–29. doi: 10.1093/ajcn/32.3.607. [DOI] [PubMed] [Google Scholar]
- 3.Kuczmarski RJ, Ogden CL, Guo SS, Grummer-Strawn LM, Flegal KM, Mei Z, et al. 2000 CDC Growth Charts for the United States: methods and development. Vital Health Stat. 2002;246:1–190. [PubMed] [Google Scholar]
- 4.De Onis M, Onyango AW, Borghi E, Siyam A, Nishida C, Siekmann J. Development of a WHO growth reference for school-aged children and adolescents. Bull World Health Organ. 2007;85:660–7. doi: 10.2471/BLT.07.043497. [DOI] [PMC free article] [PubMed] [Google Scholar]
- 5.Bonthuis M, Van Stralen KJ, Verrina E, Edefonti A, Elena A, Molchanova EA, et al. Use of National and International Growth Charts for Studying Height in European Children: Development of Up-To-Date European Height-For-Age Charts. PLOS One. 2012;7(8):e42506. doi: 10.1371/journal.pone.0042506. [DOI] [PMC free article] [PubMed] [Google Scholar]
- 6.Tinggaard J, Aksglaede L, Sørensen K, Mouritsen A, Wohlfahrt-Veje C, Hagen CP, et al. The 2014 Danish references from birth to 20 years for height, weight and body mass index. Acta Pædiatrica. 2014;103:214–24. doi: 10.1111/apa.12468. [DOI] [PubMed] [Google Scholar]
- 7.Khadilkar V, Yadav S, Agrawal KK, Tamboli S, Banerjee M, Cherian A, et al. Revised IAP Growth Charts for Height, Weight and Body Mass Index for 5- to 18-year-old Indian Children. Indian Pediatr. 2015;52:47–55. doi: 10.1007/s13312-015-0566-5. [DOI] [PubMed] [Google Scholar]
- 8.Zong XN, Li H. Construction of a New Growth References for China Based on Urban Chinese Children: Comparison with the WHO Growth Standards. PLOS ONE. 2013;8(3):e59569. doi: 10.1371/journal.pone.0059569. [DOI] [PMC free article] [PubMed] [Google Scholar]
- 9.El Mouzan MI, Al-Herbish AS, Al-Salloum AA, Qurachi MM, Al-Omar AA. Growth charts for Saudi children and adolescents. Saudi Med J. 2007;28:1555–68. [PubMed] [Google Scholar]
- 10.Cole TJ, Green PJ. Smoothing reference percentile: The LMS method and penalized likelihhood. Stat Med. 1992;11:1305–19. doi: 10.1002/sim.4780111005. [DOI] [PubMed] [Google Scholar]
- 11.Cole TJ, Freeman JV, Preece MA. British 1990 growth reference centiles for weight, height, body mass index and head circumference fitted by maximum penalized likelihood. Stat Med. 1998;17:407–29. [PubMed] [Google Scholar]
- 12.Pan H, Cole TJ. A comparison of goodness of fit tests for age-related reference ranges. Statist Med. 2004;23:1749–65. doi: 10.1002/sim.1692. [DOI] [PubMed] [Google Scholar]
- 13.Natale V, Rajagopalan A. Worldwide variation in human growth and the World Health Organization growth standards: a systematic review. BMJ Open. 2014;4:e003735. doi: 10.1136/bmjopen-2013-003735. [DOI] [PMC free article] [PubMed] [Google Scholar]
- 14.Al Sekait MA, Al Nasser AN, Bamgboye EA. The growth pattern of schoolchildren in Saudi Arabia. Saudi Med J. 1992;13:141–6. [Google Scholar]
- 15.Al-Nuaim AR, Bamgboye EA, Al-Herbish A. The pattern of growth and obesity in Saudi Arabian male schoolchildren. Int J Obes Relat Metab Disord. 1996;20:1000–5. [PubMed] [Google Scholar]
- 16.Al-Mazrou YY, Al-Amoud MM, El-Gizouli SE, Khoja TA, Al-Turki KA, Tantawi NE, et al. Comparison of the growth standards between Saudi and American children aged 0–5 years. Saudi Med J. 2003;24:598–602. [PubMed] [Google Scholar]
- 17.El Mouzan MI, Al-Herbish AS, Al-Salloum AA, Foster PJ, Al-Omar AA, Qurachi MM, et al. Comparison of the 2005 growth charts for Saudi children and adolescents to the 2000 CDC growth charts. Ann Saudi Med. 2008;28:334–40. doi: 10.5144/0256-4947.2008.334. [DOI] [PMC free article] [PubMed] [Google Scholar]
- 18.El Mouzan MI, Foster PJ, Al-Herbish AS, Al-Salloum AA, Al-Omar AA, Qurachi MM, et al. The implication of using the World Health Organization Child Growth Standards in Saudi Arabia. Nutrition Today. 2009;44:62–70. [Google Scholar]
- 19.World Health Organization. Physical status: The use of and interpretation of anthropometry. Report of a WHO Expert Committee. World Health Organ Tech Rep Ser. 1995;854:161–2. [PubMed] [Google Scholar]
- 20.El Mouzan M, Al Salloum A, Al Herbish A, Shaffi A. Growth Reference for Saudi Preschool Children: L M S Parameters and Percentiles. Ann Saudi Med. 2015 doi: 10.5144/0256-4947.2016.2. In Press. [DOI] [PMC free article] [PubMed] [Google Scholar]
- 21.Department of Health and Human Services, Centers for Disease Control and Preventions. Body Mass Index: Considerations for Practitioners. [Accessed 5/12/2015]. http://www.cdc.gov/obesity/downloads/bmiforpactitioners.


