Abstract
BACKGROUND AND OBJECTIVES
Obstructive sleep apnea (OSA) is a common disease affecting middle-aged patients and is associated with significant cardiovascular, cerebrovascular, and metabolic complications. Current evidences show inconclusive association between OSA and insulin resistance (IR). This study aims to examine the possible correlation between OSA parameters and IR.
DESIGN AND SETTINGS
This was a cross-sectional study to examine the association between OSA parameters and IR using homeostasis model assessment (HOMA) on patients who underwent polysomnogram (PSG) in a tertiary center between March 2011 and March 2012 (1 year).
PATIENTS AND METHODS
A total of 62 patients underwent PSG within the study period, of which 16 patients were excluded due to abnormal fasting blood sugar. Information on patients’ medical illnesses, medications, and Epworth sleepiness scale (ESS) was obtained. Patients’ body mass index (BMI), neck circumference, and waist circumference (WC) were measured. Blood samples were collected after 8 hours of fasting to measure HOMA–IR value. Overnight PSG was performed for all patients. Data was recorded and analyzed using SPSS, version 12.0 (SPSS Inc, Chicago, USA).
RESULTS
The prevalence of IR in OSA patients was 64.3%. There was significant correlation between OSA parameters (apnea-hypopnea index, ESS, BMI, and WC) and HOMA–IR with correlation coefficient of 0.529, 0.224, 0.261, and 0.354, respectively.
CONCLUSION
A linear correlation exists between OSA parameters and IR concluding a definite causal link between OSA and IR. IR screening is recommended in severe OSA patients.
Obstructive sleep apnea (OSA) is a condition characterized by recurrent partial or complete upper airway obstructions during sleep with each episode generally being terminated by arousal when upper airway muscle tone increases.1
Obstructive apneas are defined as cessation of airflow due to upper airway collapse lasting at least 10 seconds. Obstructive hypopneas are characterized by either a ≥50% decrease in airflow from baseline lasting at least 10 seconds associated with a 4% oxygen desaturation.2 The standard diagnostic test for OSA is an overnight polysomnogram (PSG).3 Information from the PSG is reported as the apnea-hypopnea index (AHI), which is used to categorize the severity of OSA, and it represents the average number of apneas and/or hypopneas per hour of recorded sleep. In adults, an AHI less than 5 events per hour is considered normal. Mild OSA is defined as an AHI between 5 and 15 events per hour, moderate OSA between 16 and 30 events per hour, and severe OSA as greater than 30 events per hour.2 The prevalence of OSA in middle-aged adults between 30 and 60 years of age has been reported as 9% for women and 24% for men.4
OSA is associated with increased cardiovascular and cerebrovascular morbidity.5 It is also recognized that many subjects with OSA have central obesity6 and other features of metabolic syndrome,7,8 namely hyper-insulinemia, glucose intolerance, insulin resistance (IR), dyslipidemia and hypertension.9 These features of the metabolic syndrome are also known the “insulin resistance syndrome.”
IR refers to a reduction in the expected physiologic action of insulin due to desensitization of peripheral tissue to insulin. Increased IR is a primary characteristic of type 2 diabetes mellitus and an independent risk factor for hypertension and coronary heart disease.10 Various methods of tests have been developed to evaluate IR including hyperinsulinemic–euglycemic clamp, the insulin suppression test, and the frequently sampled intravenous glucose tolerance test. These tests, however, are expensive and have a limited patient acceptance for use in large-scale studies.11
The homeostasis model assessment (HOMA) has been proposed to assess secretion and resistance using the fasting glucose and insulin concentration and provides a good correlation for IR.11,12 The formula for the HOMA model is as follow:
According to the formula, HOMA–IR is defined as a value of more than 3 in IR patient.13
Several studies have observed possible associations between sleep loss and hypoxemia with glucose intolerance and IR, respectively.14–18 A more recent clinic-based study found that patients with sleep-disordered breathing have significantly higher fasting glucose and insulin level compared with a group of weight-matched control subjects.19–21
While there is no local data on incidence of OSA with IR in Malaysia as yet, we wish to test the hypothesis that OSA is an independent risk for IR. We would also want to see its correlation on disease severity by comparing with OSA-related parameters. Positive results and information from this study can be used in future for the need of IR screening in OSA patients. Funding for this study was provided by Universiti Kebangsaan Malaysia Fundamental Research Grant, and the study was approved by Universiti Kebangsaan Malaysia Medical Center (UKMMC) Ethical Review Board in March 2011.
PATIENTS AND METHODS
This is a cross-sectional study in which all patients undergoing PSG test in UKMMC were recruited. Patients were recruited by convenient sampling between March 2011 and March 2012. The sample comprised patients aged 20–60 years, mainly males (79%), and from Malay race (71.4%). This research project was approved by the UKMMC Faculty of Medicine’s Research and Ethics Committee, and written informed consent was obtained. All procedures contributing to this work comply with the ethical standards of the relevant national and institutional guidelines and with the Helsinki Declaration of 1975, as revised in 2008.
Patients with factors that could affect IR were excluded, such as current substance use, having any endocrine disorder other than diabetes mellitus, or insulin/steroidal pharmacotherapy (Table 1).
Table 1.
Inclusion and exclusion criteria.
| Inclusion criteria |
|
|
|
|
|
| Exclusion criteria |
|
|
|
Information on patient’s baseline characteristics, illness(es), medication(s), and Epworth sleepiness scale (ESS) was sought from the patient, caregiver (where available), and patient’s notes. The patient’s weight, height, neck circumference, and waist circumference (WC) were measured. Neck circumference was taken at the level of laryngeal prominence and WC at the level of midpoint in between 12th rib and iliac crest. Blood samples were taken after at least 8 hours of fasting. Two milliliters of blood was collected in a fluoride oxalate bottle to be processed via chemistry method using Cobas Integra 700 (Roche Diagnostics, Indianapolis, USA). For fasting serum insulin (μIU/mL), 3 mL of blood was collected in a plain tube, centrifuged at 3000 rpm for 10 minutes, and frozen at −20 degrees Celsius. The samples were processed via chemiluminescent method using Immulite 2000 Immunoassay Analyzer system (Siemens Medical Solutions Diagnostic, Erlangen, Germany). The intra-assay coefficient of variation was 5.2% to 6.4%, while the interassay coefficient of variation was 5.9% to 8%.
All PSGs were performed in an isolated room, using a computer-assisted sleep study device (SOMNOCheck Effort Weinmann, Hamburg, Germany). Parameters including AHI, apneas, hypopneas, arousal index, respiratory disturbance index, and minimum oxygen saturation were documented.
Data analysis was done using SPSS, version 12.0 (SPSS Inc, Chicago, USA). Continuous data such as age, body mass index (BMI), neck circumference, waist circumference, and ESS score were tested for examining association with HOMA–IR. Comparisons of continuous clinical parameter between subjects with different categorization were made by analysis of variance (ANOVA) test, and for a difference in mean of independent categories involved were compared by t tests. Pearson correlation was used to examine the association of 2 parameters.
RESULTS
During the study period, 62 patients were referred to Othorhinolaryngology clinic, UKMMC, for PSG test, but only 42 patients were recruited. A total of 4 patients refused to join the study, 12 were diagnosed with diabetes mellitus, and 4 were excluded due to fasting blood sugar of more than 7.0 mmol/L.
A total of 28 patients (66.7%) were diagnosed to have OSA of various degrees; majority in severe group (40.5%). Out of the 28 patients, 18 patients had IR, making the prevalence of IR among OSA patients in this study (64.3%). The distribution of patients according to OSA severity and HOMA–IR value is illustrated in Table 2. Majority of patients with HOMA–IR value of more than 3 were in the severe OSA group. This is in contrast to the small number of patients with HOMA–IR value of more than 3 in mild and moderate OSA groups.
Table 2.
Distribution of patients across OSA parameters and HOMA–IR values.
| Parameter | Category | Number of patients (n [%]) | 2-tailed Pearson correlation (r value, P value) | |
|---|---|---|---|---|
| HOMA–IR ≤2.99 (%) | HOMA–IR >3 (%) | |||
|
| ||||
| AHI | Normal | 11.0 (26.2) | 3 (7.1) | 0.72, <.01 |
| Mild | 5.0 (11.9) | 2 (4.8) | ||
| Moderate | 3.0 (7.1) | 1 (2.4) | ||
| Severe | 2.0 (4.8) | 15 (35.7) | ||
| ESS | Normal | 14.0 (33.3) | 3 (7.1) | 0.47, <.01 |
| Mild | 4.0 (9.5) | 7 (16.7) | ||
| Moderate | 3 (7.1) | 8 (19.0) | ||
| Severe | 0 (0) | 3 (7.1) | ||
| BMI | Underweight | 1.0 (2.4) | 0 (0) | 0.51, <.01 |
| Normal | 3.0 (7.1) | 0 (0) | ||
| Pre-obese | 6.0 (14.3) | 1 (2.4) | ||
| Obese 1 | 8.0 (19.0) | 12 (28.6) | ||
| Obese 2 | 1.0 (2.4) | 5 (11.9) | ||
| Obese 3 | 2.0 (4.8) | 3 (7.1) | ||
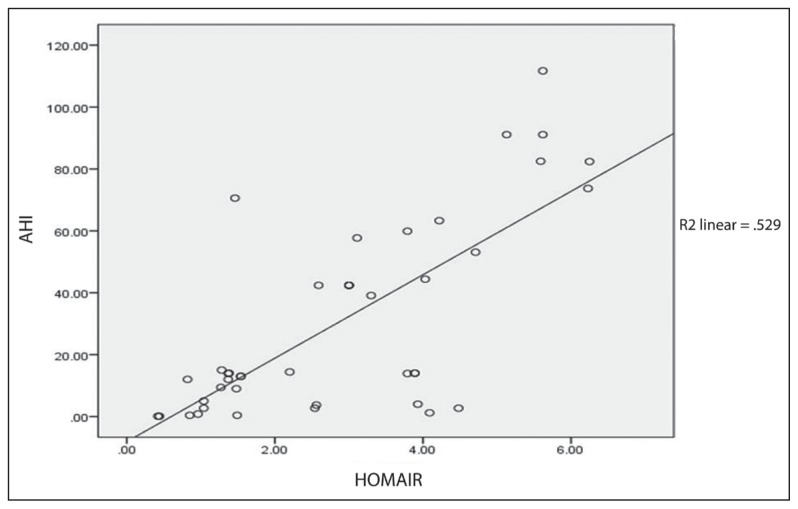
ANOVA test revealed a significant difference of mean HOMA–IR between AHI groups with a P value of .001. Further correlation study done using 2-tailed Pearson correlation revealed a significant correlation between HOMA–IR and AHI (r=0.72, P<.01). Analysis from scatter plot regression was illustrated in Figure 1, which showed a high significant correlation between HOMA–IR and AHI (R2=0.529).
Figure 1.
Correlation of AHI with HOMA–IR.
The mean ESS in this study was 11.4 (4.9). The lowest and highest scores were 3 and 22, respectively. A total of 17 patients (40.5%) scored their level of daytime sleepiness under normal category, while 22 other patients were equally distributed in mild and moderate groups. Three (7.1%) others scored their symptoms as severe. All patients in the severe ESS group had HOMA–IR value of more than 3. This is illustrated in Table 2.
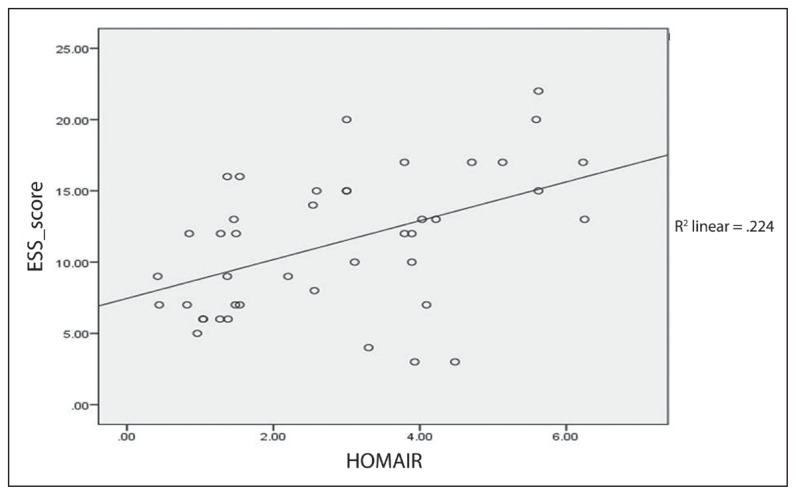
ANOVA test revealed a significant difference of mean between HOMA–IR and ESS score with P=.01. A 2-tailed Pearson correlation analysis revealed a significant correlation between HOMA–IR and ESS score (r=0.47 P<.01). Further analysis from scatter plot regression is illustrated in Figure 2, which showed a significant correlation between HOMA–IR and ESS score (R2=0.224).
Figure 2.
Correlation of ESS with HOMA–IR.
The mean BMI of the study population was 31.5 (6.9) kg/m2. Majority were in the obese 1 category (47.6%) at 27.5 to less than 35 kg/m2. Table 2 illustrates the distribution of patients according to BMI category and HOMA–IR value. Patients in the obese 2 category (35 to <40 kg/m2) had the highest percentage of IR (83.3%) followed by those in the obese 3 category (60%).
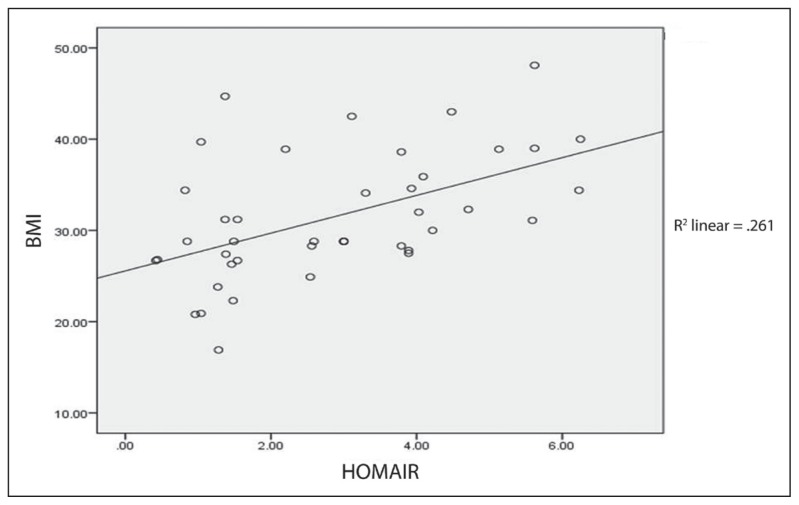
ANOVA test revealed a significant difference of mean HOMA–IR and BMI groups with P=.01. A 2-tailed Pearson correlation analysis revealed a significant correlation between HOMA–IR and BMI (r=0.51 P<.01). Further analysis from scatter plot regression is illustrated in Figure 3, which showed a significant correlation between HOMA–IR and BMI (R2 = 0.261).
Figure 3.
Correlation of BMI with HOMA–IR.
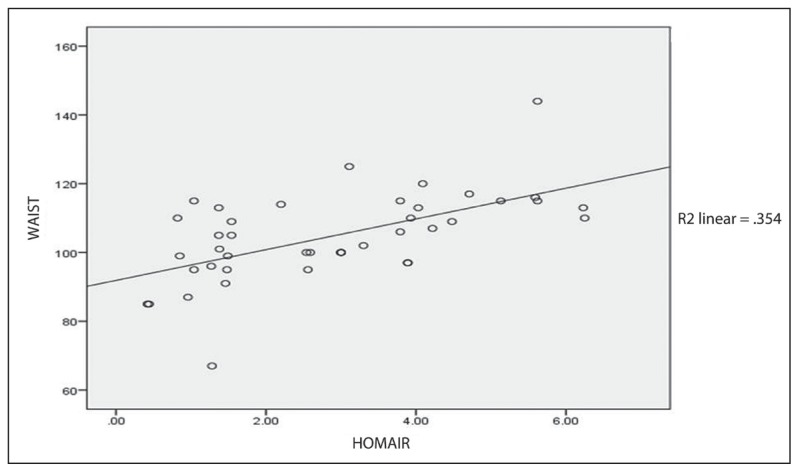
The mean WC was 104.7 (12.8) cm. The t test revealed a significant difference between HOMA-IR and mean WC (P=.001). A significant correlation between HOMA–IR and WC (r=0.59 P<.01) was observed using a 2-tailed Pearson correlation analysis. Analysis from scatter plot regression was illustrated in Figure 4 with the correlation coefficient of R2 =0.354.
Figure 4.
Correlation of waist circumference with HOMA–IR.
DISCUSSION
This is the first study conducted in Malaysia looking at relationship of OSA and IR. It was a clinic-based sample in which patients, if presented with symptoms such as excessive daytime sleepiness, disturbed nocturnal sleep, or insomnia, were referred by general practitioners and physicians for overnight PSG. None of these patients were specifically referred for the assessment of disorders of glucose metabolism associated with clinical signs of OSA.
The findings of this study suggested that OSA is significantly correlated to IR. Results demonstrated that subjects with OSA had a significantly greater HOMA–IR value (P=.001). This result is further supported by a linear relationship seen in Pearson correlation study between AHI and HOMA–IR.
In many studies of IR-related sleep-disordered breathing, a major confounding factor in the analysis is obesity. Measures of obesity include BMI, WC, and waist-hip circumference ratio. Earlier studies have demonstrated that obesity correlates significantly with IR. Ip et al in 2002 investigated the relationship between sleep-disordered breathing and IR. They found out that obesity was the major determinant of IR, but sleep-disordered breathing parameters (AHI and minimum oxygen saturation) were also independent determinants of IR.3 Elmasry et al, in their study in 2001, examined the association of diabetes mellitus and OSA in a sample of 116 age-stratified men with hypertension selected from subjects in a population-based study in Sweden. It was shown that although obesity was the main risk factor for diabetes mellitus, coexistent severe OSA may add to the risk independently.22
IR in this present study was highly related to AHI, and less lrelated WC and BMI. The analysis using scatter plot regression revealed a correlation result between HOMA–IR and AHI of R2=0.529. Therefore, we concluded that the effects of AHI were greater than that of obesity, as a correlation on the scatter plot regression showed smaller value: BMI (R2=0.261) and WC (R2=0.354). This result is comparable to more recent studies.
Punjabi et al in 2002 studied 150 healthy men to determine the metabolic consequences and community prevalence of sleep-disordered breathing. After adjusting for BMI and percent body fat, the increase in AHI was associated with the worsening of IR independent of obesity.8 Another paper by him in 2004 investigated the association between the severity of sleep-disordered breathing and IR by modeling the relation between AHI and HOMA index. It consisted of 2656 participants enrolled in the multicenter Sleep Heart Health Study. They too concluded that the severity of AHI determined a higher value of HOMA index independently of BMI and WC.19 A more recent study by Papanas et al in 2010 also concurred with our result, in which an increase in serum glucose was significantly associated with OSA independent of BMI.21
ESS was developed and validated by Dr. Murray Johns. It is a simple, self-administered questionnaire, which is widely used in quantifying the level of daytime sleepiness. Nevertheless, ESS subjectively quantifies sleep propensity, while the AHI is an objective value for the severity of OSA. A comparative audit of patient and partner scoring was carried out in Gloucestershire Royal Hospital. They found out that there was no mean difference between patient and partner perspective in ESS score (P=.906).23 The partner perspective (r=0.464), but not the patient ESS (r=0.305), correlated with AHI. In their conclusion, ESS was found to be poor predictors of AHI.23 Their result was supported by another audit that tested on Berlin Questionnaire and ESS as a screening instrument for OSAs. ESS was found to have low to moderate sensitivity (45%) and specificity (81%), and thus it was concluded that ESS was of low value as a screening tool.24
However, in this present study, the mean ESS score was 11.36 (4.89), and an increase in ESS score was noted to be associated with an increase in the AHI index. The study also revealed a significant mean of ESS for neck circumference, fasting insulin level, fasting blood sugar, and HOMA–IR value (P<.05). There was also a positive correlation seen between ESS and HOMA–IR (r=0.47, R2=0.224), although the effect was much smaller than it was for AHI and BMI. This was the first paper to assess the relationship of ESS with IR, especially in OSA patients.
WC is an independent prediction of relative disease risk in the Asian population; it is a better indicator than BMI.25 This is supported by many studies indicating significantly higher visceral adiposity in the East Asian population compared to Europeans at a given BMI.26 In this study, WC is used as opposed to waist–hip ratio. Based on a prospective study of 48 287 patients by Seidell et al, it is shown that WC alone could replace waist-hip ratio and BMI as a single risk factor for all-cause mortality, and WC is strongly predictive in young and middle-aged adults, who are predominant in our study population.27 The mean WC in our study population was 104.69 cm. To the best of our knowledge, there is no published data describing cutoff points for WC in the East Asian population. This may be an area of potential future study owing to very high ethnic differences in the distribution of WC.
This study is important in the regional setting, as the Southeast Asian population has different dietary practices and lifestyle compared to the Western counterpart where most papers on OSA and IR are reported. The Malaysian population has a comparable nutrient intake with Singaporeans, Chinese, and Japanese but consume proportionately more carbohydrates compared to British, Australian, and New Zealanders.28 The Malaysian population has a slightly lower prevalence of IR compared to the British, whereby findings of this study compliment the prevalence of IR in schizophrenic patients of 68%.29
In this study, we utilized ambulatory PSG using a computer-assisted sleep study device (SOMNOCheck Effort Weinmann, Hamburg, Germany). This is a potential limitation, as AHI may be under- or overestimated. Future research could utilize the full, attended, and manually scored polysomnogram to correct the imprecisions at the expense of a longer waiting time to perform the study as well as more tedious reporting efforts needed.
In summary, the results of this study provide concrete evidence that OSA is associated with IR and may have the following practical implications. As IR is associated with type 2 diabetes mellitus and a risk for metabolic and cardiovascular complications, it appears useful for clinicians treating patients with diagnosed metabolic syndrome to bear in mind that they may have some reduction of sleep quality and that hyperglycemia increases the likelihood of OSA. Given that OSA itself aggravates IR, early specialist referral for diagnosis and management of this condition is beneficial. Further studies are needed to define the mechanism through which OSA promotes IR. We would also recommend a further study to determine whether a sustained treatment of OSA reverses the associated metabolic disturbance.
REFERENCES
- 1.Bassiri AG, Guilleminault C. Clinical features and evaluation of obstructive sleep apnea syndrome. In: Kryger MH, Roth T, Dement WC, editors. Principals and Practice of Sleep Medicine. 3rd ed. London: WB Saunders; 2000. pp. 869–78. [Google Scholar]
- 2.American Academy of Sleep Medicine. Diagnostic and Coding Manual. Second Edition. Westchester: 2005. International Classification of Sleep Disorders. [Google Scholar]
- 3.Ip MS, Lam B, Ng MM, Lam WK, Tsang KW, Lam KS. Obstructive sleep apnea is independently associated with insulin resistance. Am J Respir Crit Care Med. 2002;165(5):670–76. doi: 10.1164/ajrccm.165.5.2103001. [DOI] [PubMed] [Google Scholar]
- 4.Young T, Palta M, Dempsey J, Skatrud J, Weber S, Badr S. The occurrence of sleep-disordered breathing among middle-age adults. N Engl J Med. 1993;328:1230–5. doi: 10.1056/NEJM199304293281704. [DOI] [PubMed] [Google Scholar]
- 5.Koskenvuo M, Kaprio J, Telakiri T, Partinen M, Heikkila K, Saran S. Snoring as a risk factor for ischaemic heart disease and stroke in men. Br Med J. 1987;294:16–19. doi: 10.1136/bmj.294.6563.16. [DOI] [PMC free article] [PubMed] [Google Scholar]
- 6.Tasali E, Mokhlesi B, Van Cauter E. Obstructive sleep apnea and type 2 diabetes: interacting epidemics. Chest. 2008;133:496–506. doi: 10.1378/chest.07-0828. [DOI] [PubMed] [Google Scholar]
- 7.Davies JJ, Turner R, Crosby J, Stradling JR. Plasma insulin and lipid levels in untreated obstructive sleep apnea: their comparison with matched controls and response to treatment. J Sleep Res. 1994;3:180–5. doi: 10.1111/j.1365-2869.1994.tb00126.x. [DOI] [PubMed] [Google Scholar]
- 8.Punjabi NM, Sorkin JD, Katzel LI, Goldberg AP, Schwartz AR, Smith PL. Sleep-disordered breathing and insulin resistance in middle-aged and overweight men. Am J Respir Crit Care Med. 2002;165(5):677–82. doi: 10.1164/ajrccm.165.5.2104087. [DOI] [PubMed] [Google Scholar]
- 9.Lobovitz HE. Insulin resistance: definition and consequences. Exp Clin Endocrinol Diabetes. 2001;109(suppl 2):S135–S48. doi: 10.1055/s-2001-18576. [DOI] [PubMed] [Google Scholar]
- 10.American Diabetes Association. Consensus development conference on insulin resistance. Diabetic Care. 1998;21:310–17. doi: 10.2337/diacare.21.2.310. [DOI] [PubMed] [Google Scholar]
- 11.Haffner SM, Miettinen H, Stern MP. The homeostasis model in the San Antonio Heart Study. Diabetes Care. 1997;20:1087–92. doi: 10.2337/diacare.20.7.1087. [DOI] [PubMed] [Google Scholar]
- 12.Laakso M. How good a marker is insulin level for insulin resistance? Am J Epidemiol. 1993;137:959–65. doi: 10.1093/oxfordjournals.aje.a116768. [DOI] [PubMed] [Google Scholar]
- 13.Otake K, Sasanabe R, Hasegawa R, Banno K, Hori R, Okura Y, Yamanouchi K, Shiomi T. Glucose intolerance in Japanese patients with obstructive sleep apnea. Inter Med. 2009;48:1863–8. doi: 10.2169/internalmedicine.48.2465. [DOI] [PubMed] [Google Scholar]
- 14.Stoohs RA, Facchini F, Guilleminault C. Insulin resistance and sleep-disordered breathing in healthy humans. Am J Res Crit Care Med. 1996;154:170–4. doi: 10.1164/ajrccm.154.1.8680675. [DOI] [PubMed] [Google Scholar]
- 15.Strohl KP, Novak RD, Singer W, Cahan C, Boehm KD, Denko CW, Hoffstem VS. Insulin levels, blood pressure and sleep apnea. Sleep. 1994;17(7):614–8. doi: 10.1093/sleep/17.7.614. [DOI] [PubMed] [Google Scholar]
- 16.Vgontzas AN, Papanicolaou DA, Bixler EO, Hopper K, Lotsikas A, Lin H, Kales A, Chrousos GP. Sleep apnea and daytime sleepiness and fatigue: relation to visceral obesity, insulin resistance and hypercytokinemia. J Clin Endocrinol Metab. 2000;85:1151–8. doi: 10.1210/jcem.85.3.6484. [DOI] [PubMed] [Google Scholar]
- 17.Al Delaimy WK, Manson JE, Willett WC, Stampfer MJ, Hu FB. Snoring as a risk factor for type II diabetes mellitus: a prospective study. Am J Epidemiol. 2002;155(5):387–93. doi: 10.1093/aje/155.5.387. [DOI] [PubMed] [Google Scholar]
- 18.Meslier N, Gagnadoux F, Giraud P, Person C, Ouksel H, Urban T, Racineux JL. Impaired glucose-insulin metabolism in males with obstructive sleep apnea syndrome. Eur Respir J. 2003;22:156–60. doi: 10.1183/09031936.03.00089902. [DOI] [PubMed] [Google Scholar]
- 19.Punjabi NM, Shahar E, Redline S, Gottlieb DJ, Givelber R, Resnick HE. Sleep disordered breathing, glucose intolerance, and insulin resistance: The sleep heart health study. Am J Epidemiol. 2004;160:521–30. doi: 10.1093/aje/kwh261. [DOI] [PubMed] [Google Scholar]
- 20.Coughlin SR, Mawdsley L, Mugarza JA, Calverley PMA, Wilding JPH. Obstructive sleep apnea is independently associated with an increased prevalence of metabolic syndrome. European Heart Journal. 2004;25:735–41. doi: 10.1016/j.ehj.2004.02.021. [DOI] [PubMed] [Google Scholar]
- 21.Papanas N, Steiropoulos P, Nena E, Tzouvelekis A, Skarlatos A, Konsta M, Vasdekis V, Maltezos E, Bourous D. Predictors of obstructive sleep apnnea in males with metabolic syndrome. Vascular health and risk management. 2010;6:281–6. doi: 10.2147/vhrm.s7948. [DOI] [PMC free article] [PubMed] [Google Scholar]
- 22.Elmasry A, Lindberg E, Berne C, Janson C, Gislason T, Awad Tageldin M, Boman G. Sleep-disordered breathing and glucose metabolism in hypertensive men: a population based study. J Intern Med. 2001;249:153–61. doi: 10.1046/j.1365-2796.2001.00787.x. [DOI] [PubMed] [Google Scholar]
- 23.Hughes C. Can the Epworth Sleepiness Score predict Apnea-Hypopnea Index in Obstructive Sleep Apnea and hypopnea syndrome: A comparative audit of patient and partner scoring. ERS Annual Congress; 2011; Amsterdam. [Google Scholar]
- 24.Mensink A, Uil S, Kuipers B. Berlin questionnaire and Epworth sleepiness scale, useful screening instruments for obstructive sleep apnea syndrome?. ERS Annual Congress; 2011; Amsterdam. [Google Scholar]
- 25.Klatsky AL, Armstrong MA. Cardiovascular risk factors among Asian Americans living in northern California. Am J Public Health. 1991;81:1423–8. doi: 10.2105/ajph.81.11.1423. [DOI] [PMC free article] [PubMed] [Google Scholar]
- 26.Kagawa M, Binns CB, Hills AP. Body composition and anthropometry in Japanese and Australian Caucasian males and Japanese females. Asia Pacific Journal of Clinical Nutrition. 2007;16(Suppl 1):31–36. [PubMed] [Google Scholar]
- 27.Seidell JC, Verschuren WM, van Leer EM, et al. Overweight, underweight, and mortality. A prospective study of 48 287 men and women. Archives of Internal Medicine. 1996;156(9):958–63. doi: 10.1001/archinte.156.9.958. [DOI] [PubMed] [Google Scholar]
- 28.Mirnalini K, Zalilah MS, Safiah MY, Tahir A, Siti Haslinda MD, Siti Rohana, et al. Energy and Nutrient Intakes: Findings from the Malaysian Adult Nutrition Survey (MANS) Mal J Nutr. 2008;14(1):1–24. [PubMed] [Google Scholar]
- 29.Fairuz AR, Maniam T, Khalid BA. Prevalence of Insulin Resistance in Schizophrenia in HUKM. Med J Malaysia. 2007 Oct;62(4):290–3. [PubMed] [Google Scholar]


