Abstract
Exposure to the water pollutant trichloroethylene (TCE) can promote autoimmunity in both humans and rodents. Using a mouse model we have shown that chronic adult exposure to TCE at 500 μg/ml in drinking water generates autoimmune hepatitis in female MRL+/+ mice. There is increasing evidence that developmental exposure to certain chemicals can be more toxic than adult exposure. This study was designed to test whether exposure to a much lower level of TCE (0.05 μg/ml) during gestation, lactation, and early life generated autoimmunity similar to that found following adult exposure to higher concentrations of TCE. When female MRL+/+ mice were examined at postnatal day (PND) 259 we found that developmental/early life exposure [gestational day 0 to PND 154] to TCE at a concentration 10 000 fold lower than that shown to be effective for adult exposure triggered autoimmune hepatitis. This effect was observed despite exposure cessation at PND 154. In concordance with the liver pathology, female MRL+/+ exposed during development and early life to TCE (0.05 or 500 μg/ml) generated a range of antiliver antibodies detected by Western blotting. Expression of proinflammatory cytokines by CD4+ T cells was also similarly observed at PND 259 in the TCE-exposed mice regardless of concentration. Thus, exposure to TCE at approximately environmental levels from gestational day 0 to PND 154 generated tissue pathology and CD4+ T cell alterations that required higher concentrations if exposure was limited to adulthood. TCE exposure cessation at PND 154 did not prevent the immunotoxicity.
Keywords: trichloroethylene, developmental exposure and adult disease, autoimmune
Trichloroethylene (TCE) is a halocarbon best known for its use as an industrial solvent, especially popular as a metal degreaser. Because of improper disposal over the years, TCE has contaminated many of the water systems in the US. Based on likelihood of exposure and an increasing appreciation of its toxicity TCE is on the list of 90 chemicals selected from the 85 000 chemicals in the Toxic Substances Control Act) Inventory as having the highest potential for exposure and hazard (US EPA Office of Pollution Prevention and Toxics, 2014).
TCE is classified as carcinogenic in humans (US Department of Health and Human Services, 2015). However, an even more sensitive outcome associated with TCE exposure in humans is immunotoxicity (US EPA, 2011). Specifically, chronic TCE exposure in adults (occupational or environmental) has been linked to a variety of autoimmune and other hypersensitivity diseases including lupus, scleroderma, hepatitis, and diabetes (Byers et al., 1988; Czirjak et al., 1994; Dubrow and Gute, 1987; Flindt-Hansen and Isager, 1987; Gist and Burg, 1995; Hansen and Isager, 1988; Lockey et al., 1997; Saihan et al., 1978; Yanez Diaz et al., 1992). Most epidemiological studies of TCE immunotoxicity have focused on adult occupational exposure since it is easier to document, and often involves relatively high exposure levels. This does not exclude environmental TCE contamination from playing a role in what would be considered idiopathic disease. However, this connection has been more difficult to document since people newly diagnosed with an autoimmune disease are rarely assessed for exposure to TCE, or any other environmental chemical.
The health hazards associated with environmental TCE exposure may be increased for particularly susceptible populations. For example, sensitivity to several immunotoxicants (eg, lead and tributyltin) has been shown to be uniformly greater in animal models if exposure occurred during development compared with adulthood (Luebke et al., 2006). In fact, immune suppression in developmentally exposed offspring often occurred at toxicant doses that were ineffective in adults. Developmental sensitivity to toxicants has also been demonstrated in humans; prenatal exposure to polychlorinated biphenyls decreased the immune response to standard immunizations (Heilmann et al., 2006). Prenatal exposure to polybrominated diphenyl ethers produced a persistent decrease in lymphocyte numbers (Leijs et al., 2009). Aside from immune suppression, there is increasing evidence that adult onset autoimmune disease can be triggered by pre- and early postnatal toxicant exposure (Colebatch and Edwards, 2011; Langer, 2010).
Developmental exposure to TCE in the environment can occur through several routes. Due to its lipophilicity (log Kow = 2.61), TCE accumulates in breast milk. One study showed that 100% of breast milk samples from 4 U.S. urban areas had detectable levels of TCE (ATSDR, 2014). Another more recent study detected TCE in 7 of 20 breast milk samples from mothers living in Nogales, Arizona (Beamer et al., 2012). TCE exposure is also a possible concern for bottle-fed infants because they may ingest more TCE-contaminated drinking water on a bodyweight basis than adults. The functional consequences of gestational and early life TCE exposure have primarily been examined in the context of neurotoxicity (Gist and Burg, 1995). However, children continuously exposed for 3–19 years beginning in utero to a water supply contaminated with solvents (with TCE being the predominant toxicant [267 μg/l]) had altered ratios of T cell subsets and increased levels of autoantibodies (Byers et al., 1988). However, autoimmune disease was not assessed.
The autoimmune-promoting effects of TCE have been studied extensively in adult female MRL+/+ mice because their sex and ill-defined genetic predisposition for autoimmunity mimic autoimmune disease development in humans. We and others have shown that exposure to TCE in the MRL mouse model results in expansion of memory CD4+ T cells, serum anti-liver antibodies, and T cell-mediated liver pathology commensurate with human idiopathic Autoimmune hepatitis (AIH) (Cai et al., 2007; Gilbert et al., 2006). We have shown that continuous exposure to TCE in mice (gestation, lactation and early life) generated CD4+ T cell alterations and early signs of tissue inflammation (Blossom et al., 2008; Blossom and Doss, 2007). These experiments were not extended past 6–8 weeks of age, and although they detected early signs of liver inflammation, they did not assess actual autoimmune disease. This study was designed to provide such an assessment. We tested whether gestation/lactation/early life exposure to TCE at a concentration 10 000-fold lower than that shown to be effective for adult exposure could alter the immune system and trigger autoimmune disease.
MATERIALS AND METHODS
Mice and TCE exposure
Developmental exposure to TCE has been described (Blossom and Doss, 2007). Following stratified randomization, 30 female MRL+/+ mice (8 weeks of age; Jackson Laboratories, Bar Harbor, Maine) were paired with 8-week-old male MRL+/+ mice (2 females and 1 male/cage), and divided into 3 groups that were given water with 0, 0.05, or 500 μg/ml TCE (10 dams per group). Maternal exposure to vehicle or TCE-containing drinking water continued at the birth of the pups. Thus, the pups were exposed from gestational day 0 to postnatal day (PND) 0 in utero, and then from PND 0 to PND 21 via lactation. Once the female pups were weaned at PND 21 they were exposed to TCE directly in their drinking water until PND 154. Half of the female pups (8/treatment group were euthanized on PND 154). The other half of the female pups were retained, and given drinking water without TCE for the duration of the experiment, ie, PND 259 (8/treatment group). At PND 259 the mice were at about the same age as mice we have shown previously to develop AIH following adult only exposure to TCE (Gilbert et al., 2009).
Controls were given water containing only 1% Alkamuls EL-620, the reagent used to solubilize the TCE. All the drinking water was Ultrapure unchlorinated to assure that chlorination by-products do not confound the results. The TCE-containing drinking water was changed 3 times/week to offset degradation of TCE. The TCE concentration of 500 μg/ml approximates human occupational exposure. The lower TCE concentration of 0.05 μg/ml (aka 50 ppb) should yield a total mouse exposure approximating human environmental exposure. Both female breeders and resulting female offspring were weighed weekly and water consumption was monitored. TCE exposure (μg/kg/d) was based on the average amount of TCE-containing water consumed per cage (2–4 mice/cage) divided by the average mouse weight per cage and a previously calculated 20% degradation of TCE in the water bottles. Error bars represent cage variation. All studies were approved by the Animal Care and Use Committee at the University of Arkansas for Medical Sciences.
Pathology
Liver and kidney tissue harvested at PND 259 was stained with hematoxylin and eosin (H&E) and examined for pathology. Liver sections were examined microscopically and scored in a blinded manner by a veterinary pathologist for the severity of inflammation and fibrosis based on a 4-point scale (0–3), ranging from no change to severe, respectively) as described in Gilbert et al. (2009). Kidney sections were examined for 4 criteria, each with individual scores ranging from 1 to 4, for a total possible score of 13. These included (i) lymphoplasmacytic infiltrate with scores of: (1) fewer than 3 foci, no nodule formation, fewer than 5 layers, (2) more than 3 foci, >5 layers or nodules, (3) affects >25% of section but <50%, and (4) affects >50% of section; (ii) Tubular regeneration with scores of: (1) fewer than 3 foci, (2) more than 3 foci but < 25% of tubules, (3) affects >25% of tubules but <50%, and (4) affects >50% of tubules; (iii) cystic glomeruli: dilation of bowman’s space: no scores were greater than (1) focal lesion; and (iv) tubular protein with scores of: (1) fewer than 3 foci, (2) affects more than 3 foci, but <10% of tubules, (3) affects >25% of tubules but <50%, and (4) affects >50% of tubules. Liver pathology score was based on lymphoplasmacytic infiltrate ranging from 1 to 4 scored as: (1) focal or fewer than 3 layers of inflammatory cells; (2) more than 3 layers of cells and formation of nodules; (3) multiple nodules, or affects 5%–10% of the biliary region; (4) affects >10% of biliary region.
Serological markers of autoimmunity
Blood was collected from the retro-orbital sinus from individual mouse at study termination. Blood was allowed to clot at room temperature for 1 h and centrifuged at 1000 × g for 30 min. The sera were collected and stored at −20 °C until assay. Relative levels of Antinuclear antibodies (ANAs), specifically antisingle-stranded DNA (ssDNA) were determined by ELISA as described previously in Blossom and Doss (2007). Antigen preparation: denatured calf thymus DNA (1 mg/ml from Sigma) was mixed with reacti-bind DNA coating solution (Pierce Biotechnology, Rockford, Illinois) and incubated in a glass tube on a rotator for 10 min before adding the solution to wells of a 96-well plate. Following an overnight incubation at 4 °C, the plates were washed with a solution containing 1× PBS and 0.5% Tween-20 (Sigma) and blocked by adding 0.2 ml/well 1× PBS and 10% FCS. The plates were washed and the serum samples (1:100) were added to the wells (0.1 ml/well) overnight at 4 °C. Polyclonal biotinylated goat-antimouse immunoglobulin (Sigma) was diluted 1:1000 and added to the plates for 1 h at room temperature. The plates were developed with extravidin alkaline phosphatase and its substrate (p-nitrophenol) and measured by and ELISA reader at an absorbance of 405 nm.
Quantitative reverse transcriptase polymerase chain reaction assessment of T cell cytokines
Fluorescence-based quantitative reverse transcriptase polymerase chain reaction (qRT-PCR) was conducted to measure mRNA expression of T cell cytokines Interferon-gamma (ifng), Tumor Necrosis Factor-alpha (tnfa), Leukemia inhibitory factor (lif), Interleukin-4 (il4), and Interleukin-2 (il2). RNA was isolated from naïve or effector/memory CD4+ T cells as described (Gilbert et al., 2012). Fold differences (log2) in expression were determined using expression levels of resting (unactivated) CD4+ T cells of the appropriate subset of control mice as the control (1×) expression level.
Antibody production
Using previously described methodology (Gilbert et al., 2009), microsomal liver protein (30 µg) obtained from an untreated MRL+/+ mouse was separated on 12% SDS-PAGE, electrotransferred onto nitrocellulose, and subsequently probed with sera (1:500) obtained from control or TCE-treated MRL+/+ mice followed by horse radish peroxidase (HRP)-conjugated polyclonal goat antimouse IgG (1:4000). Densitometric analysis of mouse myeloma IgG (mIgG) run in adjoining lanes and detected by the HRP-conjugated polyclonal goat antimouse IgG was used to normalize exposure times for the individual Western blots. Prior to use in the Western blots, any mouse Ig present in the liver preparation was removed by immunoprecipitation in order to avoid confounding the results.
Phenotypic analysis of spleen cells
When the dams or female offspring were sacrificed at the different time points Spleens were removed from mice at study termination, minced to a cell suspension, and washed thoroughly with saline to remove red cells and debris. Total spleen cell numbers for individual spleens were determined by a Moxi Automated Cell Counter (Orflo, Ketchum, Idaho). Methodology for flow cytometry and analysis has been described in detail previously in Blossom et al. (2007). The spleen cell preparations for individual mice were assessed for percentages of CD4+ T cells, CD8+ T cells, and B cells, and percent of CD4+ and CD8+ T cells that were also CD62Ll°. Monoclonal antibodies were purchased from Affymetrix eBioscience (Santa Clara, California). Freshly isolated splenocytes were stained with combinations of fluorescein isothiocyanate antiCD8 (clone 53-6.7), allophycocyanin antiCD4 (clone GK 1.5), and phycoerytherin antiB220 (clone RA3-6B2). Each monoclonal antibody was titrated prior to use to determine the optimal working concentration. Monoclonal antibodies and cells (1 × 10⁵ per well) were inclubated for 30 min at 4 °C. The phenotypic analysis of 30 000 events per sample was carried out using a CyFlow ML (Partec GmbH, Munster, Germany). Data were analyzed by FCS Express (DeNovo Software) and presented as mean percentage ± SDs. Fluorescence Minus One controls, and isotype Ig controls were included.
Statistics
The data are presented as means ± SDs. Assays were conducted using samples from 8 to 12 individual mice per treatment group. Differences between experimental groups were tested first with 1-way analysis of variance (ANOVA). Where the F test was significant, subsequent pairwise contrasts were tested using a 2-sample t test by a Holm procedure in which pairwise contrasts were made relative to the control values. Pairwise comparison of liver pathology scores were conducted using the non-parametric Wilcoxin-Mann-Whitney test. The threshold for statistical significance was set at α = 0.05.
RESULTS
General Effects
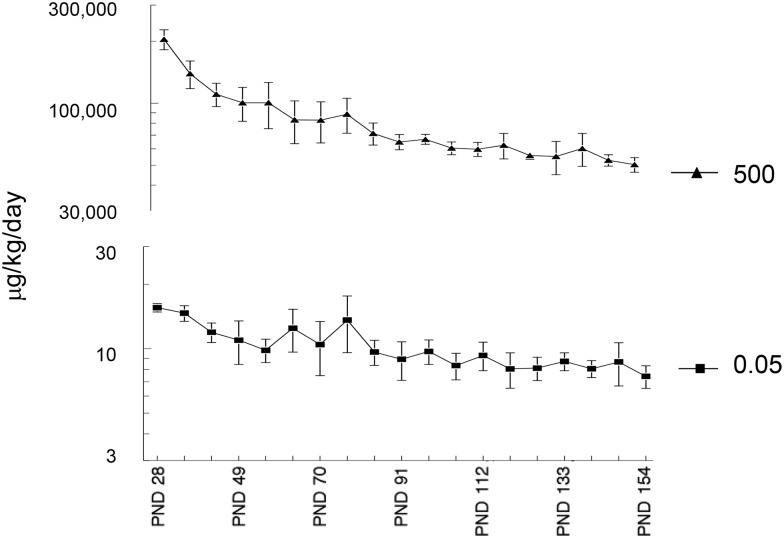
Any effects of the gestational and early life TCE exposure could not be attributed to overt toxicity in the dams; there was no difference in dam body weight, food, and water consumption, gestational time length, or litter size among any group (data not shown). Similarly, the TCE exposure at the concentrations used did not alter subsequent weight gain in the offspring (data not shown). The levels of TCE exposure in the offspring based on water consumption and body weight over time are shown in Figure 1.
FIG. 1.
Level of direct TCE exposure in offspring. TCE exposure (μg/kg/d) from weaning at PND 21 to PND 154 was calculated in the offspring based on average body weight over time and average consumption of water containing either 500 or 0.05 μg/ml TCE. The offspring were also exposed to TCE during gestation and lactation due to the presence of TCE (500 or 0.05 μg/ml) in maternal drinking water.
Splenic Cellularity
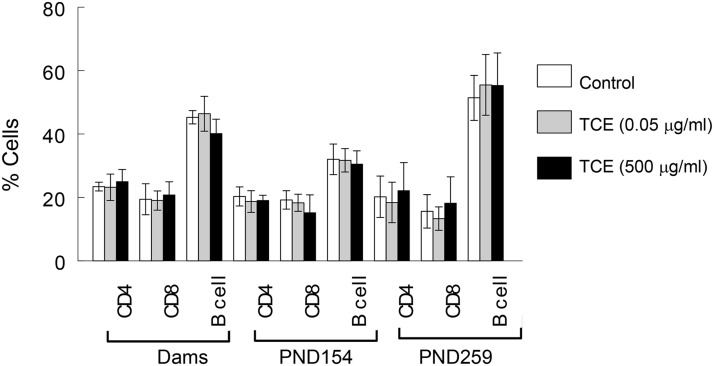
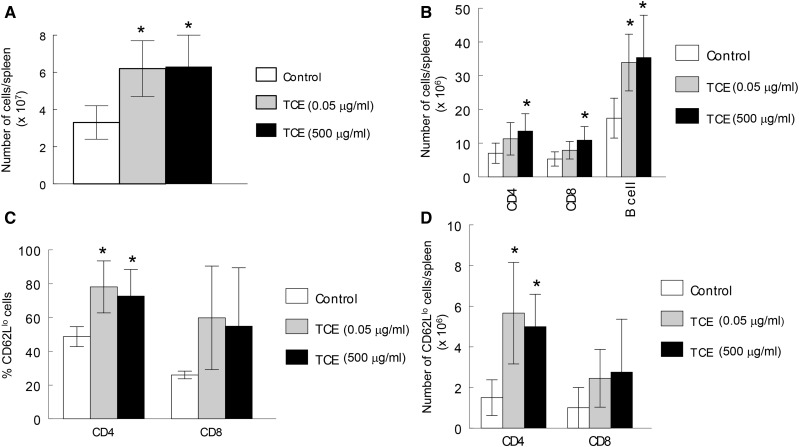
Changes in the cellular composition of the spleen were also examined in both dams and offspring as a means of charting TCE-induced alterations in the immune system. When the dams were examined shortly after their offspring were weaned, the TCE exposure had not changed the cellular composition of the spleen (Figure 2). Similarly, TCE did not alter the percentages of total splenic CD4+ T cells, CD8+ T cells or B cells in the offspring, regardless of concentration or time point. TCE exposure did, however, increase total spleen cell numbers (Figure 3A). Thus, although percentages of CD4+ T cells, CD8+ T and B cells were not altered by TCE, the total number of these cells in the spleen was increased in mice exposed to 500 μg/ml TCE (Figure 3B). Late-occurring changes in peripheral CD4+ T cells have been observed following adult exposure to TCE. These include expansion of the effector/memory (CD62Ll°) subset of peripheral CD4+ T cells (Gilbert et al., 2006). This effect was observed in this study in mice exposed to either concentration of TCE, despite exposure cessation at PND 154 (Figure 3C). Because of the increase in spleen cell numbers caused by TCE, the absolute number of CD4+ CD62Ll° T cells was also increased by TCE exposure (Figure 3D).
FIG. 2.
TCE exposure did not alter spleen cell percentages. Spleen cellularity in the dams 1 week after their offspring were weaned, and in the female offspring at PND 154 and PND 259 was determined by flow cytometry and represented as a percentage of spleen cells.
FIG. 3.
Despite cessation, TCE exposure increased number of total and effector/memory CD4+ T cells. Total spleen cell numbers in the female offspring at PND 259 were measured (A). Based on these results the spleen cells percentages described in Figure 2 were represented as cell numbers/spleen (B). The percentage of effector/memory (CD62Ll°) CD4+ and CD8+T cells in the spleens were also measured, and are presented as percentages (C), and total cell numbers (D). *Statistically different from control values.
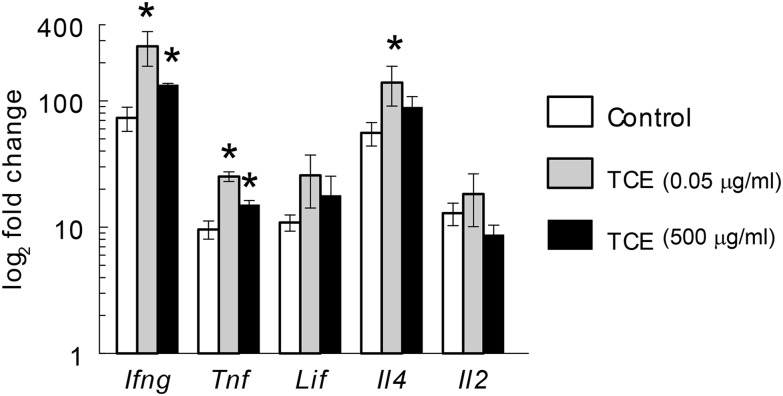
In line with a TCE-induced increase in the percentages of effector/memory CD4+ T cells, splenic CD4+ T cells isolated at PND 259 from the mice exposed to TCE, regardless of concentration, demonstrated increased expression of proinflammatory cytokines Ifng, Il4, and Tnf following activation in vitro (Figure 4). Thus, once triggered, the time-dependent TCE-induced expansion of effector/memory CD4+ T cells, and production of proinflammatory cytokines proceeded even in the absence of continued TCE exposure.
FIG. 4.
Despite cessation, TCE exposure altered CD4+ T cell gene expression. Expression of several cytokine genes in CD4+ T cells isolated from the offspring of the female mice at PND 259 and activated in vitro was measured by qRT-PCR. *Statistically different from control values.
TCE-induced Liver Pathology
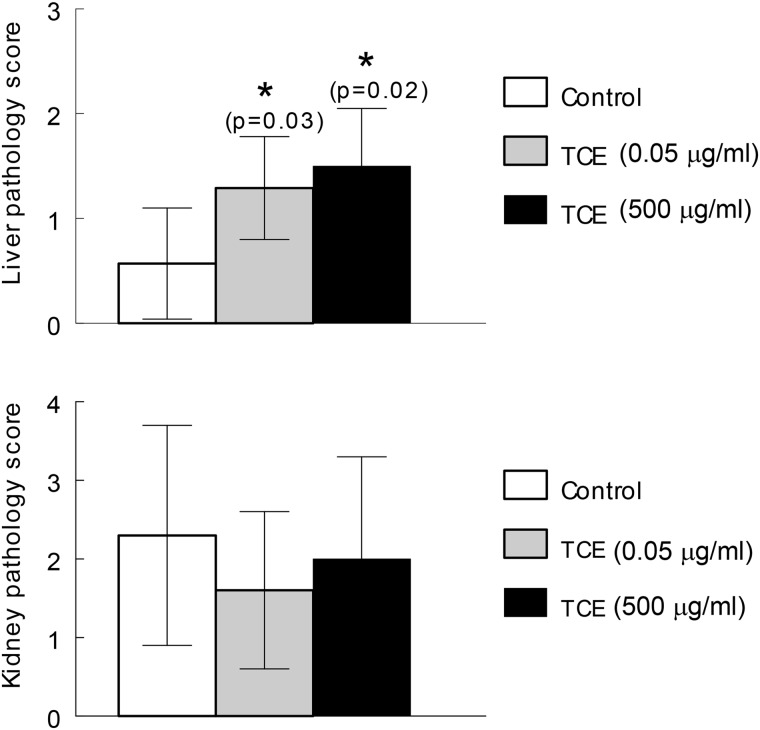
Histopathology in the form of lymphoplasmacytic portal infiltrate and lobular inflammation in the liver was observed at PND 259 even though TCE exposure ceased at PND 154. The liver pathology commensurate with AIH was observed in mice exposed to TCE at either occupational (500 μg/ml) or environmental (0.05 μg/ml) levels (Figure 5). As observed previously in mice exposed to TCE only during adulthood, the gestational and early life exposure to TCE did not generate significant kidney pathology such as might be expected in lupus nephritis. Thus, gestational and early life exposure to 500 μg/ml TCE, similar to adult-only exposure to the same concentration of TCE, generated liver, but not kidney pathology. Liver pathology was also generated in response to gestational and early life exposure to 0.05 μg/ml of TCE, a concentration 10 000-fold lower than the lowest concentration of TCE shown to cause hepatitis following adult-only exposure. This finding confirms the special sensitivity of the developing immune system to TCE exposure, and shows that the immune pathology initiated by gestational and early life exposure to TCE was not prevented by exposure cessation.
FIG. 5.
Cessation does not prevent TCE-induced liver pathology. Even though TCE exposure ended at PND 154, liver pathology commensurate with AIH was observed at PND 259. Pairwise comparison of liver pathology scores were conducted using the nonparametric Wilcoxon-Mann-Whitney test. *P values from Wilcoxon-Mann-Whitney test are reported. Kidney pathology was not increased by TCE exposure under these conditions.
Other Indicators of TCE-Induced Autoimmunity
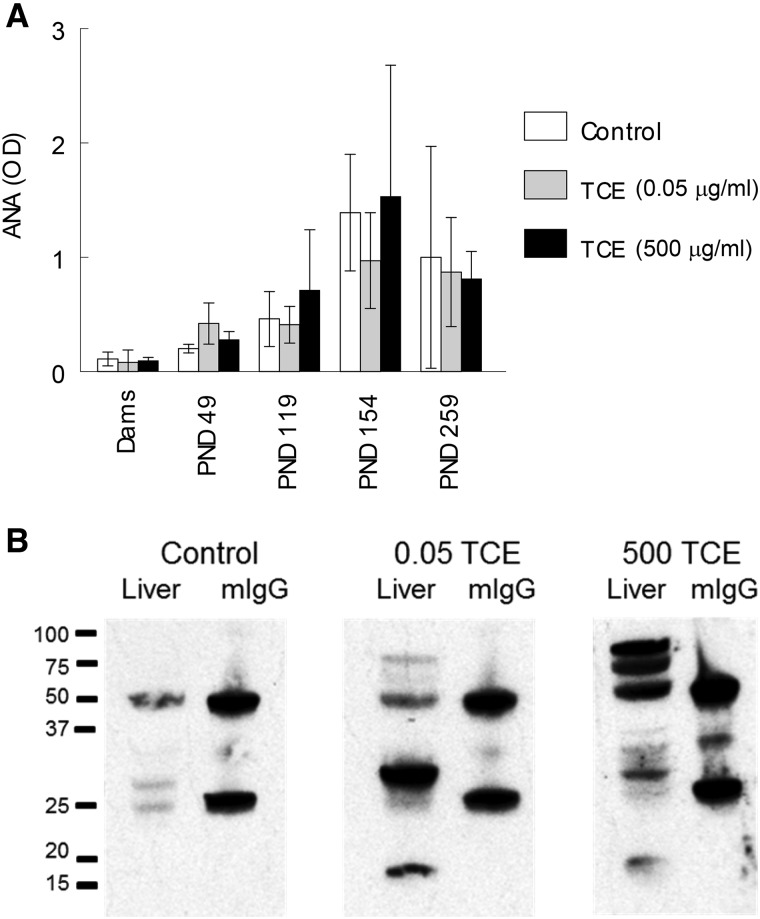
Also examined as a potential marker of autoimmunity was serum levels of one type of ANA, namely antissDNA antibodies. Although we have reported that higher concentrations of TCE can increase ANA levels early in the exposure, later effects of TCE on ANA levels can be difficult to detect as the baseline levels of these autoantibodies increase spontaneously in female MRL+/+ mouse as they age. In this study the doses of TCE used were not sufficient to increase the level of antissDNA antibodies, even at the earlier time points (Figure 6A). Thus, TCE did not increase antissDNA antibody concentrations beyond their already high baseline levels in the MRL+/+ mice.
FIG. 6.
Effects of TCE on other autoimmune markers. A, Serum levels of ANA (ssDNA) were measured at different time points. B, Pooled sera from 8 female mice collected at PND 259 following exposure to 0.05 or 500 μg/ml TCE until PND 154 reacted with liver protein separated by SDS-PAGE. Mouse mIgG was run in adjoining lanes and detected by a shared secondary antibody (HRP-labeled goat antimouse IgG) in order to normalize exposure times.
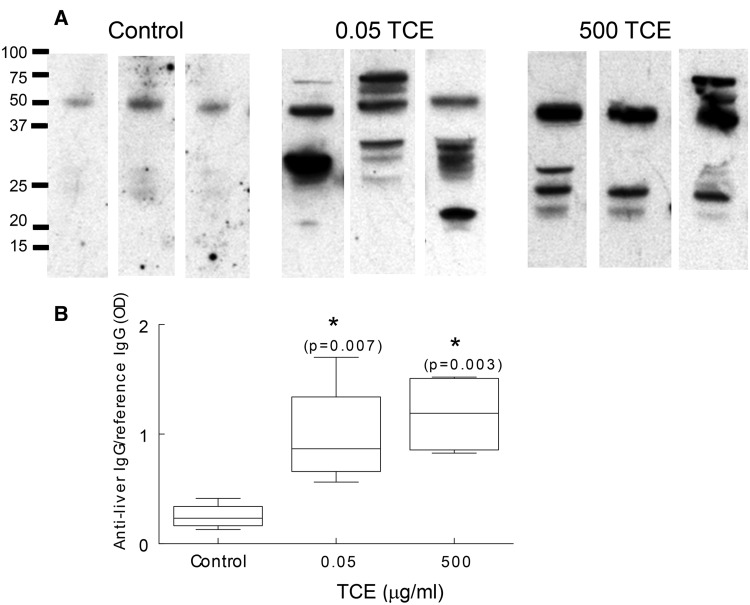
Based on the results of previous studies, we also examined sera for the presence of antiliver antibodies as another marker of AIH (Gilbert et al., 2009). Microsomal liver protein obtained from an untreated female MRL+/+ mouse was separated by SDS-PAGE and probed with pooled sera obtained from control or TCE-treated MRL+/+ mice obtained at PND 259. Mouse mIgG run in adjoining lanes, and recognized by the secondary antimouse IgG, was used to normalize exposure times for the individual Western blots. As shown in Figure 6B sera from control mice at PND 259 contained little detectable antiliver antibodies. In contrast, sera obtained at PND 259 from mice exposed to 500 μg/ml until PND 154 contained numerous antibodies that reacted with liver proteins at several molecular weights ranging from approximately 75 to 16 kDa. Similarly, total pooled sera from all mice exposed to 0.05 μg/ml TCE until PND 154 reacted with liver proteins of different molecular weights. Since the results using group pooled sera could reflect the antiliver antibody production of a single outlier mouse, additional Western blotting was done using sera from 3 sets of paired mice from each treatment group. As shown in Figure 7A sera from control mice contained little antiliver antibody. In contrast, samples from 3 pairs of mice/treatment group obtained at PND 259 showed that mice exposed to 0.05 or 500 μg/ml TCE in drinking water until PND154 generated antibodies that recognized a range of liver proteins. Thus, the sera from mice exposed to TCE, regardless of concentration, demonstrated a diverse but robust antiliver antibody repertoire that appeared to recognize liver proteins of different molecular weight. Densitometric analysis of mouse mIgG run in adjoining lanes was used to normalize exposure times for the individual Western blots, and demonstrate the significant increase in the total amount of antiliver antibodies in the TCE-treated mice (Figure 7B).
FIG. 7.
TCE exposure increased antiliver antibody production. A, Sera from pairs of mice in each treatment group collected at PND259 was pooled. Three representative pairs of sera/group were reacted with liver protein by Western blotting as described in Figure 6B. B, Densitometric analysis of total antiliver antibodies was normalized to mouse mIgG run in adjoining lanes as described in Figure 6. The F test significance (P = .0046) of the 1-way ANOVA was followed by a Holm procedure in which pairwise contrasts were made relative to the control values. *Significant with corresponding Holm P values.
DISCUSSION
Continuous exposure to 0.05 mg/ml TCE in drinking water from gestation to PND 154 was sufficient to promote later life autoimmune disease detected in female MRL+/+ mice at PND 259. In this study, autoimmunity in the form of AIH was measured at the level of tissue pathology, and at the level of autoantibody production (liver reactive antibodies). The TCE-induced autoimmunity was detected 15 weeks after exposure ended, indicating that the immune liver pathology was not prevented by exposure cessation.
The finding that TCE administered in the drinking water can promote autoimmunity has important consequences for human health. Human exposure to TCE is not unusual, and can occur through several mechanisms. For example, TCE was recently detected in 17.5% of individuals living over a TCE-containing plume in Texas, most likely due to vapor intrusion (Archer et al., 2015). This route of exposure is not without risks; adverse birth outcomes have been correlated with TCE exposure through vapor intrusion from contaminated soil in New York State (Forand et al., 2012). TCE can also be found in drinking water. A National Water-Quality Assessment conducted by the U.S. EPA’s Office of Ground Water and Drinking Water detected TCE in 11.6% of urban wells, and determined that 8.19% of the population were served by ground and surface water systems in which TCE levels exceeded the Maximum Contaminant Level (MCL) of 5 ppb or 0.005 μg/ml (US EPA Office of Ground Water and Drinking Water, 2002). People using private wells (the source of drinking water for 15% of the people in the United States) may be at an especially high risk for TCE exposure. A recent assessment of private wells in rural Maryland found that 50 out of 300 wells tested had levels of TCE above 0.005 μg/ml, and as high as 0.26 μg/ml (DiCintio, 2016). A sampling of 615 wells (50% of which were used for drinking water) in the karst aquifers of northern Puerto Rico revealed that 26% contained TCE at concentrations that exceeded 0.005 μg/ml (Yu et al., 2015). Consequently, it is likely that chronic exposure to levels of TCE above 0.005 μg/ml occurs for a subset of the population.
Up to 18% of the drinking water supply sources in the United States that are tested annually by the EPA are contaminated with TCE. (ATSDR, 2014) The mean, 95th percentile, and maximum concentrations of the positive samples were 0.003, 0.013, and 0.159 μg/ml (ppb), respectively in groundwater, and 0.005, 0.028, and 0.05 μg/ml, respectively in the surface water. To put these levels in perspective the EPA MCL for TCE in drinking water is 0.005 μg/ml, while some states (eg, New Jersey and Connecticut) have set their own MCL as low as 0.001 μg/ml (Connecticut Department of Public Health, 2014; New Jersey Department of Environmental Protection, 2005).
The ATSDR has estimated that even when environmental levels of TCE in drinking water are under 0.005 μg/ml, the general population can be exposed to TCE at cumulative (ingestion and inhalation) levels of up to 53 μg/d (ATSDR, 2014). This translates into approximately 4.8 μg/kg/d for an 11 kg toddler, and 0.75 μg/kg/d for a 70 kg adult. The cumulative exposure can be increased significantly when environmental levels of TCE are above the MCL. For example, in a recent survey TCE has been found in California drinking water sources with an average detected concentration ranging from 0.014 to 0.020 μg/ml in the contaminated samples (Williams et al., 2002). Assuming a level of 0.02 μg/ml for TCE in contaminated drinking water, a cumulative exposure to TCE from ingestion, inhalation, and dermal contact, an individual could encompass more than 120 μg/d. This translates into 10.9 μg/kg/d for a toddler and 1.7 μg/kg/d for an adult, levels that would be even higher if the calculations were based on maximum rather than average contamination levels. In this study, the direct TCE exposure of the offspring, based totally on ingestion, ranged from an average of 15.5 ± 0.7 μg/kg/d at PND 21 to 7.4 + 0.9 μg/kg/d at PND154 for the mice given water with 0.05 μg/ml TCE. This means that the TCE exposure levels for those mice were not outside the realm of actual human exposure to the chemical. Environmental TCE exposure is not just an issue for adults. A study of TCE in breast milk in an area of Arizona with a mean concentration of 0.006 μg/ml TCE in the water supply led to the estimate that 5% of breast-fed infants in that area were receiving TCE in excess of the U.S. EPA Reference Dose (Beamer et al., 2012).
The tissue pathology commensurate with AIH in the mice exposed to TCE was accompanied by the development of autoantibodies that recognized liver proteins. The generation of antiliver antibodies in the control mice, despite their well-known proclivity to generate ANA, was minimal. Interestingly, similar to patients with autoimmune disease, a diverse autoantibody profile was detected in the mice exposed to TCE. Patients with type I diabetes demonstrate heterogeneous autoantibody patterns against multiple autoantigens including tyrosine phosphatases, GAD65 and cytoplasmic islet cell antigens (Seissler et al., 1998). The phenomenon of epitope spreading in which the autoantibody repertoire becomes more diverse over time is a feature of many autoimmune diseases including SLE, multiple sclerosis, pemphigus, bullous pemphigoid, and rheumatoid arthritis (Cornaby et al., 2015; Hashimoto et al., 2011; Kwon et al., 2016; Quintana et al., 2014; Sokolove et al., 2012). It has also been noted in patients with AIH (Hintermann et al., 2011). Autoantibodies reactive with liver-kidney-microsomal antigens and/or soluble liver antigen are used for diagnostic purposes, and are now known to encompass autoantibodies that recognize several liver proteins including CYP2D6, filamentous actin, vimentin, desmin, forminino-transferase cyclodeaminase, and UDP-glucuronosyl-transferase.
Although the reversibility of xenobiotic toxicity is very diverse, depending on the chemical and its mechanism of action, it generally occurs less often if the chemical is encountered during development. No recovery from vinyl chloride-induced carcinogenicity in mice occurred after only 1 month of vinyl chloride exposure, with younger animals (2-months old) being even more susceptible than animals 6- or 12-months old at the initiation of exposure (Bhandari, 1983). Gestational-only exposure to mercury in mice has been shown to cause persistent immune dysregulation that last until adulthood (Pilones et al., 2009). Moderate prenatal alcohol exposure induced later-life immune dysfunction in rats (Terasaki and Schwarz, 2016).
The durability of the effects triggered by TCE exposure are still being defined. One of the most commonly reported negative health effects of TCE is a delayed-type hypersensitivity response found in adults exposed to occupational levels of TCE (Watanabe, 2011). This response is accompanied by severe dermatitis, hepatitis, and positive patch test results for TCE and its main metabolite TCAH (trichloroacetaldehyde hydrate) (Huang et al., 2015). It is usually reversible if the patient avoids further contact with TCE, and is treated with glucocorticoids. This reversal encompasses both the dermatitis and the hepatitis associated with the disorder. However, the immune pathology initiated by occupational TCE exposure is sometimes irrevocable, resulting in the death of approximately 20% of patients with TCE-induced hypersensitivity, even after they have been removed from the workplace (Jung et al., 2012; Tan et al., 1997; Xu et al., 2009). Little is known about the reversibility of immune dysregulation caused by developmental TCE exposure. The results of this study showed that even at environmental exposure levels, the immune pathology triggered by developmental and early life TCE exposure was still detectable after exposure cessation. It is extremely unlikely that TCE was still present in measurable quantities in the offspring by PND 259. TCE has a terminal biological half-life of 120 min in rodents (Bruckner et al., 1989). This increases the likelihood that the TCE-induced response observed in the study is truly autoimmune rather than a hypersensitivity response against persistent chemical in the body. Along these lines, the liver proteins targeted by the sera of the TCE-treated mice in this study came from an untreated mouse, suggesting that the antiliver antibodies are evidence of an autoimmune disease rather than recognition of TCE haptenated proteins.
This study presents novel findings demonstrating exposure of female MRL+/+ mice to environmentally relevant levels of TCE following developmental exposure spanning gestation, lactation, and early life generated biomarkers of autoimmunity and expression of CD4+ T cell proinflammatory cytokines similar to that found following adult exposure to higher concentrations of TCE. The fact that these observations were observed even after a approximately 15-week period of exposure cessation underscores the need for additional mechanistic studies to understand how these long-lasting effects persist long after toxicant exposure is discontinued.
ACKNOWLEDGEMENTS
We thank Keen Maher and Kanan Vyas for excellent technical assistance.
FUNDING
This work was supported by grants from the Arkansas Biosciences Institute, the National Institutes of Health (R01ES021484), the Organic Compounds Property Contamination class action settlement (CV 1992-002603), and the UAMS Translational Research Institute (National Institutes of Health UL1RR029884).
REFERENCES
- Archer N. P., Bradford C. M., Villanacci J. F., Crain N. E., Corsi R. L., Chambers D. M., Burk T., Blount B. C. (2015). Relationship between vapor intrusion and human exposure to trichloroethylene. J. Environ. Sci. Health A Tox. Hazard. Subst. Environ. Eng. 50, 1360–1368. [DOI] [PMC free article] [PubMed] [Google Scholar]
- ATSDR. (2014). Todd, G.D and Wohlers, D.W. Toxicological Profile for Trichloethylene, US Department of Health and Human Services, Public Health Service, Agency for Toxic Substances and Disease Registry.
- Beamer P. I., Luik C. E., Abrell L., Campos S., Martinez M. E., Saez A. E. (2012). Concentration of trichloroethylene in breast milk and household water from Nogales, Arizona. Environ. Sci. Technol. 46, 9055–9061. [DOI] [PMC free article] [PubMed] [Google Scholar]
- Bhandari J. C. (1983). Non-reversibility of vinyl chloride carcinogenesis in rodents. Toxicol. Pathol. 11, 181–187. [DOI] [PubMed] [Google Scholar]
- Blossom S. J., Doss J. C. (2007). Trichloroethylene alters central and peripheral immune function in autoimmune-prone MRL(+/+) mice following continuous developmental and early life exposure. J. Immunotoxicol. 4, 129–141. [DOI] [PubMed] [Google Scholar]
- Blossom S. J., Doss J. C., Gilbert K. M. (2007). Chronic exposure to a trichloroethylene metabolite in autoimmune-prone MRL+/+ mice promotes immune modulation and alopecia. Toxicol. Sci. 95, 401–411. [DOI] [PubMed] [Google Scholar]
- Blossom S. J., Doss J. C., Hennings L. J., Jernigan S., Melnyk S., James S. J. (2008). Developmental exposure to trichloroethylene promotes CD4+ T cell differentiation and hyperactivity in association with oxidative stress and neurobehavioral deficits in MRL+/+ mice. Toxicol. Appl. Pharmacol. 231, 344–353. [DOI] [PubMed] [Google Scholar]
- Bruckner J. V., Davis B. C., Blancato J. N. (1989). Metabolism, toxicity, and carcinobenicity of trichloroethylene. Crit. Rev. Toxicol. 20, 31–50. [DOI] [PubMed] [Google Scholar]
- Byers V. S., Levin A. S., Ozonoff D. M., Baldwin R. W. (1988). Association between clinical symptoms and lymphocyte abnormalities in a population with chronic domestic exposure to industrial solvent-contaminated domestic water supply and a high incidence of leukemia. Cancer Immunol. Immunother. 27, 77–82. [DOI] [PMC free article] [PubMed] [Google Scholar]
- Cai P., Konig R., Khan M. F., Kaphalia B. S., Ansari G. A. (2007). Differential immune responses to albumin adducts of reactive intermediates of trichloroethene in MRL+/+ mice. Toxicol. Appl. Pharmacol. 220, 278–283. [DOI] [PMC free article] [PubMed] [Google Scholar]
- Colebatch A. N., Edwards C. J. (2011). The influence of early life factors on the risk of developing rheumatoid arthritis. Clin. Exp. Immunol. 163, 11–16. [DOI] [PMC free article] [PubMed] [Google Scholar]
- Connecticut Department of Public Health. (2014). Maximum Contaminant Level (MCL) Determination for Trichloroethylene. Environmental and Occupational Health Assessment Program. http://www.ct.gov/dph. Accessed March 31, 2017.
- Cornaby C., Gibbons L., Mayhew V., Sloan C. S., Welling A., Poole B. D. (2015). B cell epitope spreading: Mechanisms and contribution to autoimmune diseases. Immunol. Lett. 163, 56–68. [DOI] [PubMed] [Google Scholar]
- Czirjak L., Pocs E., Szegedi G. (1994). Localized scleroderma after exposure to organic solvents. Dermatology 189, 399–401. [DOI] [PubMed] [Google Scholar]
- DiCintio D. (2016). The Investigation of Groundwater Contamination in Wicomico County's Morris Mill Community. J Environ Health 78, 16–19. [PubMed] [Google Scholar]
- Dubrow R., Gute D. M. (1987). Cause-specific mortality among Rhode Island jewelry workers. Am. J. Ind. Med. 12, 579–593. [DOI] [PubMed] [Google Scholar]
- Flindt-Hansen H., Isager H. (1987). Scleroderma after occupational exposure to trichloroethylene and trichlorethane. Toxicol. Lett. 95, 173–181. [PubMed] [Google Scholar]
- Forand S. P., Lewis-Michl E. L., Gomez M. I. (2012). Adverse birth outcomes and maternal exposure to trichloroethylene and tetrachloroethylene through soil vapor intrusion in New York State. Environ. Health Perspect. 120, 616–621. [DOI] [PMC free article] [PubMed] [Google Scholar]
- Gilbert K. M., Pumford N. R., Blossom S. J. (2006). Environmental contaminant trichloroethylene promotes autoimmune disease and inhibits T-cell apoptosis in MRL+/+ mice. J. Immunotox. 3, 263–267. [DOI] [PubMed] [Google Scholar]
- Gilbert K. M., Nelson A. R., Cooney C. A., Reisfeld B., Blossom S. J. (2012). Epigenetic alterations may regulate temporary reversal of CD4(+) T cell activation caused by trichloroethylene exposure. Toxicol. Sci. 127, 169–178. [DOI] [PMC free article] [PubMed] [Google Scholar]
- Gilbert K. M., Przybyla B., Pumford N. R., Han T., Fuscoe J., Schnackenberg L. K., Holland R. D., Doss J. C., MacMillan-Crow L. A., Blossom S. J. (2009). Delineating liver events in trichloroethylene-induced autoimmune hepatitis. Chem. Res. Toxicol. 22, 626–632. [DOI] [PubMed] [Google Scholar]
- Gist G. L., Burg J. R. (1995). Trichloroethylene–a review of the literature from a health effects perspective. Toxicol. Ind. Health 11, 253–307. [DOI] [PubMed] [Google Scholar]
- Hansen B. L., Isager H. (1988). A scleroderma-resembling disease-exposure to trichloroethylene and trichloroethane, is there a causal connection?. Ugeskr. Laeger. 150, 805–808. [PubMed] [Google Scholar]
- Hashimoto T., Tsuruta D., Dainichi T., Hamada T., Furumura M., Ishii N. (2011). Demonstration of epitope spreading in bullous pemphigoid: Results of a prospective multicenter study. J. Invest. Dermatol. 131, 2175–2177. [DOI] [PubMed] [Google Scholar]
- Heilmann C., Grandjean P., Weihe P., Nielsen F., Budtz-Jorgensen E. (2006). Reduced antibody responses to vaccinations in children exposed to polychlorinated biphenyls. PLoS Med. 3, e311.. [DOI] [PMC free article] [PubMed] [Google Scholar]
- Hintermann E., Holdener M., Bayer M., Loges S., Pfeilschifter J. M., Granier C., Manns M. P., Christen U. (2011). Epitope spreading of the anti-CYP2D6 antibody response in patients with autoimmune hepatitis and in the CYP2D6 mouse model. J. Autoimmun. 37, 242–253. [DOI] [PubMed] [Google Scholar]
- Huang Y., Xia L., Wu Q., Zeng Z., Huang Z., Zhou S., Jin J., Huang H. (2015). Trichloroethylene hypersensitivity syndrome is potentially mediated through its metabolite chloral hydrate. PLoS One 10, e0127101.. [DOI] [PMC free article] [PubMed] [Google Scholar]
- Jung H. G., Kim H. H., Song B. G., Kim E. J. (2012). Trichloroethylene hypersensitivity syndrome: A disease of fatal outcome. Yonsei. Med. J. 53, 231–235. [DOI] [PMC free article] [PubMed] [Google Scholar]
- Kwon E. Y., Cha G. S., Jeong E., Lee J. Y., Kim S. J., Surh C. D., Choi J. (2016). Pep19 drives epitope spreading in periodontitis and periodontitis-associated autoimmune diseases. J. Periodontal Res. 51, 381–394. [DOI] [PubMed] [Google Scholar]
- Langer P. (2010). The impacts of organochlorines and other persistent pollutants on thyroid and metabolic health. Front. Neuroendocrinol. 31, 497–518. [DOI] [PubMed] [Google Scholar]
- Leijs M. M., Koppe J. G., Olie K., van Aalderen W. M., de V. P., ten Tusscher G. W. (2009). Effects of dioxins, PCBs, and PBDEs on immunology and hematology in adolescents. Environ. Sci. Technol. 43, 7946–7951. [DOI] [PubMed] [Google Scholar]
- Lockey J. E., Kelly C. R., Cannon G. W., Colby T. V., Aldrich V., Livingston G. K. (1997). Progressive systemic sclerosis associated with exposure to trichloroethylene. J. Occup. Med. 29, 493–496. [PubMed] [Google Scholar]
- Luebke R. W., Chen D. H., Dietert R., Yang Y., King M., Luster M. I. (2006). The comparative immunotoxicity of five selected compounds following developmental or adult exposure. J. Toxicol. Environ. Health B Crit. Rev. 9, 1–26. [DOI] [PubMed] [Google Scholar]
- New Jersey Department of Environmental Protection. (2005). Federal and NJ State Primary and Secondary Drinking Water Standards as of February 2005, Division of Water Supply, Bureau of Safe Drinking Water.
- Pilones K., Tatum A., Gavalchin J. (2009). Gestational exposure to mercury leads to persistent changes in T-cell phenotype and function in adult DBF1 mice. J. Immunotoxicol. 6, 161–170. [DOI] [PubMed] [Google Scholar]
- Quintana F. J., Patel B., Yeste A., Nyirenda M., Kenison J., Rahbari R., Fetco D., Hussain M., O'Mahony J., Magalhaes S., et al. (2014). Epitope spreading as an early pathogenic event in pediatric multiple sclerosis. Neurology 83, 2219–2226. [DOI] [PMC free article] [PubMed] [Google Scholar]
- Saihan E. M., Burton J. L., Heaton K. W. (1978). A new syndrome with pigmentation, scleroderma, gynaecomastia, Raynaud’s phenomenon and peripheral neuropathy. Br. J. Dermatol. 99, 437–440. [DOI] [PubMed] [Google Scholar]
- Seissler J., de Sonnaville J. J., Morgenthaler N. G., Steinbrenner H., Glawe D., Khoo-Morgenthaler U. Y., Lan M. S., Notkins A. L., Heine R. J., Scherbaum W. A. (1998). Immunological heterogeneity in type I diabetes: Presence of distinct autoantibody patterns in patients with acute onset and slowly progressive disease. Diabetologia 41, 891–897. [DOI] [PubMed] [Google Scholar]
- Sokolove J., Bromberg R., Deane K. D., Lahey L. J., Derber L. A., Chandra P. E., Edison J. D., Gilliland W. R., Tibshirani R. J., Norris J. M., et al. (2012). Autoantibody epitope spreading in the pre-clinical phase predicts progression to rheumatoid arthritis. PLoS One 7, e35296.. [DOI] [PMC free article] [PubMed] [Google Scholar]
- Tan H. H., Tsu-Li C. M., Goh C. L. (1997). Occupational skin disease in workers from the electronics industry in Singapore. Am. J. Contact Dermat. 8, 210–214. [PubMed] [Google Scholar]
- Terasaki L. S., Schwarz J. M. (2016). Effects of moderate prenatal alcohol exposure during early gestation in rats on inflammation across the maternal-fetal-immune interface and later-life immune function in the offspring. J. Neuroimmune. Pharmacol. 11, 680–692. [DOI] [PMC free article] [PubMed] [Google Scholar]
- US Department of Health and Human Services National Toxicology Program. (2015). Report on Carcinogens: Monograph on Trichloroethylene. Office of the Report on Carcinogens. [PubMed]
- US Environmental Protection Agency. (2011). Toxicological Review of Trichloroethylene (CAS No. 79-01-6). In Support of Summary Information on the Integrated Risk Information System (IRIS).
- US EPA Office of Ground Water and Drinking Water. (2002). Occurrence summary and use support document for the six-year review of national primary drinking water regulations EPA-815-D-02-006.
- US EPA Office of Pollution Prevention and Toxics. (2014). TSCA Work Plan for Chemical Assessments: 2014 Update US EPA.
- Watanabe H. (2011). Hypersensitivity syndrome due to trichloroethylene exposure: A severe generalized skin reaction resembling drug-induced hypersensitivity syndrome. J. Dermatol. 38, 229–235. [DOI] [PubMed] [Google Scholar]
- Williams P., Benton L., Warmerdam J., Sheehans P. (2002). Comparative risk analysis of six volatile organic compounds in California drinking water. Environ. Sci. Technol. 36, 4721–4728. [DOI] [PubMed] [Google Scholar]
- Xu X., Yang R., Wu N., Zhong P., Ke Y., Zhou L., Yuan J., Li G., Huang H., Wu B. (2009). Severe hypersensitivity dermatitis and liver dysfunction induced by occupational exposure to trichloroethylene. Ind. Health 47, 107–112. [DOI] [PubMed] [Google Scholar]
- Yanez Diaz S., Moran M., Unamuno P., Armijo M. (1992). Silica and trichloroethylene-induced progressive systemic sclerosis. Dermatology 184, 98–102. [DOI] [PubMed] [Google Scholar]
- Yu X., Ghasemizadeh R., Padilla I., Irizarry C., Kaeli D., Alshawabkeh A. (2015). Spatiotemporal changes of CVOC concentrations in karst aquifers: Analysis of three decades of data from Puerto Rico. Sci. Total. Environ. 511, 1–10. [DOI] [PMC free article] [PubMed] [Google Scholar]


