

Abstract
Background
Selenium, an essential trace element, has been investigated as a potential cancer prevention agent. However, several studies have indicated that selenium supplementation may be associated with an increased risk of type 2 diabetes (T2D), although an equivocal relation of this nature requires confirmation.
Objective
We examined the association between baseline plasma concentrations of selenium and the prevalence of T2D, as well as whether participant characteristics or intake of other antioxidant nutrients modified this relation.
Methods
We conducted cross-sectional analyses of 1727 participants from the Selenium Trial, a randomized clinical trial of selenium supplementation for colorectal adenoma chemoprevention that had data for baseline selenium plasma concentrations, T2D status, and dietary intake. Logistic regression modeling was used to evaluate the associations between plasma selenium concentrations and prevalent T2D, adjusting for confounding factors. Heterogeneity of effect by participant characteristics was evaluated utilizing likelihood-ratio tests.
Results
Mean ± SD plasma selenium concentrations for those with T2D compared with those without T2D were 143.6 ± 28.9 and 138.7 ± 27.2 ng/mL, respectively. After adjustment for confounding, higher plasma selenium concentrations were associated with a higher prevalence of T2D, with ORs (95% CIs) of 1.25 (0.80, 1.95) and 1.77 (1.16, 2.71) for the second and third tertiles of plasma selenium, respectively, compared with the lowest tertile (P-trend = 0.007). No significant effect modification was observed for age, sex, body mass index, smoking, or ethnicity. Increased odds of T2D were seen among those who were in the highest tertile of plasma selenium and the highest category of intake of β-cryptoxanthin (P-trend = 0.03) and lycopene (P-trend = 0.008); however, interaction terms were not significant.
Conclusions
These findings show that higher plasma concentrations of selenium were significantly associated with prevalent T2D among participants in a selenium supplementation trial. Future work is needed to elucidate whether there are individual characteristics, such as blood concentrations of other antioxidants, which may influence this relation.
Keywords: selenium, supplementation, type 2 diabetes, antioxidants, trace elements
Introduction
Over the past 2 decades, the potential of the trace element selenium as a chemopreventive agent has been an area of intensive research. The first large randomized trial was the Nutritional Prevention of Cancer (NPC) Trial, in which 200 µg Se/d as brewer’s yeast or a matched placebo was administered to evaluate whether it could reduce the risk of nonmelanoma skin cancer (1). Although no effect of selenium was observed for the primary endpoint of skin cancer, secondary analyses showed a significant 58% reduction in colorectal cancer and a 63% reduction in prostate cancer incidence among those receiving selenium compared with placebo (1). Since the findings for the NPC trial were reported, selenium supplementation has been tested in several large clinical trials to determine if it could prevent cancer or precancerous lesions, with generally null results for these endpoints (2, 3).
In 2007, Stranges et al. (4) published an analysis of data from the NPC trial, which showed an increased risk of type 2 diabetes (T2D) among those in the selenium intervention group compared with those in the placebo arm. In contrast, results from the large Selenium and Vitamin E Cancer Prevention Trial (SELECT) showed no significant increase in T2D risk after supplementation with 200 µg selenomethionine/d as compared with placebo (2). Finally, the Selenium Trial, in which participants received either 200 µg Se/d as selenized yeast or placebo, showed no overall increased risk of T2D with selenium supplementation, but there was a significantly higher incidence of T2D among older participants receiving selenium (3). In addition to these clinical trials, several observational studies have been conducted to ascertain the potential influence of selenium on diabetes (5–9), which generally provided evidence that supports a positive association between selenium concentrations and odds of T2D, although some studies found no relation (10, 11).
The differences in these findings suggest that there may be patient characteristics that affect response to selenium. However, there is a dearth of data with regard to whether dietary intake of other antioxidant nutrients may influence any effect of selenium on the development of T2D. The SELECT trial, the design of which was predicated in part on experimental evidence that the combination of selenium and vitamin E might prevent prostate cancer more effectively than either agent alone, is an exception (12). Therefore, we sought to conduct a cross-sectional study to ascertain whether baseline plasma concentrations of selenium were associated with T2D in the Selenium Trial, as well as whether dietary intake of other antioxidant nutrients, including retinol, β-carotene, β-cryptoxanthin, lycopene, lutein and zeaxanthin, and α- and γ-tocopherol, modified this association.
Methods
Study population
Participants for this study were drawn from the Selenium Trial. A total of 1727 participants had data for both baseline concentrations of selenium and for T2D (Figure 1). As described in detail previously (3, 13), the Selenium Trial was a randomized, double-blind, placebo-controlled trial designed to test the effect of 200 µg Se/d as selenized yeast on the recurrence of colorectal adenomas. Briefly, healthy male and female participants between the ages of 40 and 80 y, and who had undergone total colonoscopy and complete removal of ≥1 colorectal adenomas with a diameter of ≥3 mm within the 6 mo before registration, were eligible. Exclusion criteria included familial syndromes, such as Lynch syndrome or familial adenomatous polyposis, and the presence of uncontrolled hypertension or heart disease, uncontrolled diabetes, or renal insufficiency (3). Participants were recruited from endoscopy clinics in Arizona, Colorado, Texas, and New York. Study data and biospecimens were collected, managed, and archived at the University of Arizona Cancer Center (Tucson, Arizona) (13). The University of Arizona Institutional Review Board approved and oversaw the study protocol, and the conduct of the trial was in accordance with requirements of the local institutional review board at each study site.
FIGURE 1.
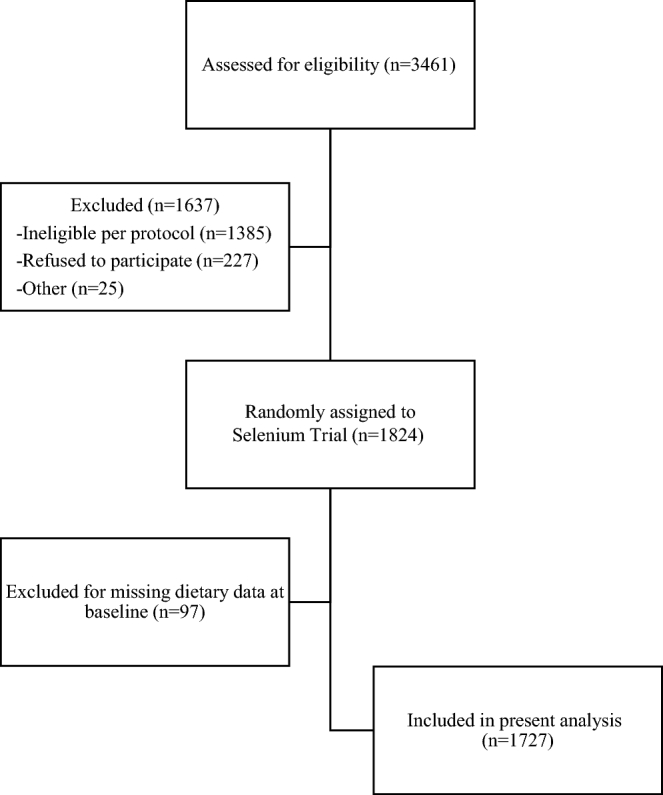
Participant flowchart.
Exposure and outcome assessment
Plasma selenium concentrations were analyzed by the AAnalyst 600 atomic absorption spectrometer (Perkin-Elmer), equipped with a Transverse heating graphite atomizer graphite furnace with Zeeman background correction and a selenium electrodeless discharge lamp. The furnace conditions were optimized for analytical sensitivity with the best signal-to-noise ratio and good linearity of the calibration curve. Before the analysis, each plasma sample was diluted with matrix modifiers containing 0.01% nickel nitrate hexahydrate and 0.0043% magnesium nitrate hexahydrate in 0.4% nitric acid and 0.2% Triton X-100. The method of additions was used to prepare the calibration standards. For each batch of analyses, quality-control samples with known concentrations of selenium were included within every 10 samples, and triplicate readings were collected for each sample.
For the collection of dietary, sociodemographic, and medical history data, self-administered questionnaires were completed by all participants in the Selenium Trial at baseline. The Arizona Food Frequency Questionnaire (AFFQ) was used for dietary data ascertainment. The AFFQ is a 113-item, semiquantitative, scannable instrument that is a modification of the frequency section of the National Cancer Institute's Health Habits and History Questionnaire (14). Participants were asked to report their intake of various foods for the previous year (15). Response categories ranging from >3 times/d to rarely/never were used for most items, although for frequently consumed foods and beverages, the scale ranged from >6 times/d to rarely/never (15). Total intake of each nutrient was calculated by multiplying the frequency of each item's consumption by the nutrient composition of each food (15). The presence of T2D was ascertained through self-report at clinic visits, reported use of diabetic medications, and participant medical record reports. This information was then confirmed via requests for medical records sent to participants’ primary care physicians (13).
Statistical analyses
Descriptive data for baseline characteristics by the presence or absence of T2D, and by tertile of baseline selenium concentration, were calculated with means ± SDs for continuous variables and frequencies and percentages for categorical variables. Unconditional logistic regression modeling was used to evaluate the associations between selenium concentrations and baseline T2D overall and stratified by baseline characteristics and dietary intake. Variables assessed for potential confounding in both models were age, BMI, sex, race, ethnicity, education, smoking status, and dietary intake of energy, protein, carbohydrate, fat, and fiber. Variables that changed the point estimate by ≥10% were included in the final multivariate logistic regression analyses of the association between plasma selenium concentrations and odds of T2D (16). Heterogeneity of effect for variables such as age, sex, BMI, and dietary intake was assessed by using an interaction term for tertile of selenium status and the variable in question and evaluating with a likelihood-ratio test. All of the analyses were conducted with the use of the STATA statistical software package, version 13.1 (StataCorp).
Results
Characteristics for diabetic (n = 172) and nondiabetic (n = 1555) participants are presented in Table 1. Those who were diabetic were slightly older than those without T2D (aged 64.8 ± 8.0 compared with 62.9 ± 9.0 y, respectively), were more likely to be men (72.7% compared with 63.8%, respectively), and had a higher BMI [64.0% with a BMI (kg/m2) >30 compared with 33.5%, respectively]. There was a higher proportion of black, Asian, and Hispanic participants with T2D than without; however, participant numbers were small and lacked precision. Smoking status and educational level did not differ substantially between diabetics and nondiabetics. For dietary intake, those with T2D had a higher consumption of energy and all other macronutrients than did those without diabetes.
TABLE 1.
Baseline characteristics of study participants overall and stratified by baseline diabetes status1
| Characteristic | Total population (n = 1727) | No diabetes (n = 1555) | Diabetes (n = 172) |
|---|---|---|---|
| Age, y | 63.1 ± 8.9 | 62.9 ± 9.0 | 64.8 ± 8.0 |
| Male, n (%) | 1117 (64.7) | 992 (63.8) | 125 (72.7) |
| BMI (kg/m2),2n (%) | |||
| <25 | 344 (19.9) | 334 (21.4) | 10 (5.8) |
| 25 to <30 | 752 (43.6) | 700 (45.1) | 52 (30.2) |
| ≥30 | 630 (36.5) | 520 (33.5) | 110 (64.0) |
| Race,3n (%) | |||
| White | 1625 (94.2) | 1474 (94.8) | 151 (88.3) |
| Black | 49 (2.8) | 42 (2.7) | 7 (4.1) |
| Asian | 17 (1.0) | 13 (0.8) | 4 (2.3) |
| American Indian/Alaskan | 8 (0.5) | 7 (0.5) | 1 (0.6) |
| Mixed or other | 26 (1.5) | 18 (1.2) | 8 (4.7) |
| Hispanic ethnicity4 | 77 (4.5) | 59 (3.8) | 18 (10.5) |
| Cigarette smoking status,5n (%) | |||
| Never | 706 (41.8) | 642 (42.2) | 64 (38.1) |
| Former | 828 (49.0) | 739 (48.5) | 89 (53.0) |
| Current | 156 (9.2) | 141 (9.3) | 15 (8.9) |
| Education,6n (%) | |||
| Less than high school | 32 (1.9) | 27 (1.7) | 5 (2.9) |
| High school or GED | 337 (19.5) | 299 (19.2) | 38 (22.1) |
| Some college | 510 (29.6) | 448 (28.8) | 62 (36.1) |
| Bachelor's degree | 365 (21.2) | 335 (21.6) | 30 (17.4) |
| Graduate/professional | 482 (27.8) | 445 (28.7) | 37 (21.5) |
| Dietary intake | |||
| Energy, kcal/d | 1864 ± 890 | 1859 ± 871 | 1913 ± 1050 |
| Protein, g/d | 76 ± 38 | 75 ± 36 | 82 ± 50 |
| Carbohydrate, g/d | 248 ± 127 | 248 ± 125 | 254 ± 140 |
| Total fat, g/d | 62 ± 35 | 61 ± 34 | 66 ± 43 |
| Total fiber, g/d | 21 ± 12 | 21 ± 12 | 23 ± 13 |
| Baseline plasma selenium, ng/mL | 139.2 ± 27.2 | 138.7 ± 27.2 | 143.6 ± 28.9 |
Values are means ± SDs unless otherwise indicated. GED, General Educational Development.
n = 1726.
n = 1725.
n = 1725.
n = 1690.
n = 1726.
Table 2 presents participant characteristics stratified by tertile of baseline plasma selenium concentrations. Age and race were similar across the 3 tertiles, as was education and intake of energy and macronutrients. Those in the highest tertile of baseline selenium compared with those in the lowest tertile were more likely to be male (66.6% compared with 62.9%) and had a higher percentage with a BMI of 25 to <30 (46.2% compared with 43.0%) or a BMI ≥30 (36.1% compared with 34.4%). There were fewer current smokers and more former smokers in the group with T2D than in those without T2D.
TABLE 2.
Baseline characteristics of study participants stratified by tertile of baseline plasma selenium concentrations1
| Tertile of mean ± SD plasma selenium concentration at baseline | |||
|---|---|---|---|
| Characteristic | 113.5 ± 9.7 ng/mL (n = 572) | 135.4 ± 5.9 ng/mL (n = 571) | 168.7 ± 23.4 ng/mL (n = 571) |
| Age, y | 63.0 ± 9.3 | 63.3 ± 9.0 | 63.0 ± 8.8 |
| Male, n (%) | 360 (62.9) | 374 (65.5) | 380 (66.6) |
| BMI (kg/m2), n (%) | |||
| <25 | 129 (22.6) | 110 (19.3) | 101 (17.7) |
| 25 to <30 | 246 (43.0) | 236 (41.4) | 264 (46.2) |
| ≥30 | 197 (34.4) | 224 (39.3) | 206 (36.1) |
| Race, n (%) | |||
| White | 540 (94.6) | 534 (93.7) | 538 (94.2) |
| Black | 18 (3.2) | 19 (3.3) | 12 (2.1) |
| Asian | 2 (0.4) | 5 (0.9) | 10 (1.8) |
| American Indian/Alaskan | 4 (0.7) | 2 (0.4) | 2 (0.4) |
| Mixed or other | 7 (1.2) | 10 (1.8) | 9 (1.6) |
| Hispanic ethnicity (yes), n (%) | 21 (3.7) | 27 (4.8) | 29 (5.1) |
| Cigarette smoking status, n (%) | |||
| Never | 236 (42.1) | 237 (42.5) | 226 (40.4) |
| Former | 266 (47.5) | 266 (47.7) | 292 (52.1) |
| Current | 58 (10.4) | 55 (9.9) | 42 (7.5) |
| Education, n (%) | |||
| Less than high school | 14 (2.5) | 8 (1.4) | 10 (1.8) |
| High school or GED | 116 (20.3) | 118 (20.7) | 101 (17.7) |
| Some college | 170 (29.7) | 155 (27.2) | 180 (31.6) |
| Bachelor's degree | 118 (20.6) | 126 (22.1) | 119 (20.9) |
| Graduate/professional | 154 (26.9) | 164 (28.7) | 160 (28.1) |
| Dietary intake | |||
| Energy, kcal/d | 1859 ± 876 | 1883 ± 936 | 1849 ± 853 |
| Protein, g/d | 75 ± 39 | 76 ± 39 | 76 ± 35 |
| Carbohydrate, g/d | 248 ± 123 | 250 ± 131 | 247 ± 125 |
| Total fat, g/d | 62 ± 36 | 63 ± 36 | 61 ± 33 |
| Total fiber, g/d | 20 ± 11 | 21 ± 12 | 21 ± 12 |
Values are means ± SDs unless otherwise indicated; n = 1714. Missing values for baseline characteristics are as follows: BMI (n = 1), race (n = 2), ethnicity (n = 2), cigarette smoking (n = 37), and education (n = 1). GED, General Educational Development.
Adjusted ORs for the association between baseline plasma selenium concentration and T2D are presented in Table 3 by total population and stratified by baseline characteristics. Those in the highest tertile of baseline plasma selenium concentrations had the highest odds of prevalent T2D (OR: 1.77; 95% CI: 1.16, 2.71). Among those aged <63 y, a baseline selenium value in either the second or third tertile was associated with a significantly higher odds of T2D, with ORs (95% CIs) of 2.54 (1.07, 6.04) and 3.04 (1.32, 7.02), respectively (P-trend = 0.01). This association was not significant among those aged ≥63 y, although an interaction term for age and selenium concentrations was not significant (P = 0.15). There was a significant trend for increased odds of prevalent T2D with increasing tertile of selenium for men (P-trend = 0.01), but not for women (P-trend = 0.09), although the interaction term for sex was not significant (P = 0.87). No material differences were observed for the association between selenium and T2D by BMI category. Current smokers in the third tertile of baseline selenium concentrations were determined to be at greater odds of prevalent T2D relative to current smokers in the lowest tertile (OR: 7.04; 95% CI: 1.04, 47.55), which was not observed among former or never smokers. However, the interaction term was not significant (P = 0.43), and the estimate for current smokers lacked precision. Among non-Hispanics/non-Latinos, only those in the highest tertile of baseline selenium had significantly increased odds of T2D prevalence (OR: 1.75; 95% CI: 1.12, 2.73; P-trend = 0.01), whereas for Hispanics/Latinos, those in the highest compared with the lowest tertile had an OR of 0.63 (95% CI: 0.06, 6.54), but the interaction term for ethnicity was not significant (P = 0.12).
TABLE 3.
Adjusted ORs (95% CIs) for the association between baseline plasma selenium concentration and diabetes, stratified by baseline characteristics1
| Tertile of mean ± SD baseline plasma selenium | |||||
|---|---|---|---|---|---|
| 113.5 ± 9.7 ng/mL | 135.4 ± 5.9 ng/mL | 168.7 ± 23.4 ng/mL | |||
| (n = 572) | (n = 571) | (n = 571) | P-trend2 | P-interaction | |
| Total population, n cases (%) | 43 (25.2) | 55 (32.2) | 73 (42.7) | ||
| Adjusted OR (95% CI) | 1.00 | 1.25 (0.80, 1.95) | 1.77 (1.16, 2.71) | 0.007 | |
| Age at baseline, n cases (%) | 0.15 | ||||
| <63 y | 11 (17.7) | 22 (35.5) | 29 (46.8) | ||
| Adjusted OR (95% CI) | 1.00 | 2.54 (1.07, 6.04) | 3.04 (1.32, 7.02) | 0.01 | |
| ≥63 y | 32 (29.4) | 33 (30.3) | 44 (40.4) | ||
| Adjusted OR (95% CI) | 1.00 | 0.95 (0.55, 1.65) | 1.41 (0.84, 2.37) | 0.18 | |
| Sex, n cases (%) | 0.87 | ||||
| Men | 29 (23.4) | 41 (33.1) | 54 (43.6) | ||
| Adjusted OR (95% CI) | 1.00 | 1.36 (0.80, 2.32) | 1.91 (1.15, 3.19) | 0.01 | |
| Women | 14 (29.8) | 14 (29.8) | 19 (40.4) | ||
| Adjusted OR (95% CI) | 1.00 | 1.30 (0.54, 3.11) | 2.02 (0.88, 4.63) | 0.09 | |
| BMI (kg/m2), n cases (%) | 0.85 | ||||
| <25 | 2 (20.0) | 4 (40.0) | 4 (40.0) | ||
| Adjusted OR (95% CI) | 1.00 | 1.43 (0.18, 11.16) | 1.47 (0.18, 11.87) | 0.73 | |
| 25 to <30 | 13 (25.5) | 17 (33.3) | 21 (41.2) | ||
| Adjusted OR (95% CI) | 1.00 | 1.29 (0.58, 2.84) | 1.43 (0.67, 3.06) | 0.36 | |
| ≥30 | 28 (25.5) | 34 (30.9) | 48 (43.6) | ||
| Adjusted OR (95% CI) | 1.00 | 1.04 (0.59, 1.85) | 1.73 (1.00, 2.99) | 0.04 | |
| Smoking | 0.43 | ||||
| Never | 14 (22.2) | 24 (38.1) | 25 (39.7) | ||
| Adjusted OR (95% CI) | 1.00 | 1.66 (0.77, 3.56) | 1.68 (0.79, 3.61) | 0.20 | |
| Former | 25 (28.1) | 24 (27.0) | 40 (44.9) | ||
| Adjusted OR (95% CI) | 1.00 | 0.92 (0.50, 1.72) | 1.65 (0.94, 2.91) | 0.07 | |
| Current | 2 (13.3) | 6 (40.0) | 7 (46.7) | ||
| Adjusted OR (95% CI) | 1.00 | 3.54 (0.52, 24.00) | 7.04 (1.04, 47.55) | 0.04 | |
| Ethnicity, n cases (%) | 0.12 | ||||
| Non-Hispanic/non-Latino | 38 (25.0) | 51 (33.6) | 63 (41.5) | ||
| Adjusted OR (95% CI) | 1.00 | 1.37 (0.86, 2.17) | 1.75 (1.12, 2.73) | 0.01 | |
| Hispanic/Latino | 5 (27.8) | 3 (16.7) | 10 (55.6) | ||
| Adjusted OR (95% CI) | 1.00 | 0.13 (0.01, 2.17) | 0.63 (0.06, 6.54) | 0.80 | |
Models adjusted for age, sex, BMI, race, ethnicity, smoking, education, and dietary intake of energy, protein, carbohydrate, total fat, and total fiber.
P values are P-trend for continuous variables.
Adjusted ORs for the association between baseline plasma selenium concentration and T2D, stratified by dietary intake of other nutrients, are presented in Table 4. No effect modification was observed for intake of energy, protein, carbohydrate, total fat, or total fiber. In addition, there were no material differences in the magnitude of the association between selenium and T2D by retinol, β-carotene, lutein, α-tocopherol, or γ-tocopherol intake. However, among those with both the highest concentration of selenium and the highest intake tertiles of β-cryptoxanthin and lycopene, the odds of T2D were highest, with ORs (95% CIs) of 3.03 (1.15, 7.98) for β-cryptoxanthin (P-trend = 0.03) and 2.66 (1.25, 5.67) for lycopene (P-trend = 0.008). No interaction terms for these antioxidants by selenium concentrations were significant.
TABLE 4.
Adjusted ORs (95% CIs) for the association between baseline plasma selenium concentration and diabetes, stratified by dietary intake of other nutrients1
| Tertile of mean ± SD baseline plasma selenium | ||||||
|---|---|---|---|---|---|---|
| Tertile of mean ± SD dietary intake | 113.5 ± 9.7 ng/mL | 135.4 ± 5.9 ng/mL | 168.7 ± 23.4 ng/mL | P-trend2 | P-interaction | |
| Energy intake, n cases (%) | 0.82 | |||||
| 1052 ± 244 kcal/d | 14 (23.3) | 17 (28.3) | 29 (48.3) | |||
| Adjusted OR (95% CI) | 1.00 | 0.89 (0.40, 1.98) | 1.70 (0.81, 3.56) | 0.12 | ||
| 1694 ± 179 kcal/d | 14 (29.2) | 15 (31.3) | 29 (39.6) | |||
| Adjusted OR (95% CI) | 1.00 | 1.07 (0.47, 2.46) | 1.37 (0.62, 3.03) | 0.43 | ||
| 2847 ± 795 kcal/d | 15 (23.8) | 23 (36.5) | 25 (39.7) | |||
| Adjusted OR (95% CI) | 1.00 | 2.07 (0.94, 4.56) | 1.78 (0.82, 3.90) | 0.17 | ||
| Protein, n cases (%) | 0.64 | |||||
| 42.6 ± 10.5 g/d | 13 (24.5) | 13 (24.5) | 27 (50.9) | |||
| Adjusted OR (95% CI) | 1.00 | 0.77 (0.32, 1.83) | 2.04 (0.95, 4.37) | 0.04 | ||
| 69.4 ± 7.1 g/d | 13 (27.1) | 18 (37.5) | 17 (35.4) | |||
| Adjusted OR (95% CI) | 1.00 | 1.18 (0.52, 2.69) | 1.24 (0.55, 2.80) | 0.62 | ||
| 115.4 ± 37.2 g/d | 17 (24.3) | 24 (34.3) | 29 (41.4) | |||
| Adjusted OR (95% CI) | 1.00 | 1.74 (0.83, 3.62) | 1.57 (0.77, 3.19) | 0.24 | ||
| Carbohydrate, n cases (%) | 0.90 | |||||
| 131.1 ± 33.0 g/d | 11 (20.0) | 17 (30.9) | 27 (49.1) | |||
| Adjusted OR (95% CI) | 1.00 | 1.24 (0.52, 2.95) | 2.47 (1.11, 5.50) | 0.02 | ||
| 224.0 ± 27.4 g/d | 16 (29.1) | 17 (30.9) | 22 (40.0) | |||
| Adjusted OR (95% CI) | 1.00 | 1.25 (0.57, 2.72) | 1.33 (0.63, 2.82) | 0.46 | ||
| 390.4 ± 108.2 g/d | 16 (26.2) | 21 (34.4) | 24 (39.3) | |||
| Adjusted OR (95% CI) | 1.00 | 1.39 (0.65, 3.00) | 1.43 (0.67, 3.05) | 0.37 | ||
| Total fat, n cases (%) | 0.28 | |||||
| 31.2 ± 8.5 g/d | 17 (29.3) | 18 (31.0) | 23 (39.7) | |||
| Adjusted OR (95% CI) | 1.00 | 0.94 (0.44, 2.01) | 1.30 (0.62, 2.73) | 0.47 | ||
| 54.8 ± 6.7 g/d | 11 (23.4) | 12 (25.5) | 24 (51.1) | |||
| Adjusted OR (95% CI) | 1.00 | 0.94 (0.35, 2.52) | 2.40 (1.03, 5.61) | 0.03 | ||
| 99.6 ± 33.8 g/d | 15 (22.7) | 25 (37.9) | 26 (39.4) | |||
| Adjusted OR (95% CI) | 1.00 | 2.26 (1.04, 4.91) | 2.07 (0.96, 4.49) | 0.08 | ||
| Total fiber, n cases (%) | 0.62 | |||||
| 10.4 ± 2.7 g/d | 10 (20.4) | 16 (32.7) | 23 (46.9) | |||
| Adjusted OR (95% CI) | 1.00 | 1.41 (0.57, 3.48) | 3.11 (1.33, 7.24) | 0.006 | ||
| 18.7 ± 2.5 g/d | 15 (25.9) | 19 (32.8) | 24 (41.4) | |||
| Adjusted OR (95% CI) | 1.00 | 1.17 (0.54, 2.51) | 1.62 (0.77, 3.44) | 0.20 | ||
| 33.4 ± 11.1 g/d | 18 (28.1) | 20 (31.3) | 26 (40.6) | |||
| Adjusted OR (95% CI) | 1.00 | 1.43 (0.67, 3.04) | 1.42 (0.69, 2.92) | 0.35 | ||
| Retinol, n cases (%) | 0.74 | |||||
| 3301.0 ± 939.1 IU/d | 15 (25.9) | 17 (29.3) | 26 (44.8) | |||
| Adjusted OR (95% CI) | 1.00 | 0.89 (0.40, 1.96) | 1.86 (0.88, 3.91) | 0.08 | ||
| 6322.7 ± 933.2 IU/d | 14 (28.0) | 16 (32.0) | 20 (40.0) | |||
| Adjusted OR (95% CI) | 1.00 | 0.96 (0.42, 2.18) | 1.50 (0.68, 3.32) | 0.31 | ||
| 14,017.9 ± 12,384.3 IU/d | 14 (22.2) | 22 (34.9) | 27 (42.9) | |||
| Adjusted OR (95% CI) | 1.00 | 2.40 (1.08, 5.35) | 2.08 (0.97, 4.45) | 0.08 | ||
| β-Carotene, n cases (%) | 0.65 | |||||
| 1173.2 ± 403.2 µg/d | 15 (26.8) | 16 (28.6) | 25 (44.6) | |||
| Adjusted OR (95% CI) | 1.00 | 0.79 (0.35, 1.76) | 1.92 (0.91, 4.06) | 0.07 | ||
| 2510.9 ± 450.5 µg/d | 16 (27.1) | 19 (32.2) | 24 (40.7) | |||
| Adjusted OR (95% CI) | 1.00 | 1.28 (0.59, 2.77) | 1.69 (0.79, 3.59) | 0.18 | ||
| 6302.7 ± 5989.8 µg/d | 12 (21.4) | 20 (35.7) | 24 (42.9) | |||
| Adjusted OR (95% CI) | 1.00 | 1.79 (0.78, 4.13) | 1.76 (0.78, 3.96) | 0.20 | ||
| β-Cryptoxanthin, n cases (%) | 0.48 | |||||
| 42.6 ± 17.0 µg/d | 16 (25.4) | 25 (39.7) | 22 (34.9) | |||
| Adjusted OR (95% CI) | 1.00 | 1.63 (0.79, 3.38) | 1.92 (0.92, 4.00) | 0.09 | ||
| 120.0 ± 32.3 µg/d, | 18 (29.5) | 15 (24.6) | 28 (45.9) | |||
| Adjusted OR (95% CI) | 1.00 | 0.68 (0.31, 1.48) | 1.39 (0.69, 2.79) | 0.30 | ||
| 379.2 ± 174.5 µg/d | 9 (19.2) | 15 (31.9) | 23 (48.9) | |||
| Adjusted OR (95% CI) | 1.00 | 2.46 (0.90, 6.73) | 3.03 (1.15, 7.98) | 0.03 | ||
| Lycopene, n cases (%) | 0.25 | |||||
| 2095.0 ± 727.3 µg/d | 14 (24.1) | 17 (29.3) | 27 (46.6) | |||
| Adjusted OR (95% CI) | 1.00 | 1.18 (0.54, 2.57) | 1.90 (0.91, 3.97) | 0.08 | ||
| 4169.3 ± 604.2 µg/d | 15 (28.3) | 22 (41.5) | 16 (30.2) | |||
| Adjusted OR (95% CI) | 1.00 | 1.54 (0.67, 3.54) | 1.18 (0.50, 2.78) | 0.75 | ||
| 8461.9 ± 3679.8 µg/d | 14 (23.3) | 16 (26.7) | 30 (50.0) | |||
| Adjusted OR (95% CI) | 1.00 | 1.29 (0.56, 2.95) | 2.66 (1.25, 5.67) | 0.008 | ||
| Lutein, n cases (%) | 0.60 | |||||
| 915.9 ± 319.9 µg/d | 15 (28.9) | 13 (25.0) | 24 (46.2) | |||
| Adjusted OR (95% CI) | 1.00 | 0.67 (0.29, 1.54) | 1.77 (0.85, 3.68) | 0.11 | ||
| 1976.2 ± 354.0 µg/d | 18 (28.6) | 21 (33.3) | 24 (38.1) | |||
| Adjusted OR (95% CI) | 1.00 | 1.30 (0.60, 2.78) | 1.52 (0.73, 3.16) | 0.26 | ||
| 4774.5 ± 3453.0 µg/d | 10 (17.9) | 21 (37.5) | 25 (44.6) | |||
| Adjusted OR (95% CI) | 1.00 | 2.59 (1.09, 6.17) | 2.43 (1.03, 5.72) | 0.06 | ||
| α-Tocopherol, n cases (%) | 0.73 | |||||
| 3.75 ± 1.0 mg/d | 15 (25.4) | 18 (30.5) | 26 (44.1) | |||
| Adjusted OR (95% CI) | 1.00 | 1.03 (0.47, 2.26) | 1.82 (0.88, 3.74) | 0.09 | ||
| 6.5 ± 0.8 mg/d | 12 (23.1) | 16 (30.8) | 24 (46.2) | |||
| Adjusted OR (95% CI) | 1.00 | 1.37 (0.60, 3.14) | 1.95 (0.90, 4.24) | 0.09 | ||
| 12.2 ± 5.1 mg/d | 16 (26.7) | 21 (35.0) | 23 (38.3) | |||
| Adjusted OR (95% CI) | 1.00 | 1.83 (0.82, 4.10) | 1.52 (0.70, 3.31) | 0.34 | ||
| γ-Tocopherol, n cases (%) | 0.94 | |||||
| 1.6 ± 0.5 mg/d | 16 (29.6) | 15 (27.8) | 23 (42.6) | |||
| Adjusted OR (95% CI) | 1.00 | 0.91 (0.41, 2.05) | 1.66 (0.79, 3.51) | 0.17 | ||
| 3.3 ± 0.5 mg/d | 14 (25.0) | 17 (30.3) | 25 (44.6) | |||
| Adjusted OR (95% CI) | 1.00 | 1.41 (0.61, 3.25) | 1.95 (0.88, 4.32) | 0.10 | ||
| 7.0 ± 3.0 mg/d | 13 (21.3) | 23 (37.7) | 25 (41.0) | |||
| Adjusted OR (95% CI) | 1.00 | 1.78 (0.81, 3.93) | 2.16 (0.99, 4.72) | 0.06 | ||
Models adjusted for age, sex, BMI, race, ethnicity, smoking, education, and dietary intake of energy, protein, carbohydrate, total fat, and total fiber.
P values are P-trend for continuous variables.
Discussion
The results of this cross-sectional study showed that higher baseline plasma concentrations of selenium were significantly associated with prevalent T2D among participants in a clinical trial of selenium supplementation. The relation appeared to be stronger among younger individuals, current smokers, and non-Hispanic whites; however, none of the interactions were significant. In addition, the sample sizes for these stratified analyses limited the precision of the point estimates. The consumption of macronutrients did not appear to modify the relation between selenium and T2D; however, those who were in the highest tertile of plasma selenium concentration and who also consumed the highest quantities of the antioxidant nutrients β-cryptoxanthin and lycopene had the highest prevalence of T2D, although interaction terms did not reach significance. These findings are the first, to our knowledge, to indicate that the intake of other antioxidant nutrients may modify the effect of selenium supplementation, although this relation requires further examination, including measurement of blood concentrations of antioxidants.
The overall findings of this report are in agreement with the majority of observational studies, which reported positive associations between blood concentrations of selenium and T2D (5, 7–9). Two studies used NHANES data to examine whether selenium was related to T2D among participants in the United States (7, 8). Together, these reports encompassed >9000 individuals, and both found that higher concentrations of selenium were associated with higher rates of T2D, with ORs (95% CIs) of 1.57 (1.16, 2.13) (8) and 7.64 (3.34, 17.46) (7) for those in the highest quantiles for serum selenium compared with those in the lowest. Stranges et al. (9) used data from the Italian Olivetti Heart Study and showed that there was a higher proportion of individuals with diabetes in the highest tertile of baseline selenium concentrations than the lowest. Zhang et al. (5) compared concentrations of several trace elements among diabetic Chinese participants with those with no history of diabetes and observed that those in the highest quartile of selenium had an OR of 2.69 (95% CI: 1.31, 3.49) compared with those in the lowest. In contrast to these studies that found positive associations for selenium and T2D, 2 studies in participants in the Nord-Trøndelag Health Survey (HUNT-3) in Norway found no relation (10, 11). Simic et al. (10) reported an OR of 1.13 (95% CI: 0.65, 1.96) for prevalent diabetes among those in the highest tertile of whole-blood concentrations of selenium compared with those in the lowest tertile, whereas Hansen et al. (11) restricted this population to early-stage diabetes and reported an OR of 0.93 (95% CI: 0.50, 1.74).
The reasons for the differential findings of the studies conducted in Norway compared with those in the present work are unclear; however, the median measured blood concentrations of selenium in the Norwegian work was in the range of 100–105 ng/mL (10, 11). These concentrations are substantially lower than those of the present study, wherein the overall mean selenium concentration was 139.2 ng/mL, with a median of 135 ng/mL. Stranges et al. (4) reported that the increased odds for T2D in the NPC trial were confined to those who entered the trial with blood concentrations of selenium ≥121.6 ng/mL. This suggests that the selenium concentrations in the Norwegian studies were below those in which an increased risk of T2D would be observed. However, a larger proportion of individuals with T2D among those in the highest tertile of selenium was reported in the study conducted in Italy, in which the mean selenium concentration was only 95.5 ng/mL (9). Therefore, although 4 of the 6 observational studies reported significantly increased odds for diabetes among those in the highest category of blood selenium concentrations compared with those in the lowest, it remains unclear whether there is a specific threshold of selenium concentrations that may affect risk for T2D. It is possible that another, as-yet-unidentified confounding variable affects this association. Results from clinical intervention trials therefore must be considered.
Although findings from observational studies suggest that there is a direct association between higher blood selenium concentrations and T2D, data from completed clinical trials of selenium supplementation are less consistent. Secondary analyses of the NPC trial showed an HR for the development of T2D among those supplemented with selenium compared with placebo of 1.55 (95% CI: 1.03, 2.33) (4). Among >35,000 participants in the SELECT trial, the HR was 1.07 (95% CI: 0.94, 1.22) (2), whereas for the Selenium Trial, it was 1.25 (95% CI: 0.74, 2.11) (3). In the latter trial, a significantly increased odds of T2D was observed for those aged >63 y, with an OR of 2.21 (95% CI: 1.04, 4.67) (3). Taken together, these results suggest that there may be a modest increase in the odds of T2D with higher circulating selenium concentrations or with selenium supplementation for chemoprevention.
The potential mechanism of action for any link between selenium and T2D may be mediated in part via the selenoprotein glutathione peroxidase 1 (GPx-1) (17). Saturation of GPx-1 occurs at comparatively low blood concentrations of selenium (18), and findings in experimental animal models suggest that prolonged activation of GPx-1 may result in dysregulation of insulin signaling (19, 20). Overexpression of GPx-1 causes obesity and insulin resistance in experimental animal models (19), whereas reduced GPx-1 expression appears to reduce the manifestation of these outcomes (20). Another possible mechanism that has been put forth is related to oxidative stress, via increased production of reactive oxygen species under conditions of high concentrations of selenite and the selenium metabolite methyselenol, which, in turn, may adversely affect pancreatic β cells (8, 17). However, further work is required to elucidate the mechanism of action, as well as to determin whether there is heterogeneity of treatment effect among study participants by variables such as age or intake of antioxidant nutrients in addition to selenium, which themselves may affect oxidative stress.
Results from the present study suggest that there may be effect modification by other antioxidants in relation to T2D risk, although these findings were not significant and may be due to chance. We observed that odds of T2D were highest for those in the highest tertile of plasma selenium concentrations who were also in the highest tertile for intakes of β-cryptoxanthin and lycopene. These findings are in contrast to recent work indicating that a high antioxidant capacity was associated with a reduced risk of T2D in the French E3N–European Prospective Investigation into Cancer and Nutrition (EPIC) cohort (21). However, it remains unclear whether a balance of antioxidants may be key to scavenging reactive oxygen species and thus protective against oxidative stress, or indeed whether antioxidants may also exhibit pro-oxidant activity at higher concentrations (22, 23).
The results of the present study indicated that there was a stronger association for baseline selenium concentrations and prevalent T2D among those who were <63 y of age, although the interaction term was not significant. These results are in accordance with the 2 other observational studies that presented results stratified by age and where no significant interactions were observed (7, 8). In the parent clinical trial for the present study, the Selenium Trial, a significantly increased risk of incident T2D was observed in those aged ≥63 y, but not in the younger age group, with a significant interaction term (3). It is possible that the differences in these findings may result from imprecise estimates due to lower numbers of events occurring in stratified analyses.
The strengths of this study include the large sample size and the detailed data available for participant characteristics and dietary intake. However, limitations to the work must be acknowledged. First, this was a cross-sectional analysis of blood selenium concentrations and T2D, and as such, no interpretations with regard to causality can be made. It is possible that a diagnosis of T2D alters dietary habits, such that different food choices are made and more antioxidant nutrients are consumed postdiagnosis (17). Next, dietary data were ascertained via the AFFQ (15), which is a validated instrument; however, we did not capture data for blood concentrations of antioxidants other than selenium. Therefore, future work will require measurement of these concentrations in order to determine the degree to which bioavailability and utilization of these nutrients may affect these findings. Finally, although this was a large study, we were unable to determine whether there were differences in the association between selenium and T2D among different racial and ethnic groups, which will be key to fully understanding whether selenium may in fact increase the risk of this disease.
In conclusion, the results of this cross-sectional analysis support previously published observational studies showing a positive association between selenium and odds of T2D. To our knowledge, these are the first findings to suggest that the intake of other antioxidant nutrients may modify the effects of selenium supplementation. Future work is needed in measuring blood concentrations of other antioxidant nutrients, as well as clarifying whether there may be variation in this association by other individual characteristics such as race or ethnicity.
Acknowledgments
We thank James Zink for his assistance in reviewing for accuracy the data presented in the tables. The authors’ responsibilities were as follows—ETJ, LNK, SC, PH, and PL: designed the research; ETJ, SC, and PL: conducted the research; ETJ, LNK, PH, KS, AF, and CPK: analyzed the data; ETJ, LNK, AF, CPK, PL, KB, and SC: wrote the manuscript; ETJ and LNK: had primary responsibility for the final content; and all authors: read and approved the final manuscript.
Notes
Supported by the National Cancer Institute Cancer (NCI) Center Support Grant P30 CA023074, NIH/NCI R01CA151708 (ETJ), NIH/NCI P01 CA041108 (PL), and NIH/NCI R01CA151708 (PL).
Author disclosures: LNK, AF, CPK, SC, PH, KB, KS, PL, and ETJ, no conflicts of interest.
Abbreviations used:
- AFFQ
Arizona Food Frequency Questionnaire
- GPx-1
glutathione peroxidase 1
- NPC
Nutritional Prevention of Cancer
- SELECT
Selenium and Vitamin E Cancer Prevention Trial
- T2D
type 2 diabetes
References
- 1. Clark LC, Combs GF Jr, Turnbull BW, Slate EH, Chalker DK, Chow J, Davis LS, Glover RA, Graham GF, Gross EG et al. Nutritional Prevention of Cancer Study Group. Effects of selenium supplementation for cancer prevention in patients with carcinoma of the skin: a randomized controlled trial. JAMA 1996;276:1957–63. [PubMed] [Google Scholar]
- 2. Lippman SM, Klein EA, Goodman PJ, Lucia MS, Thompson IM, Ford LG, Parnes HL, Minasian LM, Gaziano JM, Hartline JA et al. Effect of selenium and vitamin E on risk of prostate cancer and other cancers: the Selenium and Vitamin E Cancer Prevention Trial (SELECT). JAMA 2009;301:39–51. [DOI] [PMC free article] [PubMed] [Google Scholar]
- 3. Thompson PA, Ashbeck EL, Roe DJ, Fales L, Buckmeier J, Wang F, Bhattacharyya A, Hsu CH, Chow HH, Ahnen DJ et al. Selenium supplementation for prevention of colorectal adenomas and risk of associated type 2 diabetes. J Natl Cancer Inst 2016;108. [DOI] [PMC free article] [PubMed] [Google Scholar]
- 4. Stranges S, Marshall JR, Natarajan R, Donahue RP, Trevisan M, Combs GF, Cappuccio FP, Ceriello A, Reid ME. Effects of long-term selenium supplementation on the incidence of type 2 diabetes: a randomized trial. Ann Intern Med 2007;147:217–23. [DOI] [PubMed] [Google Scholar]
- 5. Zhang H, Yan C, Yang Z, Zhang W, Niu Y, Li X, Qin L, Su Q. Alterations of serum trace elements in patients with type 2 diabetes. J Trace Elem Med Biol 2017;40:91–6. [DOI] [PubMed] [Google Scholar]
- 6. Wei J, Zeng C, Gong QY, Yang HB, Li XX, Lei GH, Yang TB. The association between dietary selenium intake and diabetes: a cross-sectional study among middle-aged and older adults. Nutr J 2015;14:18. [DOI] [PMC free article] [PubMed] [Google Scholar]
- 7. Laclaustra M, Navas-Acien A, Stranges S, Ordovas JM, Guallar E. Serum selenium concentrations and diabetes in U.S. adults: National Health and Nutrition Examination Survey (NHANES) 2003–2004. Environ Health Perspect 2009;117:1409–13. [DOI] [PMC free article] [PubMed] [Google Scholar]
- 8. Bleys J, Navas-Acien A, Guallar E. Serum selenium and diabetes in U.S. adults. Diabetes Care 2007;30:829–34. [DOI] [PubMed] [Google Scholar]
- 9. Stranges S, Galletti F, Farinaro E, D'Elia L, Russo O, Iacone R, Capasso C, Carginale V, De Luca V, Della Valle E et al. Associations of selenium status with cardiometabolic risk factors: an 8-year follow-up analysis of the Olivetti Heart study. Atherosclerosis 2011;217:274–8. [DOI] [PubMed] [Google Scholar]
- 10. Simic A, Hansen AF, Asvold BO, Romundstad PR, Midthjell K, Syversen T, Flaten TP. Trace element status in patients with type 2 diabetes in Norway: the HUNT3 survey. J Trace Elem Med Biol 2017;41:91–8. [DOI] [PubMed] [Google Scholar]
- 11. Hansen AF, Simic A, Asvold BO, Romundstad PR, Midthjell K, Syversen T, Flaten TP. Trace elements in early phase type 2 diabetes mellitus—a population-based study: the HUNT study in Norway. J Trace Elem Med Biol 2017;40:46–53. [DOI] [PubMed] [Google Scholar]
- 12. Lippman SM, Goodman PJ, Klein EA, Parnes HL, Thompson IM Jr, Kristal AR, Santella RM, Probstfield JL, Moinpour CM, Albanes D et al. Designing the Selenium and Vitamin E Cancer Prevention Trial (SELECT). J Natl Cancer Inst 2005;97:94–102. [DOI] [PubMed] [Google Scholar]
- 13. Thompson P, Roe DJ, Fales L, Buckmeier J, Wang F, Hamilton SR, Bhattacharyya A, Green S, Hsu CH, Chow HH et al. Design and baseline characteristics of participants in a phase III randomized trial of celecoxib and selenium for colorectal adenoma prevention. Cancer Prev Res 2012;5:1381–93. [DOI] [PMC free article] [PubMed] [Google Scholar]
- 14. Block G, Hartman AM, Naughton D. A reduced dietary questionnaire: development and validation. Epidemiology 1990;1:58–64. [DOI] [PubMed] [Google Scholar]
- 15. Ritenbaugh C, Aickin M, Taren D, Teufel N, Graver E, Woolf K, Alberts DS. Use of a food frequency questionnaire to screen for dietary eligibility in a randomized cancer prevention phase III Trial. Cancer Epidemiol Biomarkers Prev 1997;6:347–54. [PubMed] [Google Scholar]
- 16. Mickey RM, Greenland S. The impact of confounder selection criteria on effect estimation. Am J Epidemiol 1989;129:125–37. [DOI] [PubMed] [Google Scholar]
- 17. Rayman MP, Stranges S. Epidemiology of selenium and type 2 diabetes: can we make sense of it? Free Radic Biol Med 2013;65:1557–64. [DOI] [PubMed] [Google Scholar]
- 18. Allan CB, Lacourciere GM, Stadtman TC. Responsiveness of selenoproteins to dietary selenium. Annu Rev Nutr 1999;19:1–16. [DOI] [PubMed] [Google Scholar]
- 19. McClung JP, Roneker CA, Mu W, Lisk DJ, Langlais P, Liu F, Lei XG. Development of insulin resistance and obesity in mice overexpressing cellular glutathione peroxidase. Proc Natl Acad Sci USA 2004;101:8852–7. [DOI] [PMC free article] [PubMed] [Google Scholar]
- 20. Loh K, Deng H, Fukushima A, Cai X, Boivin B, Galic S, Bruce C, Shields BJ, Skiba B, Ooms LM et al. Reactive oxygen species enhance insulin sensitivity. Cell Metab 2009;10:260–72. [DOI] [PMC free article] [PubMed] [Google Scholar]
- 21. Mancini FR, Affret A, Dow C, Balkau B, Bonnet F, Boutron-Ruault MC, Fagherazzi G. Dietary antioxidant capacity and risk of type 2 diabetes in the large prospective E3N-EPIC cohort. Diabetologia 2018;61:308–16. [DOI] [PubMed] [Google Scholar]
- 22. Valko M, Izakovic M, Mazur M, Rhodes CJ, Telser J. Role of oxygen radicals in DNA damage and cancer incidence. Mol Cell Biochem 2004;266:37–56. [DOI] [PubMed] [Google Scholar]
- 23. Sarangarajan R, Meera S, Rukkumani R, Sankar P, Anuradha G. Antioxidants: friend or foe? Asian Pac J Trop Med 2017;10:1111–6. [DOI] [PubMed] [Google Scholar]