

Drug addiction is a chronic relapsing brain disorder, in which effective treatments and the underlying neurobiological mechanisms remain elusive. Geng, Hu et al. report alterations in cortical thickness and resting-state functional connectivity in cocaine users. Neuroimaging measures predict cocaine relapse with high accuracy, suggesting new treatment strategies for cocaine addiction.
Keywords: cocaine addiction, relapse, cortical thickness, salience network, default mode network
Abstract
While chronic cocaine use is associated with abnormalities in both brain structure and function within and interactions between regions, previous studies have been limited to interrogating structure and function independently, and the detected neural differences have not been applied to independent samples to assess the clinical relevance of results. We investigated consequences of structural differences on resting-state functional connectivity in cocaine addiction and tested whether resting-state functional connectivity of the identified circuits predict relapse in an independent cohort. Subjects included 64 non-treatment-seeking cocaine users (NTSCUs) and 67 healthy control subjects and an independent treatment-completed cohort (n = 45) of cocaine-dependent individuals scanned at the end of a 30-day residential treatment programme. Differences in cortical thickness and related resting-state functional connectivity between NTSCUs and healthy control subjects were identified. Survival analysis, applying cortical thickness of the identified regions, resting-state functional connectivity of the identified circuits and clinical characteristics to the treatment cohort, was used to predict relapse. Lower cortical thickness in bilateral insula and higher thickness in bilateral temporal pole were found in NTSCUs versus healthy control subjects. Whole brain resting-state functional connectivity analyses with these four different anatomical regions as seeds revealed eight weaker circuits including within the salience network (insula seeds) and between temporal pole and elements of the default mode network in NTSCUs. Applying these circuits and clinical characteristics to the independent cocaine-dependent treatment cohort, functional connectivity between right temporal pole and medial prefrontal cortex, combined with years of education, predicted relapse status at 150 days with 88% accuracy. Deficits in the salience network suggest an impaired ability to process physiologically salient events, while abnormalities in a temporal pole–medial prefrontal cortex circuit might speak to the social-emotional functional alterations in cocaine addiction. The involvement of the temporal pole–medial prefrontal cortex circuit in a model highly predictive of relapse highlights the importance of social-emotional functions in cocaine dependence, and provides a potential underlying neural target for therapeutic interventions, and for identifying those at high risk of relapse.
Introduction
Understanding the neural basis of human cocaine addiction has mostly relied on neuroimaging studies that focused on a single imaging modality, making it difficult to assess how structural and/or functional differences identified in any given study are related. For example, decreased grey matter density or volume in the orbitofrontal cortex, cingulate, insular and temporal cortices (Franklin et al., 2002; Matochik et al., 2003; Ersche et al., 2011, 2012) has been reported in cocaine dependence, along with reduced cortical thickness in the dorsal lateral prefrontal and insular cortices (Makris et al., 2008), and increased grey matter volume in striatum (Ersche et al., 2011, 2012). Some of these structural alterations have been linked to addiction-related behavioural phenotypes including impulsivity and compulsivity (Ersche et al., 2011), but they have not been linked to functional circuit differences within the disease phenotype.
Resting-state functional connectivity (rsFC) studies, on the other hand, have attempted to characterize the disease at a functional circuit or network level. For example, chronic cocaine users, compared with healthy control subjects, demonstrate reduced rsFC between mesocorticolimbic pathway nodes and various cortical and subcortical loci (Gu et al., 2010) and between interhemispheric prefrontal areas (Kelly et al., 2011), while greater rsFC in the insular network and perigenual anterior cingulate cortex (ACC) network (Camchong et al., 2011; Cisler et al., 2013; Wisner et al., 2013) and striatal-frontal circuits (Hu et al., 2015) have also been reported. For the most part, these circuit differences have not been associated with concomitant brain morphological differences. As brain function is known to be highly dependent on underlying structural features (Honey et al., 2007), findings supported by two modalities, ideally within a single cohort and study, would take advantage of the cross-information from each modality, thereby potentially enhancing detection power to find imaging features underlying the disease (Damoiseaux and Greicius, 2009; Sui et al., 2014). Indeed, functional connectivity analyses using regional alterations in cortical morphology as seeds have provided nuanced insights into the neural underpinnings of various neuropsychiatric conditions, although not in addiction (Hoptman et al., 2014). Further, preclinical studies demonstrate that structural plasticity as a function of chronic cocaine intake can manifest as altered dendritic spine density and neuropil, which are known to be an important component of cortical volume measures (Schuz and Palm, 1989). Such changes in synaptic connectivity affect neuronal circuits involved in reward, incentive motivation and inhibitory control (Robinson and Kolb, 2004; Munoz-Cuevas et al., 2013). It is expected, therefore, that differences in cortical thickness in cocaine-dependent individuals will be related to functional differences that may be the result of their cocaine use and may yield insights into understanding their problematic behaviours.
To date, neural differences found between cocaine users and control subjects have not been applied to independent samples to assess their clinical relevance as treatment outcome predictors. Rather, most studies have focused on investigating differences between cocaine users (often non-treatment seeking) and controls and only speculated on the potential clinical implications of their findings [see Gabrieli et al. (2015) for perspective]. Moreover, those studies that have used imaging to try to predict treatment outcome have done so within a single treatment seeking cohort, without testing the generalizability of these results in an independent cohort sample. While early results have shown promise, considerable variability remains unexplained by previous studies, which have primarily focused on various aspects of cue reactivity and cognitive control (Brewer et al., 2008; Marhe et al., 2013; Prisciandaro et al., 2013; Worhunsky et al., 2013; Adinoff et al., 2015). With typically less than half of the variance explained even in the cohort from which the predictive neural feature is identified, there is reason to pursue data-driven analyses to identify other factors that impact treatment outcome. It is hypothesized that neurobiologically based features from cocaine-dependent individuals will likely predict relapse better than clinical features alone, which have had limited predictive success (Brorson et al., 2013). Neural differences identified in one group and demonstrated to have predictive value in another group may also point to new treatment targets to help cocaine-dependent individuals maintain abstinence.
Our first aim, therefore, was to identify regions of cortical morphological differences between non-treatment seeking cocaine users (NTSCUs) and a healthy, well-matched cohort and to subsequently use these regional morphological differences as seeds in rsFC analyses to identify circuits related to these structural differences that differ between NTSCUs and healthy control subjects. Our second aim was to assess the generalizability and clinical relevance of these findings by applying them to an independent cohort of treatment-completed cocaine-dependent (TCD) individuals (McHugh et al., 2013, 2014; Adinoff et al., 2015).
Materials and methods
Participants
Participants in the exploratory cohort included 64 NTSCUs (59 meeting DSM-IV-TR criteria for cocaine dependence; three cocaine abuse; and two users with past abuse or dependence) and 67 control subjects with similar distributions of age, sex, race, IQ and years of formal education. The prevalence of other drugs of abuse for the NTSCUs was surveyed (Table 1). They were assessed with a comprehensive physical examination along with a computerized self-report SCID-I (Structured Clinical Interview for DSM-IV Disorders) Patient Screening Questionnaire with follow-up clinical interview. Exclusion criteria included major medical or neurological illness and psychiatric disorders other than current dependence on cocaine or nicotine. In addition, all participants were subjected to a urine toxicology screen to detect the potential use of a wide range of therapeutic and recreational substances. Positive findings likely to interfere with the study (e.g. psychiatric medications or illicit drugs not disclosed by the participant) were exclusionary. Participants with a positive breathalyzer test for alcohol on the scanning day were rescheduled. No subjects reported cocaine use on the day of the study.
Table 1.
Subject information of the non-treatment seeking cohort and the treatment-completed cocaine cohort
| Non-treatment seeking cohort | Cocaine users (n = 64) | Healthy Controls (n = 67) | Group difference P-value |
|---|---|---|---|
| Age (years) | 40.59 ± 6.01 | 39.99 ± 5.70 | 0.55 (NS) |
| Sex (male/female) | 49/15 | 46/21 | 0.41 (NS) |
| WASI vocabulary score | 56.44 ± 7.67 | 57.49 ± 8.28 | 0.45 (NS) |
| Education (years) | 12.84 ± 1.28 | 13.34 ± 1.91 | 0.08 (NS) |
| Current cocaine use amount | $198 ± 153 | NA | NA |
| Cocaine dependence | 4.24 ± 1.66 | NA | NA |
| Years of cocaine use | 13.0 ± 6.6 | NA | N.A |
| Composition of current nicotine use (non-/low-level/high-level smokers) | 16/35/13 | 41/10/16 | <0.001 |
| Head motion (FD) | 0.129 ± 0.111 | 0.139 ± 0.079 | 0.48 (NS) |
| Average thickness | 2.37 ± 0.091 | 2.39 ± 0.088 | 0.11 (NS) |
| Other drug use (cocaine users) | Dependence/abuse/recreational usea | ||
| Current | Past | ||
| Alcohol | 0/10/51 | 3/17/40 | |
| Amphetamine | 0/0/1 | 1/1/2 | |
| Barbiturate | 0/0/0 | 0/0/1 | |
| Downer | 0/0/0 | 0/1/0 | |
| Heroin | 0/0/3 | 1/2/6 | |
| Hallucinogen | 0/0/0 | 0/1/5 | |
| Inhalants | 0/0/0 | 0/0/1 | |
| Minor tranquilizer | 0/0/0 | 0/0/2 | |
| Other opiates | 0/0/0 | 0/0/2 | |
| PCP | 0/0/0 | 0/2/4 | |
| Qualude | 0/0/0 | 1/0/0 | |
| THC | 0/7/22 | 5/16/31 | |
| Treatment-completed cocaine cohort | Cocaine-dependent users (n = 45) | ||
| Age (years) | 43.4 ± 7.1 | ||
| Sex (male/female) | 39/6 | ||
| WTAR FSIQ | 89.6 ± 8.9 | ||
| Education (years) | 12.5 ± 2.1 | ||
| Years of cocaine use | 8.3 ± 5.4 | ||
| Days used cocaine (past 90 days) | 70.6 ± 23.0 | ||
| Days since last cocaine use prior to the MRI scan | 22.7 ± 3.9 | ||
| Lifetime InDUC score | 38 ± 6 | ||
| Recent InDUC score (Past 90 Days) | 79 ± 21 | ||
| Nicotine use (CPD) | 12.0 ± 10.6 | ||
| Head motion (FD) | 0.18 ± 0.06 | ||
FD = frame displacement between brain imaging volumes; InDUC = Inventory of Drug Use Consequences; WASI = Wechsler Adult Intelligence Scale; WTAR FSIQ = Wechsler Test of Adult Reading Full-Scale IQ.
Current cocaine use amount is defined as the weekly average of money in the US dollar spent on cocaine in the past month. Cocaine Dependence is defined as DSM-IV-RT criteria met and 59 of 64 cocaine users met three or more criteria for current cocaine dependence. The composition of current nicotine use is defined as the number of non-smokers (cigarettes per day, CPD = 0), low-level smokers (CPD ≤ 10) and High-level smokers (CPD > 10) in each group.
aDependence and abuse classifications were based on DSM-IV criteria. Recreational use included people who had at least 5 lifetime usage of that substance.
Regardless of which study subjects were originally enrolled in, all met the same inclusion/exclusion criteria and the structural and resting-state functional MRI imaging data reported herein were acquired with identical imaging parameters. The treatment cohort (Table 1) included 45 TCDs who had completed a Minnesota Model psychosocial residential treatment programme (McHugh et al., 2013; McHugh et al., 2014). Treatment subjects having any history of major illness, left-handedness, an estimated IQ below 70 (per the Wechsler Test of Adult Reading, WTAR), or meeting criteria for any neurological or active Axis I disorder (other than substance use disorders) or who were on psychotropic medications, were excluded. Other drug use was not exclusionary as long as cocaine dependence was the primary diagnosis. The treatment participants underwent 2–4 weeks’ abstinence in a structured residential unit before their MRI scans. Abstinence was verified throughout the treatment period via urine drug screens. During the final week of treatment, cocaine-dependent individuals completed a 6-min resting-state functional MRI scan and a structural scan. Post-discharge follow-up procedures are described in detail elsewhere (McHugh et al., 2013, 2014). Briefly, TCDs were followed twice weekly for 24 weeks or until relapse to stimulant use. Relapse was defined as any use of cocaine or amphetamine since discharge and marked as the day of first use, or the day of their first missed appointment if participants missed two consecutive appointments. As shown in Supplementary Fig. 1, >50% of patients relapsed to drug use in the first month and only 18% of patients remained abstinent at 168 days follow-up.
Prior to study initiation, treatment participants (TCD cohort) provided written informed consent approved by the Institutional Review Board (IRB) of the University of Texas Southwestern Medical Center at Dallas and the Veterans Administration North Texas Health Care System. The discovery cohort was obtained from subjects originally consented into one or more of four protocols approved by the IRB of the National Institute on Drug Abuse Intramural Research Program. Written informed consent was obtained prior to the study. The NTSCU (Hu et al., 2015) and TCD cohorts (McHugh et al., 2014; Adinoff et al., 2015) are drawn from two independent studies reported previously.
Image data acquisition
Subjects in the exploratory cohort were scanned on a 3T Siemens Allegra scanner (Siemens). A polyurethane foam helmet custom made for each participant was used to minimize head movement. Anatomical images were acquired using a 3D MPRAGE T1-weighted sequence with repetition time of 2.5 s, echo time of 4.38 ms, flip angle of 7° and voxel size of 1 × 1 × 1 mm3. Thirty-nine 4-mm thick slices were prescribed for the resting-state functional MRI acquisition using a single-shot gradient-echo planar imaging sequence with repetition time of 2 s, echo time of 27 ms, flip angle of 77° and in-plane resolution of 3.44 × 3.44 mm2. Each slice was AC–PC aligned without interslice gap to cover the whole brain. Subjects were instructed to keep their eyes closed and not to think of anything in particular during the 6-min resting scan.
The TCD cohort was scanned on a 3 T Phillips MR scanner using an eight-channel RF coil. Thirty-six 3-mm thick functional slices were obtained in the axial plane parallel to the AC–PC line using a single-shot gradient-echo planar imaging sequence with a matrix of 64 × 64, echo time of 25 ms, repetition time of 1.7 s, flip angle of 70°, field of view of 208 mm × 208 mm yielding an in-plane resolution of 3.25 mm × 3.25 mm. High resolution anatomic images were collected for all subjects to facilitate normalization and define white matter and CSF regions used in nuisance regression.
Cortical thickness construction
Cortical thickness was estimated using the structural MRI and FreeSurfer software (http://surfer.nmr.mgh.harvard.edu/) (Fischl and Dale, 2000). The processing pipeline included: removal of non-brain tissue; transformation to Talairach space; grey and white matter tissue segmentation; grey/white matter boundary tessellation; automated topology correction; surface deformation to optimally identify the grey/white and grey/CSF borders; cortical thickness computation by finding the shortest distance between the pial surface and the grey/white matter surfaces; and surface deformation to a spherical atlas for group analysis. The segmented images were visually checked and corrected as necessary. Cortical thickness was smoothed using a Gaussian smoothing kernel with a full-width at half-maximum (FWHM) of 15 mm to increase the signal-to-noise ratio and ensure a normal spatial distribution (Lerch et al., 2006; Pardoe et al., 2013).
A general linear model (GLM) was used to detect cortical thickness differences between NTSCUs and healthy control subjects with current nicotine use included as a fixed nuisance factor. Corrections for multiple comparisons (Pcorrected < 0.05) were performed using Qdec (Hagler et al., 2006) under FreeSurfer.
Resting-state functional MRI data preprocessing
Preprocessing of resting-state functional MRI, which was conducted in AFNI (Cox, 1996) and SPM8 (http://www.fil.ion.ucl.ac.uk/spm/software/spm8/), included the following steps: slice-timing correction, motion correction, nuisance regression, quadratic detrending, low-pass temporal filtering (<0.1 Hz), normalization, and smoothing with a 6 mm Gaussian kernel. Twelve nuisance regressors included the first three principal components of the time courses from white matter and CSF regions separately and the six rigid head motion parameters. An unbiased, group-wise non-linear registration (Geng et al., 2009; Gu et al., 2010) was performed to normalized resting-state functional MRI data to standard Talairach space with a resolution of 3 × 3 × 3 mm3. We also examined head motion using a scalar frame displacement quantity (Power et al., 2012; Hu et al., 2015). There were no significant differences in head motion during the resting scan between NTSCUs and healthy control subjects.
Resting-state functional connectivity
The rsFC data were analysed using AFNI (Cox, 1996) and MATLAB (The MathWorks, Inc., Natick, MA). Regions with significant thickness difference between NTSCUs and healthy control subjects (see below) were used as seeds in a subsequent rsFC analysis. A functional connectivity map for each seed region of interest was obtained by computing the correlation coefficient (cc) between each voxel’s time course with the mean time course of the region of interest. The correlation coefficient maps were submitted to Fisher’s r-to-z transformation, given by z = 0.5 × ln[(1 + cc) / (1 − cc)]. Group-level rsFC maps were obtained by performing one-sample t-tests on the z-maps for each individual seed. The statistical significance (Pcorrected < 0.001) was determined by a threshold of t(63) > 4.368 and a cluster size of 50 voxels in the NTSCUs and a threshold of t(66) > 4.356 with a cluster size of 50 voxels in healthy control subjects using the non-parametric method ‘randomise’ implemented in FSL (Winkler et al., 2014). The logic OR combination of these two group rsFC maps for individual seed were used as analysis masks in the next step of group difference analysis. Difference in z-maps between NTSCUs and healthy control subjects for each region of interest was examined using a GLM with current nicotine use as a nuisance factor. Multiple comparison correction was performed within the analysis masks. A threshold of t(129) > 2.62 with a cluster threshold of 100 voxels was considered as significant with correction for multiple comparisons (Pcorrected < 0.05) using the non-parametric method ‘randomise’ in FSL.
Imaging indices and behavioural measures
To investigate the relationship between altered cortical thickness, rsFC and cocaine use, regression analyses were performed using SPSS 20.0 (IBM Corporation, Armonk, NY) in regions showing significant group differences in thickness or connectivity strength against total years and current amount of cocaine use. When a seed region of interest produced multiple, non-contiguous clusters of rsFC difference between NTSCU and healthy controls, the rsFC between the seed and each individual cluster was considered a circuit in follow-up analyses; results were Bonferroni corrected for the number of comparisons examined.
Circuit predictions of relapse
Survival analysis with a Cox regression model (α = 0.05) was performed with SPSS 20.0 (IBM Corporation, Armonk, NY) to predict the days to relapse post-treatment in the treatment cohort using the circuits showing altered cortical thickness and rsFC strengths in the exploratory cohort. Forward conditional stepwise selection was employed to identify circuits that maximize the statistically significant contribution in predicting relapse status. Time-dependent receiver operating characteristics (ROC) curves were plotted for Days 30, 60, 90, 120 and 150 to estimate the predictive power of the relapse model over the 168-day follow-up period. As age and head motion (measured by frame displacement) have been shown to influence functional connectivity (Van Dijk et al., 2012; Geerligs et al., 2015), both were included as fixed terms in the model. In addition, years of education, IQ, days of cocaine use in last 90 days before admission to the treatment programme, days since last cocaine use prior to the MRI scan, and cigarettes per day were included in the model because they too may contribute to treatment outcome (Brorson et al., 2013).
Results
There were no significant differences in age, sex, IQ (as estimated by the WASI vocabulary subscale), years of education or head movement between NTSCUs and healthy control subjects (Table 1). Current nicotine use differed (P < 0.001), so this factor was considered in the between-group imaging analyses.
Cortical thickness between NTSCUs and healthy control subjects
Compared with healthy control subjects, the NTSCU group showed thinner bilateral insula and thicker bilateral temporal poles (TPs) (Pcorrected < 0.05; Fig. 1 and Supplementary Table 1). There was no significant difference in the mean cortical thickness between the groups.
Figure 1.

Cortical thickness and related rsFC differences between NTSCUs and healthy controls. (A) Cortical thickness differences between NTSCUs and healthy control subjects, which served as seeds regions in rsFC analyses. Blue clusters: lower thickness in NTSCUs; orange clusters: higher thickness in NTSCUs. (B) Functional connectivity patterns in healthy control subjects and NTSCUs. Green: healthy control subjects; red: NTSCUs; yellow: overlaps. (C) Functional connectivity differences between the two groups (Pcorrected < 0.05, blue colour indicates lower connectivity in users; also see Supplementary Table 2).
Resting-state functional connectivitiy between NTSCUs and healthy control subjects
Both NTSCUs and healthy control subjects showed similar rsFC patterns (see Fig. 1A for seed localizations, which were the regions of group difference in cortical thickness, and Fig. 1B for connectivity maps for each group along with the overlapped rsFC map across groups). Between-group comparisons revealed weaker connectivity strength in NTSCUs relative to healthy control subjects between both the left and right insula and the dorsal ACC. Additionally, NTSCUs showed weaker connectivity strength between the right temporal pole and both left and right middle/superior temporal gyri, supramarginal gyri, and medial prefrontal cortex (mPFC). This mPFC cluster is located mostly within the left hemisphere with a few voxels extending to the contralateral hemisphere. There was also a trend of weaker connectivity (Pcorrected = 0.08) between right temporal pole and the right medial superior frontal cortex (mSFC). Finally, NTSCUs showed weaker connectivity strength between the left temporal pole and the cerebellum, and a trend of weaker connectivity (Pcorrected = 0.06) between the left temporal pole and right middle/superior temporal gyrus (Fig. 1C and Supplementary Table 2).
Relationship with cocaine use measures
A total of 10 circuits showed weaker rsFC (eight were significant; two were at the trend level; Supplementary Table 2) were identified from the four regions of cortical thickness difference between NTSCUs and healthy control subjects. These 14 structural and functional measures were examined for their relationship to years of cocaine use and intensity of current cocaine use. Therefore, P < 0.0018 [0.05/(14 × 2)] was required for a result to be considered significant. The rsFC between the right temporal pole and the mSFC (RTP_6’ in Supplementary Table 2) was strongly negatively correlated with current cocaine use (P = 0.00016; Fig. 2). No relationship between current cocaine use and cortical thickness in regions of between-group differences was seen. The rsFC strength between the right insula and dorsal ACC was negatively correlated with years of cocaine use but only at a trend level (P = 0.008; Supplementary Fig. 2).
Figure 2.
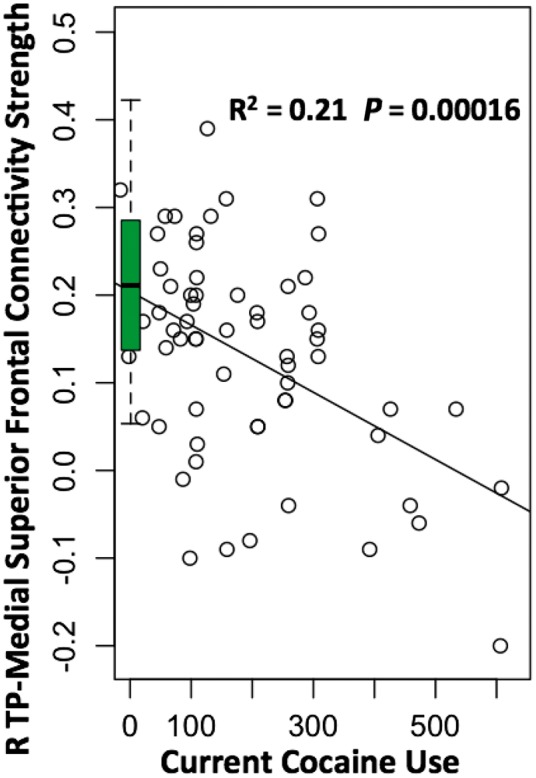
Correlation between the rsFC strength and cocaine use measures. Negative correlation between the rsFC strength of the right temporal pole and medial frontal gyrus and the current cocaine use. Boxplot summarizes the connectivity strength of the same circuits in the healthy control group.
As a recent study suggested that reduced grey matter volume in right anterior cingulate cortex was correlated with the years of cocaine use (Connolly et al., 2013), we conducted a correlation analysis between cortical thickness and years of cocaine use across the entire cortex, including age as a nuisance factor. We found small clusters in the right dorsal ACC, medial cingulate or superior frontal cortex, posterior cingulate cortex, and primary visual cortex that were negatively correlated with years of use, while bilateral fusiform cortex was positively correlated with years of use (Supplementary Fig. 3). However, no clusters survived stringent multiple comparison corrections.
Circuit predictions of relapse
Prior to the prediction analysis, we examined whether the identified functional circuits from the discovery (NTSCU) cohort also emerged in the TCDs. All 10 circuits reported in Supplementary Table 2 also showed significant positive connectivity strength (P’s < 0.001) in the TCD group.
As shown in Supplementary Fig. 1, the number of patients remaining abstinent decreased exponentially as a function of days after discharge. More than 50% of patients relapsed to drug use in the first month and only 18% of patients remained abstinent to the end of the 168 day follow-up. The cortical thickness in bilateral insula and bilateral temporal pole, as well as the rsFC strength of nine circuits (Supplementary Table 2, LTP_1, was omitted due to lack of cerebellum coverage in the treatment cohort) were extracted and, along with age, years of education, IQ, days of cocaine use in last 90 days prior to admission to the treatment programme, days since last cocaine use prior to the MRI scan, cigarettes per day, and head motion (frame displacement), put into a Cox regression model as predictors of treatment outcome in the TCD group. As illustrated in Supplementary Table 4, days to relapse were significantly predicted by the right TP–mPFC (RTP_4 in Supplementary Table 2; Fig. 3A) circuit strength together with years of education. Specifically, the risk of relapse decreased as the years of education increased (P = 0.008) and rsFC strength of the right TP–mPFC circuit increased (P = 0.032, Supplementary Table 5). The right TP–mPFC circuit strength remained significant in predicting relapse (P = 0.036) when education years was excluded in the model. We used correlation analysis to probe the relationship of this relapse-predicting circuit with addiction severity measures, including years of cocaine use, days of cocaine use in the 90 days prior to treatment admission, lifetime and recent (90 days prior to admission) InDUC (Inventory of Drug Use Consequences) scores, with age and head motion as covariates. There was no significant association between the right TP–mPFC circuit strength and any of these four measures (uncorrected P > 0.11).
Figure 3.

The rsFC strength between right temporal pole and mPFC that when combined with years of education, predicted cocaine relapse up to 168 days after completion of treatment. (A) An illustration of the TP-mPFC circuit. Arrow illustrates the rsFC between the seed and the target region but is not meant to suggest directionality. (B) ROC curves that illustrate the performance of the model (years of education and TP–mPFC rsFC strength as predictors) in predicting relapse at 30-day intervals following completion of residential treatment.
To estimate the predictive power of the relapse model using both years of education and right TP–mPFC rsFC strength, we used time-dependent ROC analysis to calculate time-dependent area under the curve, AUC(t), at t = 30, 60, 90, 120 and 150 days (Fig. 3B). The model showed an increasing predictive accuracy from 71% at Day 30 to 88% at 150 days [t (AUC): Days 30 (71%), 60 (73%), 90 (80%), 120 (79%), and 150 (88%)], which was a significant improvement over the model with education only [ΔP = 0.023; Supplementary Table 4: predictive accuracies: t(AUC): Days 30 (72%), 60 (68%), 90 (71%), 120 (69%), and 150 (78%)].
Discussion
Using a multimodal neuroimaging approach, we identified differences in cortical thickness in bilateral temporal pole and insula between NTSCUs and healthy control subjects. Using these four regions as seeds in rsFC analyses, eight rsFC circuits that differed between groups were identified. Applying these circuits to an independent treatment cohort, we found that the functional connectivity strength between right temporal pole and medial PFC, when combined with years of education (an inconsistent predictor in the literature; Brorson et al., 2013), predicts relapse status with 88% accuracy at 150 days after completion of treatment. As the TP–mPFC circuit is predictive of treatment outcome, it is deserving of further attention as a possible treatment target and guide to treatment planning.
Emerging evidence suggests that interactions within and between a few key large-scale brain networks play important roles in neuropsychiatric disorders, including drug addiction (Menon, 2011; Sutherland et al., 2012). Among these brain systems, the salience network has been proposed to direct attention to the currently most physiologically salient events arising from either internal or external stimuli, and the default mode network (DMN) is thought to support various self-referential functions, while the executive control network underlies a variety of higher cognitive functions (Menon, 2011). As discussed below, many of the brain regions identified in this study are key nodes within these large-scale networks and their dysregulation appears consistent with the addiction phenotype.
Neural circuit prediction of cocaine relapse
Bilateral temporal pole, thicker in NTSCUs compared with healthy control subjects, had lower connectivity strength to several DMN components. Furthermore, the right temporal pole connectivity to mPFC (a key DMN component) was negatively correlated with the intensity of current cocaine use. Indeed, the strength of a right temporal pole circuit to a nearby mPFC region positively predicted successful abstinence with a high level of accuracy when combined with years of education. Convergent evidence from studies in healthy populations suggests that the temporal pole and its connections with DMN components play a crucial role in social-emotional processes (Olson et al., 2013). Notably, the mPFC component of the DMN is known to be involved with Theory of Mind (the ability to think about the beliefs and intentions of others), a key social-emotional function (Amodio and Frith, 2006).
Previous neuroimaging studies to identify treatment outcome biomarkers focused on three major domains. First, task-based brain activation associated with various cognitive domains including inhibitory control (Go/NoGo), attentional bias, cognitive control (Stroop), working memory, and error-awareness. Several studies have identified activation in the dorsal ACC (Marhe et al., 2013), dorsolateral prefrontal cortex (dlPFC) (Brewer et al., 2008), thalamus (Moeller et al., 2010; Luo et al., 2013) and postcentral gyri (Prisciandaro et al., 2013) as predictive of relapse in cocaine dependence. Second, activation in ventral striatum (Bell et al., 2014), sensorimotor system and posterior cingulate cortex (Kosten et al., 2006) following various aspects of craving and cue responsivity have been shown predictive of cocaine relapse. Finally, while trait impulsivity is predictive of relapse by itself (Economidou et al., 2009), a putamen-posterior insular circuit, which correlates with impulsivity, also can predict post-treatment cocaine relapse (McHugh et al., 2013). These prior studies, which generally explain less than half of the variance in treatment outcome even in the cohort from which they are derived, suggests that relapse is related to multiple complex factors, some of which remain unidentified.
The TP–mPFC circuit identified in the current study may reflect one of these as yet unidentified components. This circuit likely relates to social emotional functioning in healthy individuals that may be disrupted in cocaine dependence. Both regions have been implicated in social emotional functions. For example, grey matter volume in anterior temporal lobe, which includes the temporal pole, correlates positively with size of the social group in which monkeys are housed (Sallet et al., 2011). Yet cocaine users, known to have smaller social networks, have thicker temporal poles in our study. As temporal pole is also known to link objects with autobiographical memory (Olson et al., 2013) and is engaged when cocaine users view a video with cocaine cues (Childress et al., 1999), our findings may suggest involvement of this area in the linkage of well-known objects to personal memories of drug use. Notably, the right TP–mPFC circuit we identified as being highly predictive of relapse is very similar to the mPFC region found by Preller et al. (2014) to be hypoactive in a mixed sample of cocaine users with and without dependence engaged in a social gaze task in which activation correlated to their social network size. At the behavioural level, impairments of social emotional function are well-documented in cocaine users, manifest as blunted response to social gaze, smaller social network size (Preller et al., 2014), impaired self-awareness and emotional empathy (cocaine dependence) (Moeller and Goldstein, 2014). Taken together with the right TP–mPFC circuit (combined with years of education) as a treatment outcome predictor, our results speak to the possible importance of addressing social emotional deficits in the treatment of cocaine dependence.
Garavan et al. (2013) proposed that neural differences seen in successful maintenance of abstinence may relate to (i) restoration of premorbid structure and/or function altered by drug use; (ii) compensatory changes supporting monitoring of relapse risk and suppressing drug urges; or (iii) a persistent vulnerability to addiction/relapse. While we do not have the data in the current study to fully evaluate how our result fits into this model, the observation that stronger connectivity in this circuit, which is weaker in NTSCUs, is related to longer abstinence makes it likely that this represents either restoration of function or a compensatory mechanism (assuming supra-normal connectivity is related to abstinence). As noted below in the Limitations and future directions’ section, additional work is needed to address this issue.
Insula structural and functional abnormalities
Alterations in the insula (a key component of the salience network) have consistently been reported in cocaine (and other; e.g. nicotine) (Zhang et al., 2011) dependent individuals, including lower cortical thickness (Makris et al., 2008) and lower grey matter volume (Franklin et al., 2002; Ersche et al., 2011) compared with healthy control subjects. As the insula receives and integrates interoceptive information with other emotionally salient stimuli (Craig, 2009), the lower insular cortical thickness found may reflect a disruption in neural substrates underpinning these functions. Numerous studies have reported a critical role of the insula in processing the urge to use drug (Garavan, 2010) along with disrupted decision-making processes (Paulus, 2007; Naqvi and Bechara, 2010). We recently reported in the same TCD cohort that rsFC between the posterior insula and putamen is weaker in cocaine-dependent individuals, with lower insular-putamen functional connectivity strength identifying those individuals who relapsed by 30 days following residential treatment (McHugh et al., 2013). Similarly, damage to the insula can result in a sudden and profound disruption of smoking behaviour, accompanied by a diminished urge to smoke (Naqvi et al., 2007). Indeed, we have demonstrated circuits between the amygdala and insula and between insula and the posterior cingulate and ventral mPFC, the latter two being key components of the DMN, that are increased in abstinence and reduced following nicotine or varenicline administration in abstinent smokers (Sutherland et al., 2013). Further, the insula to PCC connectivity was related to withdrawal/craving severity, suggesting that insula circuitry may help reduce the internal signals to seek drug (Sutherland et al., 2013). Taken together with the present data, insula-based circuitry may serve as a common drive mechanism in generalized drug addiction processing.
We observed lower functional connectivity strength between bilateral insula and dorsal ACC (the second key component of salience network) in the NTSCU versus healthy control group. It has been proposed (Sutherland et al., 2012) that the salience network may serve to toggle or switch an individual’s attentional resources between more external, environmental demands performed by the executive control network and the more internal rumination processing manifest within the DMN (Sridharan et al., 2008). The dorsal ACC is also known to play a critical role in cognitive control and decision-making. Lower activity in dorsal ACC (along with the insula in many cases) has been commonly observed in substance abusers performing attention, Stroop, inhibitory control, and affective tasks (Garavan and Stout, 2005; Li et al., 2008; Goldstein et al., 2009). The findings of weaker coupling in regions known to comprise the salience network (i.e. insular–dorsal ACC) together with lower insula thickness suggest a neurobiological mechanism by which cocaine dependence may be associated with aberrant saliency detection and integration, along with poor cognitive control and decision-making (Paulus, 2007; Naqvi and Bechara, 2010). Furthermore, since the connectivity between the insula and dorsal ACC was negatively correlated with years of cocaine use (although it did not survive a Bonferroni correction for 42 comparisons) and the intercept of our regression model indicates that the connectivity strength during the early stages of cocaine use was comparable with that seen in healthy control subjects, the salience network circuit-level dysfunction observed is more likely a consequence of chronic cocaine use, rather than a pre-existing condition.
Limitations and future directions
As the current NTSCU cohort was predominantly male (77%), we lacked power to fully explore the impact of sex on our results. While the groups have similar sex distributions, this does not preclude the possibility that females with cocaine dependence may have distinct pre-existing differences and undergo unique plastic changes from males. As the sex composition of the TCD cohort was similar (87% male), it is possible that our predictive model is only valid in males.
As testing the relevance of results from the NTSCU versus healthy controls in the independent TCD population was not planned prior to data gathering in either population, the measures of cocaine use in the TCD population were chosen to be useful for their treatment study and not to match variables gathered in the NTSCU study. Our interest, however, is in identifying generalizable results to other cocaine using populations and might be useful in guiding treatment and developing new treatments, rendering uniform clinical characterization less critical.
The TCD cohort was scanned at the end of treatment. Therefore, we cannot say whether the predictive circuit may have changed over the course of treatment and be a marker of a good response or if it was stable across treatment and identifies people with a better prognosis to begin with. Similarly, we do not have measures of social functioning in either cohort and must rely on the literature for interpretation of these results.
Future work is needed to clarify differences that may exist between male and female cocaine-dependent individuals. Further exploration of the plasticity of these circuits, especially the right TP–mPFC circuit, across treatment will help clarify if differences relate to restoration of function, demonstrate compensatory changes necessary to maintain abstinence or relate to pre-existing differences that predispose to addiction and relapse (Garavan et al., 2013). Better characterization of their relationship to clinical features of cocaine dependence, with particular attention to social functioning, will help in developing these results into useful clinical tools to guide treatment decisions. Analysis approaches that take into account more complex interactions between brain regions may also help elucidate novel treatment targets.
Conclusion
By combining structural and functional imaging data from a matched cohort of NTSCUs and healthy control subjects, we identified cortical thickness differences that are in turn, associated with altered functional circuits whose nodes include key components of the salience network and DMN. While some of the findings were consistent with previous findings in the literature and thus more likely to be true differences between cocaine users and healthy controls, to identify findings that not only differentiate cocaine users from healthy controls but are broadly applicable and have clinical significance to the disorder, we applied these functional circuit differences to an independent cocaine treatment cohort and identified a circuit between the right temporal pole and mPFC that, when combined with years of education, predicted relapse status up to 150 days after completion of treatment with 88% accuracy. Taken together, these multimodal results support previously identified social emotional deficits in cocaine dependence and underscore the importance of developing psychosocial therapeutic strategies for the treatment of cocaine dependence.
Supplementary Material
Acknowledgements
The authors gratefully acknowledge the assistance of the Substance Abuse Team at the VA North Texas Health Care System, Homeward Bound, Inc., and Nexus Recovery Center for their support in the screening and recruitment of the treatment study subjects.
Glossary
Abbreviations
- ACC
anterior cingulate cortex
- DMN
default mode network
- mPFC
medial prefrontal cortex
- NTSCUs
non-treatment-seeking cocaine users
- rsFC
resting-state functional connectivity
- TCD
treatment-completed cocaine-dependent
- TP
temporal pole
Funding
This study was supported by the Intramural Research Program of the National Institute on Drug Abuse (NIDA) and NIDA grant DA023203 (BA, MDD) and ULT1R000451 (National Institutes of Health CTSA/UT-STAR).
Supplementary material
Supplementary material is available at Brain online.
References
- Adinoff B, Gu H, Merrick C, McHugh M, Jeon-Slaughter H, Lu H. et al. Basal hippocampal activity and its functional connectivity predicts cocaine relapse. Biol Psychiatry 2015; 78: 496–504. [DOI] [PMC free article] [PubMed] [Google Scholar]
- Amodio DM, Frith CD. Meeting of minds: the medial frontal cortex and social cognition. Nat Rev Neurosci 2006; 7: 268–77. [DOI] [PubMed] [Google Scholar]
- Bell RP, Garavan H, Foxe JJ. Neural correlates of craving and impulsivity in abstinent former cocaine users: towards biomarkers of relapse risk. Neuropharmacology 2014; 85: 461–70. [DOI] [PMC free article] [PubMed] [Google Scholar]
- Brewer JA, Worhunsky PD, Carroll KM, Rounsaville BJ, Potenza MN. Pretreatment brain activation during stroop task is associated with outcomes in cocaine-dependent patients. Biol Psychiatry 2008; 64: 998–1004. [DOI] [PMC free article] [PubMed] [Google Scholar]
- Brorson HH, Ajo Arnevik E, Rand-Hendriksen K, Duckert F. Drop-out from addiction treatment: a systematic review of risk factors. Clin Psychol Rev 2013; 33: 1010–24. [DOI] [PubMed] [Google Scholar]
- Camchong J, MacDonald AW, Nelson B, Bell C, Mueller BA, Specker S. et al. Frontal hyperconnectivity related to discounting and reversal learning in cocaine subjects. Biol Psychiatry 2011; 69: 1117–23. [DOI] [PMC free article] [PubMed] [Google Scholar]
- Childress AR, Mozley PD, McElgin W, Fitzgerald J, Reivich M, O’Brien CP. Limbic activation during cue-induced cocaine craving. Am J Psychiatry 1999; 156: 11–8. [DOI] [PMC free article] [PubMed] [Google Scholar]
- Cisler JM, Elton A, Kennedy AP, Young J, Smitherman S, Andrew James G. et al. Altered functional connectivity of the insular cortex across prefrontal networks in cocaine addiction. Psychiatry Res 2013; 213: 39–46. [DOI] [PMC free article] [PubMed] [Google Scholar]
- Connolly CG, Bell RP, Foxe JJ, Garavan H. Dissociated grey matter changes with prolonged addiction and extended abstinence in cocaine users. PloS One 2013; 8: e59645. [DOI] [PMC free article] [PubMed] [Google Scholar]
- Cox RW. AFNI: software for analysis and visualization of functional magnetic resonance neuroimages. Comput Biomed Res 1996; 29: 162–73. [DOI] [PubMed] [Google Scholar]
- Craig AD. How do you feel–now? The anterior insula and human awareness. Nat Rev Neurosci 2009; 10: 59–70. [DOI] [PubMed] [Google Scholar]
- Damoiseaux JS, Greicius MD. Greater than the sum of its parts: a review of studies combining structural connectivity and resting-state functional connectivity. Brain Struct Funct 2009; 213: 525–33. [DOI] [PubMed] [Google Scholar]
- Economidou D, Pelloux Y, Robbins TW, Dalley JW, Everitt BJ. High impulsivity predicts relapse to cocaine-seeking after punishment-induced abstinence. Biol Psychiatry 2009; 65: 851–6. [DOI] [PubMed] [Google Scholar]
- Ersche KD, Barnes A, Jones PS, Morein-Zamir S, Robbins TW, Bullmore ET. Abnormal structure of frontostriatal brain systems is associated with aspects of impulsivity and compulsivity in cocaine dependence. Brain 2011; 134 (Pt 7): 2013–24. [DOI] [PMC free article] [PubMed] [Google Scholar]
- Ersche KD, Jones PS, Williams GB, Turton AJ, Robbins TW, Bullmore ET. Abnormal brain structure implicated in stimulant drug addiction. Science 2012; 335: 601–4. [DOI] [PubMed] [Google Scholar]
- Fischl B, Dale AM. Measuring the thickness of the human cerebral cortex from magnetic resonance images. Proc Natl Acad Sci USA 2000; 97: 11050–5. [DOI] [PMC free article] [PubMed] [Google Scholar]
- Franklin TR, Acton PD, Maldjian JA, Gray JD, Croft JR, Dackis CA. et al. Decreased gray matter concentration in the insular, orbitofrontal, cingulate, and temporal cortices of cocaine patients. Biol Psychiatry 2002; 51: 134–42. [DOI] [PubMed] [Google Scholar]
- Gabrieli JD, Ghosh SS, Whitfield-Gabrieli S. Prediction as a humanitarian and pragmatic contribution from human cognitive neuroscience. Neuron 2015; 85: 11–26. [DOI] [PMC free article] [PubMed] [Google Scholar]
- Garavan H. Insula and drug cravings. Brain Struct Funct 2010; 214: 593–601. [DOI] [PubMed] [Google Scholar]
- Garavan H, Brennan KL, Hester R, Whelan R. The neurobiology of successful abstinence. Curr Opin Neurobiol 2013; 23: 668–74. [DOI] [PMC free article] [PubMed] [Google Scholar]
- Garavan H, Stout JC. Neurocognitive insights into substance abuse. Trends Cogn Sci 2005; 9: 195–201. [DOI] [PubMed] [Google Scholar]
- Geerligs L, Renken RJ, Saliasi E, Maurits NM, Lorist MM. A brain-wide study of age-related changes in functional connectivity. Cereb Cortex 2015; 25: 1987–99. [DOI] [PubMed] [Google Scholar]
- Geng X, Christensen GE, Gu H, Ross TJ, Yang Y. Implicit reference-based group-wise image registration and its application to structural and functional MRI. Neuroimage 2009; 47: 1341–51. [DOI] [PMC free article] [PubMed] [Google Scholar]
- Goldstein RZ, Alia-Klein N, Tomasi D, Carrillo JH, Maloney T, Woicik PA. et al. Anterior cingulate cortex hypoactivations to an emotionally salient task in cocaine addiction. Proc Natl Acad Sci USA 2009; 106: 9453–8. [DOI] [PMC free article] [PubMed] [Google Scholar]
- Gu H, Salmeron BJ, Ross TJ, Geng X, Zhan W, Stein EA. et al. Mesocorticolimbic circuits are impaired in chronic cocaine users as demonstrated by resting-state functional connectivity. Neuroimage 2010; 53: 593–601. [DOI] [PMC free article] [PubMed] [Google Scholar]
- Hagler DJ, Saygin AP, Sereno MI. Smoothing and cluster thresholding for cortical surface-based group analysis of fMRI data. Neuroimage 2006; 33: 1093–103. [DOI] [PMC free article] [PubMed] [Google Scholar]
- Honey CJ, Kötter R, Breakspear M, Sporns O. Network structure of cerebral cortex shapes functional connectivity on multiple time scales. Proc Natl Acad Sci USA 2007; 104: 10240–5. [DOI] [PMC free article] [PubMed] [Google Scholar]
- Hoptman MJ, Antonius D, Mauro CJ, Parker EM, Javitt DC. Cortical thinning, functional connectivity, and mood-related impulsivity in schizophrenia: relationship to aggressive attitudes and behavior. Am J Psychiatry 2014; 171: 939–48. [DOI] [PMC free article] [PubMed] [Google Scholar]
- Hu Y, Salmeron BJ, Gu H, Stein EA, Yang Y. Impaired functional connectivity within and between frontostriatal circuits and its association with compulsive drug use and trait impulsivity in cocaine addiction. JAMA Psychiatry 2015; 72: 584–92. [DOI] [PubMed] [Google Scholar]
- Kelly C, Zuo XN, Gotimer K, Cox CL, Lynch L, Brock D. et al. Reduced interhemispheric resting state functional connectivity in cocaine addiction. Biol Psychiatry 2011; 69: 684–92. [DOI] [PMC free article] [PubMed] [Google Scholar]
- Kosten TR, Scanley BE, Tucker KA, Oliveto A, Prince C, Sinha R. et al. Cue-induced brain activity changes and relapse in cocaine-dependent patients. Neuropsychopharmacology 2006; 31: 644–50. [DOI] [PubMed] [Google Scholar]
- Lerch JP, Worsley K, Shaw WP, Greenstein DK, Lenroot RK, Giedd J. et al. Mapping anatomical correlations across cerebral cortex (MACACC) using cortical thickness from MRI. Neuroimage 2006; 31: 993–1003. [DOI] [PubMed] [Google Scholar]
- Li CSR, Huang C, Yan PS, Bhagwagar Z, Milivojevic V, Sinha R. Neural correlates of impulse control during stop signal inhibition in cocaine-dependent men. Neuropsychopharmacology 2008; 33: 1798–806. [DOI] [PMC free article] [PubMed] [Google Scholar]
- Luo X, Zhang S, Hu S, Bednarski SR, Erdman E, Farr OM. et al. Error processing and gender-shared and -specific neural predictors of relapse in cocaine dependence. Brain 2013; 136 (Pt 4): 1231–44. [DOI] [PMC free article] [PubMed] [Google Scholar]
- Makris N, Gasic GP, Kennedy DN, Hodge SM, Kaiser JR, Lee MJ. et al. Cortical thickness abnormalities in cocaine addiction–a reflection of both drug use and a pre-existing disposition to drug abuse?. Neuron 2008; 60: 174–88. [DOI] [PMC free article] [PubMed] [Google Scholar]
- Marhe R, Luijten M, van de Wetering BJ, Smits M, Franken IH. Individual differences in anterior cingulate activation associated with attentional bias predict cocaine use after treatment. Neuropsychopharmacology 2013; 38: 1085–93. [DOI] [PMC free article] [PubMed] [Google Scholar]
- Matochik JA, London ED, Eldreth DA, Cadet JL, Bolla KI. Frontal cortical tissue composition in abstinent cocaine abusers: a magnetic resonance imaging study. Neuroimage 2003; 19: 1095–102. [DOI] [PubMed] [Google Scholar]
- McHugh MJ, Demers CH, Braud J, Briggs R, Adinoff B, Stein EA. Striatal-insula circuits in cocaine addiction: implications for impulsivity and relapse risk. Am J Drug Alcohol Abuse 2013; 39: 424–32. [DOI] [PubMed] [Google Scholar]
- McHugh MJ, Demers CH, Salmeron BJ, Devous MD Sr, Stein EA, Adinoff B. Cortico-amygdala coupling as a marker of early relapse risk in cocaine-addicted individuals. Front Psychiatry 2014; 5: 16. [DOI] [PMC free article] [PubMed] [Google Scholar]
- Menon V. Large-scale brain networks and psychopathology: a unifying triple network model. Trends Cogn Sci 2011; 15: 483–506. [DOI] [PubMed] [Google Scholar]
- Moeller FG, Steinberg JL, Schmitz JM, Ma L, Liu S, Kjome KL. et al. Working memory fMRI activation in cocaine-dependent subjects: association with treatment response. Psychiatry Res 2010; 181: 174–82. [DOI] [PMC free article] [PubMed] [Google Scholar]
- Moeller SJ, Goldstein RZ. Impaired self-awareness in human addiction: deficient attribution of personal relevance. Trends Cogn Sci 2014; 18: 635–41. [DOI] [PMC free article] [PubMed] [Google Scholar]
- Munoz-Cuevas FJ, Athilingam J, Piscopo D, Wilbrecht L. Cocaine-induced structural plasticity in frontal cortex correlates with conditioned place preference. Nat Neurosci 2013; 16: 1367–9. [DOI] [PMC free article] [PubMed] [Google Scholar]
- Naqvi NH, Bechara A. The insula and drug addiction: an interoceptive view of pleasure, urges, and decision-making. Brain Struct Funct 2010; 214: 435–50. [DOI] [PMC free article] [PubMed] [Google Scholar]
- Naqvi NH, Rudrauf D, Damasio H, Bechara A. Damage to the insula disrupts addiction to cigarette smoking. Science 2007; 315: 531–4. [DOI] [PMC free article] [PubMed] [Google Scholar]
- Olson IR, McCoy D, Klobusicky E, Ross LA. Social cognition and the anterior temporal lobes: a review and theoretical framework. Soc Cogn Affect Neurosci 2013; 8: 123–33. [DOI] [PMC free article] [PubMed] [Google Scholar]
- Pardoe HR, Abbott DF, Jackson GD, Alzheimer’s Disease Neuroimaging Initiative. Sample size estimates for well-powered cross-sectional cortical thickness studies. Hum Brain Mapp 2013; 34: 3000–9. [DOI] [PMC free article] [PubMed] [Google Scholar]
- Paulus MP. Decision-making dysfunctions in psychiatry–altered homeostatic processing?. Science 2007; 318: 602–6. [DOI] [PubMed] [Google Scholar]
- Power JD, Barnes KA, Snyder AZ, Schlaggar BL, Petersen SE. Spurious but systematic correlations in functional connectivity MRI networks arise from subject motion. Neuroimage 2012; 59: 2142–54. [DOI] [PMC free article] [PubMed] [Google Scholar]
- Preller KH, Herdener M, Schilbach L, Stampfli P, Hulka LM, Vonmoos M. et al. Functional changes of the reward system underlie blunted response to social gaze in cocaine users. Proc Natl Acad Sci USA 2014; 111: 2842–7. [DOI] [PMC free article] [PubMed] [Google Scholar]
- Prisciandaro JJ, Myrick H, Henderson S, McRae-Clark AL, Brady KT. Prospective associations between brain activation to cocaine and no-go cues and cocaine relapse. Drug Alcohol Depend 2013; 131: 44–9. [DOI] [PMC free article] [PubMed] [Google Scholar]
- Robinson TE, Kolb B. Structural plasticity associated with exposure to drugs of abuse. Neuropharmacology 2004; 47 (Suppl 1): 33–46. [DOI] [PubMed] [Google Scholar]
- Sallet J, Mars RB, Noonan MP, Andersson JL, O’Reilly JX, Jbabdi S. et al. Social network size affects neural circuits in macaques. Science 2011; 334: 697–700. [DOI] [PubMed] [Google Scholar]
- Schuz A, Palm G. Density of neurons and synapses in the cerebral cortex of the mouse. J Comp Neurol 1989; 286: 442–55. [DOI] [PubMed] [Google Scholar]
- Sridharan D, Levitin DJ, Menon V. A critical role for the right fronto-insular cortex in switching between central-executive and default-mode networks. Proc Natl Acad Sci USA 2008; 105: 12569–74. [DOI] [PMC free article] [PubMed] [Google Scholar]
- Sui J, Huster R, Yu Q, Segall JM, Calhoun VD. Function-structure associations of the brain: evidence from multimodal connectivity and covariance studies. Neuroimage 2014; 102 (Pt 1): 11–23. [DOI] [PMC free article] [PubMed] [Google Scholar]
- Sutherland MT, Carroll AJ, Salmeron BJ, Ross TJ, Hong LE, Stein EA. Down-regulation of amygdala and insula functional circuits by varenicline and nicotine in abstinent cigarette smokers. Biol Psychiat 2013; 74: 538–46. [DOI] [PMC free article] [PubMed] [Google Scholar]
- Sutherland MT, McHugh MJ, Pariyadath V, Stein EA. Resting state functional connectivity in addiction: lessons learned and a road ahead. Neuroimage 2012; 62: 2281–95. [DOI] [PMC free article] [PubMed] [Google Scholar]
- Van Dijk KR, Sabuncu MR, Buckner RL. The influence of head motion on intrinsic functional connectivity MRI. Neuroimage 2012; 59: 431–8. [DOI] [PMC free article] [PubMed] [Google Scholar]
- Winkler AM, Ridgway GR, Webster MA, Smith SM, Nichols TE. Permutation inference for the general linear model. Neuroimage 2014; 92: 381–97. [DOI] [PMC free article] [PubMed] [Google Scholar]
- Wisner KM, Patzelt EH, Lim KO, MacDonald AW. An intrinsic connectivity network approach to insula-derived dysfunctions among cocaine users. Am J Drug Alcohol Abuse 2013; 39: 403–13. [DOI] [PubMed] [Google Scholar]
- Worhunsky PD, Stevens MC, Carroll KM, Rounsaville BJ, Calhoun VD, Pearlson GD. et al. Functional brain networks associated with cognitive control, cocaine dependence, and treatment outcome. Psychol Addict Behav 2013; 27: 477–88. [DOI] [PMC free article] [PubMed] [Google Scholar]
- Zhang X, Salmeron BJ, Ross TJ, Geng X, Yang Y, Stein EA. Factors underlying prefrontal and insula structural alterations in smokers. Neuroimage 2011; 54: 42–8. [DOI] [PMC free article] [PubMed] [Google Scholar]
Associated Data
This section collects any data citations, data availability statements, or supplementary materials included in this article.