

Whether mild traumatic brain injury (mTBI) confers increased risk of Alzheimer's disease is unknown. Hayes et al. report that mTBI in war veterans is associated with reduced cortical thickness among those at high genetic risk for Alzheimer's disease, which in turn is associated with reduced memory recall.
Keywords: polygenic risk score, MRI, neuroimaging genetics, neurodegenerative, episodic memory
Abstract
Moderate-to-severe traumatic brain injury is one of the strongest environmental risk factors for the development of neurodegenerative diseases such as late-onset Alzheimer’s disease, although it is unclear whether mild traumatic brain injury, or concussion, also confers risk. This study examined mild traumatic brain injury and genetic risk as predictors of reduced cortical thickness in brain regions previously associated with early Alzheimer’s disease, and their relationship with episodic memory. Participants were 160 Iraq and Afghanistan War veterans between the ages of 19 and 58, many of whom carried mild traumatic brain injury and post-traumatic stress disorder diagnoses. Whole-genome polygenic risk scores for the development of Alzheimer’s disease were calculated using summary statistics from the largest Alzheimer’s disease genome-wide association study to date. Results showed that mild traumatic brain injury moderated the relationship between genetic risk for Alzheimer’s disease and cortical thickness, such that individuals with mild traumatic brain injury and high genetic risk showed reduced cortical thickness in Alzheimer’s disease-vulnerable regions. Among males with mild traumatic brain injury, high genetic risk for Alzheimer’s disease was associated with cortical thinning as a function of time since injury. A moderated mediation analysis showed that mild traumatic brain injury and high genetic risk indirectly influenced episodic memory performance through cortical thickness, suggesting that cortical thinning in Alzheimer’s disease-vulnerable brain regions is a mechanism for reduced memory performance. Finally, analyses that examined the apolipoprotein E4 allele, post-traumatic stress disorder, and genetic risk for schizophrenia and depression confirmed the specificity of the Alzheimer’s disease polygenic risk finding. These results provide evidence that mild traumatic brain injury is associated with greater neurodegeneration and reduced memory performance in individuals at genetic risk for Alzheimer’s disease, with the caveat that the order of causal effects cannot be inferred from cross-sectional studies. These results underscore the importance of documenting head injuries even within the mild range as they may interact with genetic risk to produce negative long-term health consequences such as neurodegenerative disease.
Introduction
Traumatic brain injury (TBI) results from an external force applied to the head that causes alterations in consciousness such as dizziness, amnesia, or loss of consciousness. TBI of varying levels of severity has been associated with neural and cognitive changes that can persist chronically, years after the initial injury (Kraus et al., 2007; Hayes et al., 2015; Miller et al., 2016). Of concern for the millions of Americans injured each year, TBI is one of the strongest environmental risk factors for the development of neurodegenerative diseases such as late-onset Alzheimer’s disease and chronic traumatic encephalopathy. The link between TBI and Alzheimer’s disease has been studied for several decades, with two meta-analyses confirming enhanced risk for Alzheimer’s disease following TBI, particularly among males (Mortimer et al., 1991; Fleminger et al., 2003). However, the mechanisms that instantiate risk for Alzheimer’s disease after TBI are unknown. Researchers have noted a number of common features associated with both TBI and Alzheimer’s disease including inflammatory and apoptotic (i.e. programmed cell death) processes, along with the accumulation of proteins that contribute to cell death. For instance, Uryu et al. (2002, 2007) demonstrated in both mouse models and in human subjects that TBI is associated with amyloid-β, α-synuclein, and tau, three pathological markers of Alzheimer’s disease.
However, the aforementioned neurodegenerative markers have primarily been observed in moderate-to-severe TBI (Johnson et al., 2012) and some have suggested that risk for dementia following TBI increases with severity (Plassman et al., 2000). Although there is some preliminary evidence that mild TBI is also associated with increased risk of dementia and its biomarkers in older adults (Gardner et al., 2014), the evidence has been inconsistent and has led some to suggest that mild TBI alone, without the presence of additional risk factors, may be insufficient to develop dementia (Bigler, 2013). As the majority of TBIs sustained in civilian and military contexts are within the mild range (Cassidy et al., 2004; Terrio et al., 2009), the relationship between mild TBI and dementia risk is an important issue requiring further study.
In addition to environmental risks for Alzheimer’s disease (e.g. TBI), there is abundant evidence for genetic contributions to the disease. In light of the strong heritability of late-onset Alzheimer’s disease (60–80%; Gatz et al., 2006), an important question is whether TBI moderates the genetic risk for Alzheimer’s disease. Studies to date have focused on TBI in individuals carrying the apolipoprotein (APOE) E4 allele, with inconsistent results. Some studies have found poorer outcomes in E4 carriers following TBI (Jordan et al., 1997; Friedman et al., 1999), whereas others have not, or have found that E4 carriers were less likely to have dementia following head injury (Guo et al., 2000; Jellinger et al., 2001; Chamelian et al., 2004).
Interest has grown in the calculation of polygenic risk scores to index genetic risk since the publication of a seminal Psychiatric Genomics Consortium study that used a polygenic score to explore the genetic architecture of schizophrenia and bipolar disorder (Purcell et al., 2009). A polygenic risk score uses the results from a genome-wide association study (GWAS) of a particular trait to compute a genetic propensity score for that trait in a new sample or cohort with available genome-wide genotype data. Recent work suggests that polygenic risk scores for Alzheimer’s disease are better predictors of Alzheimer’s disease than are single candidate variants such as APOE. It has been shown that genome-wide single nucleotide polymorphism (SNP) analysis explained 33% of the phenotypic variance in Alzheimer’s disease in comparison to 6% explained with APOE, and the 8% of variance explained by the combination of 11 other Alzheimer’s disease risk SNPs (Ridge et al., 2013). Recently, Sabuncu et al. (2012) demonstrated that healthy subjects with higher polygenic risk scores derived from an Alzheimer’s disease GWAS showed reduced cortical thickness in areas affected most by Alzheimer’s disease (Sabuncu et al., 2011). These results suggest that polygenic risk scores may serve as predictors of prodromal Alzheimer’s disease-related brain pathology.
In the present study, we hypothesized that individuals with both mild TBI and high polygenic risk for Alzheimer’s disease would be the most likely to show reduced cortical thickness in previously identified Alzheimer’s disease-vulnerable regions (Sabuncu et al., 2011). Further, we investigated the hypothesis that reduced cortical thickness in these same regions reflected a neurodegenerative process by examining associations between cortical thickness and years passed since the mild TBI. Finally, we hypothesized that reduced cortical thickness would be associated with lower delayed memory performance, a neuropsychological domain particularly sensitive in detecting Alzheimer’s disease. In additional analyses, we examined specificity of the main findings by considering whether repetitive mild TBI, the APOE E4 allele, and polygenic risk for mental illnesses were also significant predictors of cortical thickness. We examined these hypotheses in a sample of Iraq and Afghanistan War veterans exposed to a range of mild TBI events during their lifetimes, including direct forceful contact of the head and blast-related mild TBI experienced in combat. Among those exposed to TBI, the sample was limited to individuals with mild severity in order to examine potential links between this most common type of TBI and markers of neurodegenerative disease. We sought to shed light on whether there are markers of prodromal neurodegeneration (i.e. reduced cortical thickness in Alzheimer’s disease-vulnerable regions) in a younger cohort of veterans who were exposed to TBI (i.e. those who served in the Iraq and Afghanistan Wars). Although it is known that TBI in older military personnel is associated with a 60% increase in the risk of developing neurodegenerative disease (Barnes et al., 2014), detection of neurodegenerative markers in a younger cohort would have important implications for development of interventions to inhibit TBI-induced neurodegeneration as well as long-term care for these veterans. Finally, we studied the influence of post-traumatic stress disorder (PTSD) during the lifespan on Alzheimer’s disease-related cortical thinning, a common comorbidity in the veteran cohort, which shares behavioural symptoms with neurodegenerative disease (Omalu et al., 2011).
Materials and methods
Participants
The final sample included 160 white non-Hispanic veterans of Operations Enduring Freedom, Iraqi Freedom, and New Dawn who were consecutively enrolled into the Translational Research Center for TBI and Stress Disorders (TRACTS) at the Jamaica Plain Division of the Veterans Affairs Boston Healthcare System. Participants were recruited from throughout the Boston Metropolitan area through outreach military community events (e.g. Yellow Ribbon events). We used all available TRACTS data that met our selection criteria. We first identified 258 white, non-Hispanic subjects to avoid population stratification effects. Of these, 55 subjects were missing genotype data, an additional 29 were missing neuroimaging data, eight were missing clinical assessment data, and six individuals were excluded because they had moderate and/or severe TBI. Demographics as a function of mild TBI status in the entire sample are shown in Table 1 and characteristics of the mild TBI sample, including nature of injury, and duration of alterations in mental status, post-traumatic amnesia, and loss of consciousness are shown in Table 2. All subjects experienced alterations in mental status, 76% experienced post-traumatic amnesia, and 57% of the sample experienced loss of consciousness. The groups did not differ significantly in age, sex, or Wechsler Test of Adult Reading-estimated IQ (WTAR; Wechsler, 2001), but they did differ in the presence of lifetime PTSD and sleep disturbance. Additional details regarding inclusion/exclusion criteria for the sample are included in the Supplementary material. Study procedures were approved by the VA Boston Institutional Review Board and all participants provided written informed consent consistent with the Declaration of Helsinki.
Table 1.
Demographic and clinical characteristics
| Variable | Total (n = 160) | No lifetime mild TBI (n = 55) | Lifetime mild TBI (n = 105) | Group comparison |
|---|---|---|---|---|
| Age in years, mean (SD) | 31.36 (8.4) | 32.85 (8.9) | 30.57 (8.1) | t(158) = 1.64, P = 0.103 |
| Males, n (%) | 149 (93.1) | 51 (92.7) | 98 (93.3) | χ2(1) = 0.02, P = 0.89 |
| WTAR Estimated IQ, mean (SD) | 102.12 (19.8) | 103.42 (11.9) | 101.45 (22.9) | t(158) = 0.60, P = 0.55 |
| APOE ɛ4 status n (%) | 37 (23.1) | 10 (18.2) | 27 (25.7) | χ2(1) = 1.15, P = 0.28 |
| Lifetime PTSD diagnosis n (%) | 112 (70.0) | 28 (50.9) | 84 (80.0) | χ2(1) = 14.55, P < 0.001 |
| PSQI, n (%) | 113 (70.6) | 31 (56.4) | 82 (78.1) | χ2(1) = 8.22, P = 0.004 |
Table 2.
Injury characteristics of the mild TBI sample
| Lifetime mild TBI (n, %) | |
| Total | 105, 100% |
| Military-related mild TBI | 56, 53% |
| More than one mild TBI | 49, 47% |
| Most severe mild TBI (minutes, SD) | |
| Altered mental status | 126.12, 438.97 |
| Post-traumatic amnesia | 25.44, 131.26 |
| Loss of consciousness | 2.37, 4.96 |
| Nature of injury (most severe) | |
| Military mild TBI | |
| Blast | 25 |
| Fall | 5 |
| Motor vehicle accident | 4 |
| Physical assault | 2 |
| Sports-related injury | 4 |
| Othera | 5 |
| Total | 45 |
| Pre-deployment mild TBI | |
| Fall | 7 |
| Motor vehicle accident | 10 |
| Physical assault | 7 |
| Sports-related injury | 23 |
| Othera | 6 |
| Total | 53 |
| Post-deployment mild TBI | |
| Fall | 1 |
| Motor vehicle accident | 2 |
| Physical assault | 1 |
| Sports-related injury | 2 |
| Othera | 1 |
| Total | 7 |
| Nature of injury Totals (n, %) | |
| Blast | 25, 24% |
| Fall | 13, 12% |
| Motor vehicle accident | 16, 15% |
| Physical assault | 10, 10% |
| Sports-related injury | 29, 28% |
| Othera | 12, 11% |
aOther injuries include: hit by blunt object (e.g. pole, bar, vehicle, ceiling). Most severe nature of injury is reported, but many individuals had multiple types of injuries. Most severe mild TBI was determined by length of loss of consciousness, or post-traumatic amnesia, or altered mental status if the subject did not experience loss of consciousness or post-traumatic amnesia.
MRI acquisition and processing
Participants were scanned on a Siemens 3 T TIM Trio located at the Jamaica Plain Division of VA Boston Healthcare System. Two 3D magnetization-prepared rapid gradient-echo (MP-RAGE) scans were acquired in the sagittal plane and averaged to create a single high contrast-to-noise image (voxel size = 1 mm3, T1 = 1000 ms, repetition time = 2530 ms, echo time = 3.32 ms). Automated cortical reconstruction and volumetric segmentation were performed with the FreeSurfer image analysis suite (version 5.0), which is available for download online (http://surfer.nmr.mgh.harvard.edu/). See Supplementary material for details regarding imaging analysis with FreeSurfer.
Cortical thickness values were extracted from seven regions including the entorhinal cortex, temporopolar cortex, lateral temporal cortex, inferior parietal cortex, inferior parietal sulcus, posterior cingulate cortex, and inferior frontal cortex (Fig. 1). These regions of interest were selected because collectively, they have shown the greatest bilateral cortical thinning in early Alzheimer’s disease in comparison to healthy older adults (Sabuncu et al., 2011). Region of interest masks were downloaded from the Open Access Series of Imaging Studies (OASIS) dataset, which is publically available with FreeSurfer. Regions of interest were registered to each individual subject’s cortical representation via surface-based registration and cortical thickness values were extracted for each subject. Values were averaged across left and right hemispheres and then averaged to create a single cortical thickness score across the seven regions (Sabuncu et al., 2011). An additional seven FreeSurfer regions of interest were selected to serve as control regions for the putative Alzheimer’s disease-vulnerable regions of interest. Selection of these regions was semi-random with the constraint that, similar to the Alzheimer’s disease-vulnerable regions, regions within the frontal, temporal, and parietal lobes would be represented. These included the middle temporal gyrus, lateral occipital gyrus, paracentral gyrus, postcentral gyrus, lingual gyrus, frontal pole, and the insula.
Figure 1.

Seven Alzheimer’s disease vulnerable regions of interest. IPC = inferior parietal cortex; IPS = inferior parietal sulcus; LTC = lateral temporal cortex; IFC = inferior frontal cortex; TP = temporopolar cortex; PCC = posterior cingulate cortex; EC = entorhinal cortex. Figure reproduced with permission from Sabuncu et al. (2011).
Clinical and cognitive assessment
TBI history was assessed using the Boston Assessment of TBI-Lifetime (BAT-L; Fortier et al., 2014), which was administered by a doctoral-level psychologist with extensive training in neuropsychology. The BAT-L is a semi-structured interview based on the Department of Defense diagnostic criteria of TBI and captures self-reported history of TBI experienced pre-, during, and post-military deployment. Mild TBI was defined as loss of consciousness lasting <30 min, and/or an altered mental status lasting <24 h, and/or a period of post-traumatic amnesia lasting <24 h. Additional details regarding TBI assessment are included in the Supplementary material.
Lifetime PTSD was assessed with the Clinician-Administered PTSD Scale (CAPS; Blake et al., 1995), a structured diagnostic interview that is the gold standard for assessment of the disorder. The CAPS assessment was performed by doctoral level psychologists with advanced training in psychological assessment. On this interview, each DSM-IV PTSD criterion is assessed with two CAPS sub-items, one that reflects the frequency of the symptom on a 0–4 scale and one that reflects the intensity of the symptom on a 0–4 scale. As with TBI, PTSD diagnosis was decided via consensus meeting of doctoral-level psychologists. Sleep disturbance was measured by the Pittsburgh Sleep Quality Index (PSQI; Buysse et al., 1989) and defined as a global score >5 on the PSQI. Premorbid IQ was estimated using the WTAR. This measure contains 50 irregularly spelled words of increasing difficulty to pronounce. The ability to perform this test remains unchanged following disease and injury. Episodic memory performance was assessed using the long-delay free recall score of the California Verbal Learning Test-Second Edition (CVLT-II; Delis et al., 2000). Long delay list learning tasks have been found to be the most sensitive to early Alzheimer’s disease (Welsh et al., 1992; Weintraub et al., 2012). One subject was missing this measure, and therefore analyses with the CVLT-II had a total n = 159.
DNA genotyping and polygenic risk score computation
APOE genotyping was conducted by the Pharmacogenomics Analysis Laboratory at the Central Arkansas Veterans Healthcare System, Little Rock, Arkansas. A detailed description of the genotyping protocol and generation of genome-wide genotypes is presented in the Supplementary material.
A polygenic risk score is a weighted average of genome-wide genotype data. The weights are the beta values estimated from the GWAS (or log odds ratios) if the GWAS was of a dichotomous trait. The polygenic risk score is the sum of these weights times the additively coded genotypes in the target population (0, 1, 2 coding). Polygenic scores are usually computed based on all SNPs from the GWAS under a specified P-value threshold such as P < 0.05 or P < 0.5. As there is as of yet no a priori way to identify which cut-off yields the most predictive scores, scores are usually computed over multiple P-value thresholds, often with a multiple-testing correction to judge their significance, and then the most predictive is used in further calculations or validated in an additional sample. In addition, the SNP sets are often ‘trimmed’ for linkage disequilibrium (i.e. non-independence between variants) to avoid the inclusion of redundant information in score calculation. In the present study, the polygenic risk scores for Alzheimer’s disease were computed based on summary results from the International Genomics of Alzheimer’s Disease Project (IGAP) GWAS (Lambert et al., 2013) as downloaded from http://web.pasteur-lille.fr/en/recherche/u744/igap/igap_download.php. Poorly imputed SNPs (Impute2 quality < 0.50) and rare SNPs (minor allele frequency < 0.01) were excluded from risk score calculation. Prior to imputation, the SNP panel was trimmed for linkage disequilibrium using PLINK’s ‘clumping’ procedure (r2 threshold of 0.2 in a 500 kb window based on linkage disequilibrium patterns in the 1000 Genomes EUR sample). Polygenic scores were computed assuming six different P-value thresholds: P < 0.05, P < 0.10, P < 0.20, P < 0.30, P < 0.40, and P < 0.50. As a control, schizophrenia and depression polygenic risk scores were also computed from the Psychiatric GWAS Consortium results using the same methodology (Ripke et al., 2013a, b) (https://www.med.unc.edu/pgc/downloads).
Statistical approach
Regression models examining mild TBI, PTSD, genetic risk for Alzheimer’s disease and cortical thickness
Data were analysed using a series of linear regression models. Main effects of mild TBI and Alzheimer’s disease polygenic risk score models were fit by which the average cortical thickness across the seven Alzheimer’s disease-vulnerable regions was regressed onto the polygenic risk score at each of the six polygenic risk score P-value thresholds. Covariates for all models and follow-up tests included age, sex, WTAR, PSQI, and lifetime PTSD. Similar models were used to assess the mild TBI by polygenic risk score interaction, again run for each of the six P-value thresholds. Corrected significance for main effects and interactions was determined using Monte-Carlo null simulation with 10 000 replicates in which the genetic data were randomly permuted between subjects. This analysis imposed strict multiple-testing control while taking into account the correlations between the six polygenic risk score P-value threshold variables.
We selected the polygenic score threshold value that showed the strongest interaction effect with mild TBI on cortical thickness. All subsequent analyses used this threshold value. To parse the relative effects of the polygenic score, mild TBI and covariates, a series of post hoc models were fit using a three-step hierarchical regression analysis. In the first model, nuisance covariates (age, sex, WTAR, PSQI, lifetime PTSD diagnosis) were entered. In the second model, the main effects of polygenic risk and mild TBI diagnosis were entered. Finally, the polygenic risk by mild TBI interaction term was entered into the third model. The results reported below refer to the output of Model 3 as we were most interested in the mild TBI by polygenic risk interaction. As there were only 11 female veterans in the entire dataset (seven with mild TBI), linear models were repeated including males only. Although education may also be entered as a covariate due to its association with onset of dementia in some studies, we selected premorbid IQ (i.e. WTAR) as a covariate due to evidence that when both premorbid IQ and education are entered into the model, premorbid IQ has a greater association with dementia than education (Pavlik et al., 2006; Doody et al., 2010). We further note that in this sample, education is not a significant predictor of cortical thickness, nor does its inclusion as a covariate change the results.
As there is evidence for higher risk of neurodegeneration following repetitive mild TBI (see Blennow et al., 2012), we also examined whether number of mild TBIs sustained over the lifespan moderated the association between polygenic risk for Alzheimer’s disease and cortical thickness (this model was limited to participants with TBI). To examine whether PTSD influenced the relationship between genetic risk and cortical thickness, the regression model included main effects for lifetime PTSD, polygenic risk for Alzheimer’s disease, and their interaction.
Cortical thickness as a function of time since injury
To examine the hypothesis that genetic risk is associated with accelerated cross-sectional cortical thinning, we calculated the amount of time (in years) that had elapsed since the last reported TBI (age at study − age at most recent mild TBI). We added the interaction of this time variable and polygenic risk to our linear regression model (this model was also limited to participants with TBI).
Examining the effect of APOE and other Alzheimer’s disease-related single nucleotide polymorphisms
Linear models were run to examine the main effect of APOE (E4 carriers, n = 37; non-E4 carriers, n = 123) and the mild TBI by APOE interaction on cortical thickness. Additional models assessed the top five SNPs that reached genome-wide significance for genetic risk for Alzheimer’s disease from Lambert et al. (2013) including rs6656401 in CR1, rs6733839 in BIN1, rs9331896 in CLU, rs10792832 in PICALM, and rs4147929 in ABCA7.
Effects in individual Alzheimer’s disease-vulnerable brain regions and specificity of hypotheses
To examine to extent to which the interaction between mild TBI and genetic risk was associated with any particular region of interest or hemisphere among the seven Alzheimer’s disease-vulnerable regions, we ran a three-step hierarchical regression model (covariates in step 1; main effects of mild TBI and polygenic risk in step 2; interaction term in step 3) for each of 14 brain regions (each of the seven Alzheimer’s disease-vulnerable regions, left and right separately). To correct for multiple comparisons across the 14 hierarchical regression analyses, significance for main effects and interactions was determined using Monte-Carlo null simulation with 10 000 replicates.
To determine specificity of the Alzheimer’s disease-vulnerable cortical thickness findings, we examined mild TBI and genetic associations with seven control regions of interest (see ‘MRI acquisition and processing’ section for details). Further, to determine the specificity of the polygenic risk for Alzheimer’s disease scores, we examined the interaction between mild TBI and a depression polygenic risk score, and mild TBI and a schizophrenia polygenic risk scores to predict cortical thickness in Alzheimer’s disease-vulnerable regions.
Moderated mediation analysis
To examine the relationships among mild TBI, polygenic risk, and memory performance, a regression-based path analysis was performed estimating and probing interactions and conditional indirect effects in a moderated mediation model using the PROCESS tool (Hayes, 2013) as implemented in SPSS v. 21. In this model, we examined evidence that the strength of the relationship between genetic risk and memory performance through cortical thickness is conditional on the value of a moderator (lifetime mild TBI). A detailed description of the moderated mediation model is available in the Supplementary material.
Results
Mild TBI but not PTSD moderates the relationship between genetic risk for Alzheimer’s disease and cortical thickness
Regression models indicated a significant main effect of polygenic risk for Alzheimer’s disease, with the strongest association occurring for the polygenic score computed using the P = 0.2 threshold (see Supplementary Table 1 for results at each polygenic risk P-value threshold). As predicted, there was a significant mild TBI by Alzheimer’s disease polygenic risk (maximum effect with the P = 0.2 threshold) interaction whereby individuals with both mild TBI and high polygenic risk for Alzheimer’s disease had reduced cortical thickness in Alzheimer’s disease-vulnerable regions (P = 0.019, corrected P = 0.048; Table 3 and Fig. 2) and this explained significant incremental variance in cortical thickness. These results remained significant after removing the 11 female participants from the dataset. There was no evidence that the number of mild TBIs (i.e. repetitive mild TBI) moderated the association between polygenic risk for Alzheimer’s disease and cortical thickness (P > 0.75).
Table 3.
Summary of regression analysis for association with cortical thickness in Alzheimer’s disease-vulnerable regions
| Model 1 | Model 2 | Model 3 | ||||||||||
|---|---|---|---|---|---|---|---|---|---|---|---|---|
| Variable | B | SE(B) | β | P | B | SE(B) | β | P | B | SE(B) | β | P |
| Age | −0.005 | 0.001 | −0.350 | <0.001** | −0.005 | 0.001 | −0.350 | <0.001** | −0.005 | 0.001 | −0.347 | <0.001** |
| Sex | 0.018 | 0.038 | 0.035 | 0.641 | 0.018 | 0.038 | 0.037 | 0.624 | 0.028 | 0.037 | 0.056 | 0.454 |
| WTAR | 0.001 | 0.000 | 0.098 | 0.200 | 0.001 | 0.000 | 0.100 | 0.186 | 0.001 | 0.000 | 0.126 | 0.094 |
| PSQI | −0.027 | 0.022 | −0.095 | 0.232 | −0.018 | 0.022 | −0.066 | 0.404 | −0.018 | 0.022 | −0.064 | 0.413 |
| Lifetime PTSD | −0.130 | 0.22 | −0.047 | 0.557 | −0.009 | 0.023 | −0.033 | 0.694 | −0.011 | 0.022 | −0.039 | 0.629 |
| Lifetime mild TBI | −0.035 | 0.021 | −0.131 | 0.096 | 0.279 | 0.135 | 1.05 | 0.04* | ||||
| PRS-AD | −0.002 | 0.001 | −0.146 | 0.052 | 0.002 | 0.002 | 0.116 | 0.384 | ||||
| mTBI × PRS-AD | −0.006 | 0.003 | −1.21 | 0.019a,* | ||||||||
| R2 | 0.146 | 0.182 | 0.212 | |||||||||
| F for ΔR2 | 5.246* | 3.425* | 5.579* | |||||||||
mTBI = mild traumatic brain injury; PRS-AD = polygenic risk score for Alzheimer’s disease.
aCorrected value of this interaction term = 0.048 at the PRS-AD threshold P < 0.2. *P < 0.05, **P < 0.01. SE=standard error.
Figure 2.
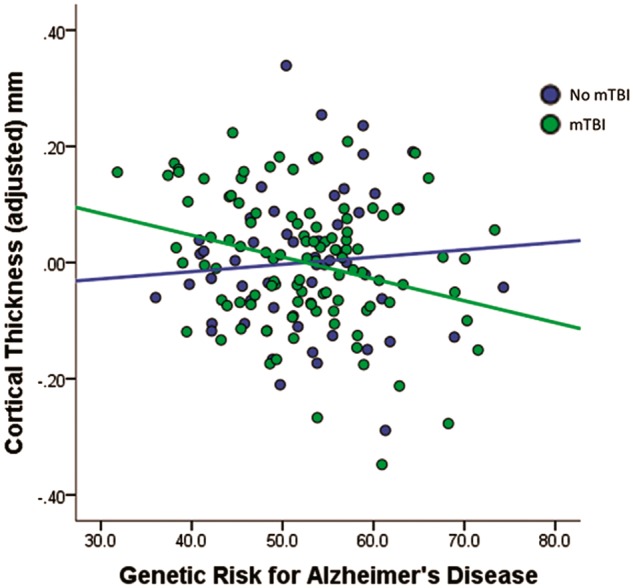
Reduced cortical thickness among subjects with mild TBI and high polygenic risk for Alzheimer’s disease. Values on the x-axis represent polygenic risk scores for Alzheimer’s disease, with higher scores indicating increased risk for Alzheimer’s disease. Values on the y-axis represent unstandardized residuals (i.e. the difference between predicted and observed cortical thickness values accounting for age, sex, PSQI, WTAR, and PTSD). mTBI = mild traumatic brain injury.
To further explore the pattern of results, we examined the relationship of mild TBI and low/high polygenic risk score groups (based on median split), with the caveat that this approach may be inherently less powerful than modelling using the continuous scale. Correcting for all covariates, between group comparisons revealed that subjects at high genetic risk for Alzheimer’s disease and mild TBI had the lowest average cortical thickness values. Supplementary Fig. 1 shows a bar plot of the mean cortical thickness values of each group. The difference was significant in comparison to the high Alzheimer’s disease genetic risk with no TBI group (P = 0.004) and the low Alzheimer’s disease genetic risk with mild TBI group (P = 0.015). The pairwise test was not significant in comparison to the low Alzheimer’s disease genetic risk no-TBI group (P = 0.138). The low genetic risk/no mild TBI group, low genetic risk/mild TBI group, and the high genetic risk/no mild TBI group were not significantly different from each other (all pairwise P’s > 0.2). The high Alzheimer’s disease genetic risk and mild TBI group had lower cortical thickness values in comparison to the other three combined (P = 0.004).
To examine whether PTSD moderated the relationship between genetic risk and cortical thinning, we entered the PTSD by Alzheimer’s disease polygenic risk score interaction to the regression model. The main effect of PTSD, and the interaction with Alzheimer’s disease polygenic risk were not significant (P’s > 0.3, see Supplementary Table 2). Further, the interaction between mild TBI and PTSD, without including Alzheimer’s disease polygenic risk in the equation, was not significant (P > 0.5). These results did not change after removing females from the analysis. Taken together, these results suggest that PTSD was not associated with cortical thickness in Alzheimer’s disease-sensitive regions, either alone or in conjunction with mild TBI or polygenic risk for Alzheimer’s disease.
Greater cortical thinning with time since mild TBI and high genetic risk
To examine evidence for a neurodegenerative process among those at high genetic risk for Alzheimer’s disease, we computed the amount of time (years) that had elapsed since the last reported TBI and added the interaction of this time variable and polygenic risk to the model (limited to participants with TBI). The interaction effect between time of last mild TBI and polygenic risk for Alzheimer’s disease was marginally significant when including both males and the seven females with mild TBI (n = 105, P = 0.07), but was significant when including males only (n = 98, P = 0.042, Fig. 3). This effect was age-independent (as age was accounted for in the model), and was not replicated when entering age at injury in place of time since injury (P > 0.7). Calculation of predicted values from the male-only regression model revealed that cortical thinning in individuals with high genetic risk (e.g. risk score = 95th percentile) was greater by 0.14 mm 10 years post-injury, 0.22 mm 20 years post-injury, and 0.31 mm 30 years post-injury than individuals with low genetic risk (e.g. 10th percentile). With the caveat that these results are cross-sectional, they may suggest that cortical thinning increases over time, signalling a neurodegenerative process among those with high genetic risk for Alzheimer’s disease.
Figure 3.
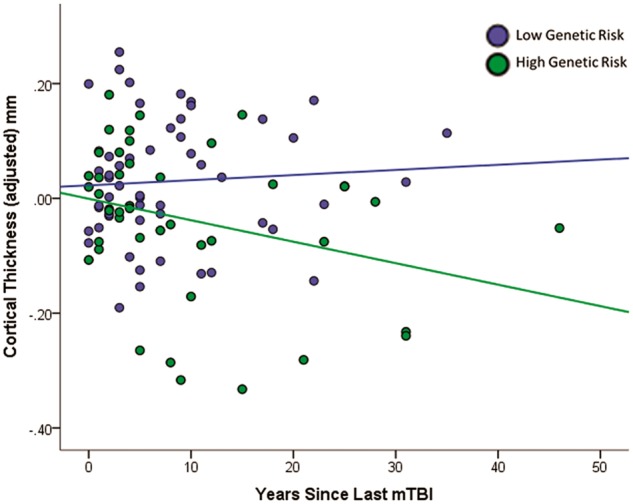
Greater reduction in cortical thickness is observed earlier post-injury among males with mild TBI and high polygenic risk for Alzheimer’s disease. Time since injury (x-axis) = age at study − age at most recent mild TBI. Values on the y-axis represent unstandardized residuals (i.e. the difference between predicted and observed cortical thickness values accounting for age, PSQI, WTAR, and PTSD). Polygenic risk scores were dichotomized (median split) for illustration purposes only. Regression lines represent the best fit line for the low and high polygenic risk for Alzheimer’s disease groups. mTBI = mild traumatic brain injury.
Mild TBI does not moderate APOE or other Alzheimer’s disease candidate single nucleotide polymorphisms
There was no main effect of APOE on cortical thickness, nor was there a mild TBI by APOE interaction. Further, when including polygenic risk for Alzheimer’s disease scores in the model, the polygenic score was still associated with cortical thickness after adjusting for APOE status. These analyses did not change when females were removed. Linear models showed that only one SNP, rs4147929 in ABCA7 showed a significant mild TBI × SNP effect on cortical thickness (P = 0.043). However, this effect did not survive multiple comparisons correction (Supplementary Table 3).
Association between mild TBI, polygenic risk for Alzheimer’s disease, and individual Alzheimer’s disease-vulnerable brain regions
We next explored whether mild TBI moderated the relationship between polygenic risk and any particular region of interest and hemisphere among the Alzheimer’s disease-vulnerable regions examined. The strongest association for the interaction between mild TBI and polygenic risk was observed in the right posterior cingulate cortex (corrected for multiple comparisons, P = 0.019; see Table 4). The interaction was also associated with the left temporopolar cortex (P = 0.021), but this effect did not survive multiple comparisons correction (Supplementary Table 4). These results did not change when females were removed.
Table 4.
Summary of regression analysis for association with cortical thickness in the right posterior cingulate cortex
| Model 1 | Model 2 | Model 3 | ||||||||||
|---|---|---|---|---|---|---|---|---|---|---|---|---|
| Variable | B | SE(B) | β | P | B | SE(B) | β | P | B | SE(B) | β | P |
| Age | −0.009 | 0.002 | −0.301 | <0.001** | −0.009 | 0.002 | −0.300 | <0.001** | −0.008 | 0.002 | −0.292 | <0.001** |
| Sex | −0.050 | 0.074 | −0.052 | 0.503 | −0.048 | 0.075 | −0.051 | 0.519 | −0.022 | 0.073 | −0.024 | 0.759 |
| WTAR | 0.000 | 0.001 | −0.013 | 0.864 | 0.000 | 0.001 | −0.011 | 0.888 | 0.000 | 0.001 | 0.027 | 0.730 |
| PSQI | −0.003 | 0.043 | −0.006 | 0.939 | 0.003 | 0.044 | 0.006 | 0.943 | 0.005 | 0.042 | 0.009 | 0.910 |
| Lifetime PTSD | −0.039 | 0.043 | −0.074 | 0.375 | −0.037 | 0.045 | −0.071 | 0.414 | −0.042 | 0.044 | −0.081 | 0.338 |
| Lifetime mild TBI | −0.024 | 0.042 | −0.048 | 0.559 | 0.834 | 0.263 | 1.651 | 0.002** | ||||
| PRS-AD | −0.002 | 0.002 | −0.072 | 0.358 | 0.009 | 0.004 | 0.306 | 0.027* | ||||
| Mild TBI × PRS-AD | −0.016 | 0.005 | −1.751 | 0.001a,** | ||||||||
| R2 | 0.095 | 0.102 | 0.163 | |||||||||
| F for ΔR2 | 3.227* | 0.613 | 10.94** | |||||||||
PRS-AD = polygenic risk score for Alzheimer’s disease.
aCorrected value of this interaction term = 0.019 at the PRS-AD threshold P < 0.2. *P < 0.05, **P < 0.01.
Specificity of Alzheimer’s disease-vulnerable cortical regions and polygenic risk scores
We next examined mild TBI and genetic associations with seven control regions of interest. The mild TBI by polygenic risk score interaction did not significantly predict average cortical thickness in these control regions, suggesting specificity to the previously determined Alzheimer’s disease-vulnerable brain regions (Supplementary Table 5). Further, to determine specificity of the polygenic risk score for Alzheimer’s disease, we examined whether mild TBI moderated the relationship between polygenic risk for depression and schizophrenia and cortical thickness. There were no significant interactions between mild TBI and any P-value threshold for either the depression or schizophrenia polygenic risk scores in predicting cortical thickness.
Mild TBI and genetic risk for Alzheimer’s disease influence delayed memory indirectly through cortical thickness
Finally, we examined whether the mild TBI by polygenic risk for Alzheimer’s disease effect on cortical thickness had implications for memory performance. Delayed memory tests are considered to be the most sensitive in detecting Alzheimer’s disease in the early stages, thus we examined the long-delay free recall scores from the CVLT-II. First, we tested the hypothesis that polygenic effects confer risk for episodic memory loss though disturbances in cortical thickness, with mild TBI moderating the polygenic effect. The interactive effects of Alzheimer’s disease polygenic risk by mild TBI interaction on cortical thickness and of cortical thickness to delayed memory were both significant adjusting for age, sex, PSQI, PTSD, and premorbid IQ. Further, a bias-corrected bootstrap confidence interval for the indirect effect of the highest order interaction (i.e. testing the hypothesis that the mild TBI × polygenic risk interaction influences memory performance indirectly through cortical thickness) did not encompass zero [ab = −0.026, 95% confidence interval (CI) −0.08 to −0.002], suggesting a significant model. As expected, the combination of mild TBI and higher Alzheimer’s disease polygenic risk scores was associated with reduced CVLT-II long-delay free recall scores through loss of cortical thickness in Alzheimer’s disease-vulnerable brain regions (Fig. 4).
Figure 4.

Moderated mediation model. Mild TBI moderated the relationship between polygenic risk for Alzheimer’s disease and cortical thickness, and indirectly influenced delayed episodic memory performance. Covariates (age, sex, lifetime PTSD, PSQI, WTAR estimated IQ) were included in the model but are not shown here for display simplicity. PRS = polygenic risk for Alzheimer’s disease score; mTBI = mild traumatic brain injury.
Discussion
This study examined the associations of mild TBI, polygenic risk for Alzheimer’s disease, and their interaction with cortical thickness in brain regions susceptible in Alzheimer’s disease. There were three main findings. First, the combination of mild TBI exposure and high polygenic risk for Alzheimer’s disease was associated with reduced cortical thickness in Alzheimer’s disease-vulnerable brain regions. Second, cortical thinning in Alzheimer’s disease-vulnerable regions was accelerated post-injury (indexed by years elapsed since the last reported mild TBI) among males with high genetic risk for Alzheimer’s disease. Finally, mild TBI and polygenic risk-related cortical thinning was associated with reduced delayed episodic memory recall.
Findings of this study shed new light on potential mechanisms of reduced cortical thickness following mild TBI by implicating genetic pathways associated with Alzheimer’s disease including those involved in clathrin-mediated endocytosis signalling, inflammation, immune response, and cholesterol (Jones et al., 2010; Logue et al., 2014). Clathrin-mediated endocytosis has been associated with amyloid precursor protein (APP) processing and amyloid-β production (Wu and Yao, 2009). APP also plays a role in mild TBI and is considered a reliable neural marker of injury (Blumbergs et al., 1995), suggesting that the clathrin-mediated pathway warrants additional study. Further, genetic pathway analyses in animal models of TBI have shown greater-than-chance involvement of genes associated with inflammation and the immune response (Crack et al., 2009) and new data in humans suggest changes in gene expression related to markers of inflammation and immune response following concussion (Merchant-Borna et al., 2016). The higher prevalence of stroke, diabetes, hyperlipidaemia, hypertension, and coronary artery disease previously reported in patients with TBI versus controls (Wang et al., 2012) points to the potential involvement of gene pathways involved in cholesterol and atherosclerosis. Future research should examine these and other mechanisms by which TBI may lead to the onset of reduced cortical thickness.
There is growing evidence from animal and human work suggesting accelerated loss of structural brain integrity following TBI (Trotter et al., 2015). A recent study showed premature brain atrophy in grey and white matter in individuals with TBI (Cole et al., 2015). In this study, premature brain atrophy increased with passage of time since injury, similar to the results reported here, which are suggestive of cortical thinning as a function of the time since injury. In addition, both the data reported in Cole et al. (2015) and our data revealed that smaller brain structure estimates were associated with worse cognitive performance. Of note, Cole and colleagues (2015) found accelerated brain atrophy only in moderate and severe TBI cases, but not mild TBI, consistent with the notion that severity of injury is an important factor in predicting neurodegeneration. It is possible that for individuals with mild TBI, the biomechanical force of the injury is insufficient to elicit neurodegenerative processes unless also accompanied by additional risk, such as a predisposing genetic risk for Alzheimer’s disease as reported here.
The primary brain region associated with the interaction of mild TBI and genetic risk for Alzheimer’s disease was the posterior cingulate cortex. Previous studies have found early structural degeneration (Lehmann et al., 2010), amyloid deposition (Buckner et al., 2005), and altered functional energy metabolism in this region in Alzheimer’s disease (Minoshima et al., 1994). In addition, reduced perfusion in the posterior cingulate has been observed in individuals with mild cognitive impairment who go on to develop Alzheimer’s disease (Johnson et al., 1998). This region was also identified by Sabuncu and colleagues (2012) as the area most strongly associated with their Alzheimer’s disease polygenic score. Importantly, a recent study showed that white matter volume of the posterior cingulate/isthmus reduced over time following mild TBI (Zhou et al., 2013). Taken together, these results suggest that the posterior cingulate may be vulnerable to both degeneration secondary to mild TBI and genetic risk for Alzheimer’s disease, making it particularly susceptible to accelerated reductions in cortical thickness with the combination of TBI and neurodegenerative disease risk. We observed hemispheric asymmetry, with the greatest cortical thinning in the right posterior cingulate cortex. Although this finding was not hypothesized, there is evidence for the right posterior cingulate cortex as a strong marker for distinguishing stable versus progressive brain atrophy (Querbes et al., 2009). Additional work is required to understand the role of hemispheric asymmetry in the present results.
Results of this study also showed that cortical thickness in Alzheimer’s disease-vulnerable brain regions was associated with reduced performance on the CVLT-II long-delay free recall task, a sensitive measure of Alzheimer’s disease-associated cognitive impairment. The CVLT-II long-delay task requires the participant to recall items from a learned list of 16 words after a 20-min delay. Tests that measure forgetting over a delay of minutes have been shown to differentiate patients with Alzheimer’s disease in the early stages of the disease from healthy elderly controls with 85–90% accuracy (Knopman and Ryberg, 1989; Welsh et al., 1991). In the present study, there was no direct effect of mild TBI on performance of this task. However, when genetic risk for Alzheimer’s disease and cortical thinning in Alzheimer’s disease-vulnerable regions were taken into account, there was a clear relationship between these variables and episodic memory performance, suggesting that only those individuals with mild TBI who also have early neurodegenerative markers show early changes in cognition. The results also suggest that cortical thickness may be an important and sensitive indicator of early neurodegeneration and align with those of Sabuncu and colleagues (2012), who also found a relationship between genetic risk for Alzheimer’s disease and cortical thickness. By contrast, studies that have used cognitive performance as a measure of early neurodegenerative risk without considering brain metrics have not found positive associations between TBI, genetic risk and neuropsychological task performance (e.g. Millar et al., 2003; Rapoport et al., 2008).
Although APOE represents one of the strongest risk factors for Alzheimer’s disease, APOE or other single loci did not interact with mild TBI to predict cortical thickness. This result further underscores the power of a genome-wide polygenic approach to studying complex phenotypes and is consistent with other data showing that single candidate genes such as APOE explain significantly less of the phenotypic variance in Alzheimer’s disease than polygenic scores (Ridge et al., 2013). PTSD was also not associated with cortical thickness in Alzheimer’s disease-related regions either directly or in combination with mild TBI or polygenic risk for Alzheimer’s disease, raising the possibility that mild TBI has a distinct neural signature from PTSD. Indeed, recent studies have shown that the neurobehavioral outcomes seen in mild TBI, despite overlapping with PTSD, may be mediated by separate neural processes (Miller et al., 2016). One implication of these findings is that documentation and assessment of mild TBI separately from PTSD is important, despite the sometimes near impossibility of attributing behavioural outcomes to one diagnosis over another. This is because although the behavioural manifestation of these two diagnoses may be indistinguishable closer to the time of the injury, the long term outcomes may ultimately be different when they are combined with additional risk factors such as polygenic risk for neurodegenerative disease.
Repetitive mild TBI did not moderate the relationship between polygenic risk for Alzheimer’s disease and cortical thickness. One possibility for the negative finding is that repetitive mild TBI may moderate genetic risk for neural disruptions in regions more consistent with chronic traumatic encephalopathy pathology, including the depths of the sulci preferentially in temporal and frontal lobes (McKee et al., 2013) rather than regions related to Alzheimer’s disease pathology as examined here. Another possibility is that the repetitive mild TBIs occurred far enough apart in the present sample to allow for recovery. Animal studies typically have multiple exposures within a predetermined period, and thus there may be a critical time window in following the first TBI within the second insult must occur to observe increased severity of brain injury over a single mild TBI. Additional studies are necessary to examine whether either of these possibilities are supported.
This study has several limitations that should be taken into account. First, although we observed reduced cortical thickness in regions that were shown previously to be associated with Alzheimer’s disease, we cannot determine whether any of the individuals in this study will develop Alzheimer’s disease or another neurodegenerative disease in the future, or whether lower thickness was present prior to injury. For example, we cannot rule out the possibility that individuals with thinner cortices in Alzheimer’s disease-related regions were more likely to sustain mild TBI. Thus, we are currently following the subjects in this study longitudinally to determine the association between cortical thinning and neurodegenerative disease. Longitudinal data will also help definitively determine whether cortical thinning is accelerated over time for a given subject, which could not be determined here given the cross-sectional nature of this study. Second, although we used a polygenic risk score for Alzheimer’s disease, it is yet unknown whether the risk score is also associated with chronic traumatic encephalopathy or other dementias. Currently, the research on chronic traumatic encephalopathy is in its infancy and there are no GWASs of chronic traumatic encephalopathy. Given that the neuropathology of chronic traumatic encephalopathy has shared features with Alzheimer’s disease including tau and amyloid deposits, at this stage it is impossible to determine whether these subjects would likely develop Alzheimer’s disease versus another neurodegenerative disease. However, the finding that cortical thickness in Alzheimer’s disease-vulnerable regions was associated with a cognitive domain most tied to Alzheimer’s disease over other dementias (i.e. delayed recall), and mediated the relationship between mild TBI and polygenic risk and episodic memory provides support for the polygenic risk as a measure of Alzheimer’s disease risk. Self-reported mild TBI is another limitation of the current study. We did not have access to corroborating military medical records, which for many military personnel, were often lost or destroyed because of environmental conditions in the field (Benson et al., 2013). However, given that this is a limitation for most other studies of this nature, semi-structured interviews are the acknowledged standard for diagnosing remote mild TBI. Further, disentangling symptoms of psychological trauma or the sequelae of physical injury due to mild TBI in this sample is a challenge and adds to the uncertainty of mild TBI diagnosis. Another limitation is the selectivity of the sample. While representative of veterans of the recent wars, the low number of females in the study precluded us from having enough power to detect potential gender differences. In addition, these findings may not generalize to ethnic groups other than Caucasian, non-Hispanic individuals or non-military samples. Additional work is necessary to determine how cortical thinning rates in military samples compare to civilian TBI and neurological samples. Finally, we note that the findings from this study should be considered provisional until replication from additional samples is obtained.
In conclusion, we report here that the combination of mild TBI exposure and high genetic risk for Alzheimer’s disease is associated with reduced cortical thickness in brain regions sensitive to neurodegeneration and is accompanied by reduced delayed memory recall performance. These results underscore the importance of studying the long term consequences of mild TBI in the large numbers of Iraq and Afghanistan service members returning with exposure to mild TBI because of the potential public health ramifications for long-term care.
Supplementary Material
Acknowledgements
We thank the Translational Research Center for TBI and Stress Disorders team for their assistance with data collection and management, in particular, Drs Fortier, Amick, Kenna, Corbo, and Robinson, and Wally Musto.
Funding
This research was supported by VA SPiRe award I21RX001594, NIMH grant R21MH102834, and the Translational Research Center for TBI and Stress Disorders (TRACTS), a VA Rehabilitation Research and Development National Network Research Center (B9254-C). The views expressed in this article are those of the authors and do not necessarily reflect the position or policy of the Department of Veterans Affairs or the United States government.
Supplementary material
Supplementary material is available at Brain online.
Glossary
Abbreviations
- CVLT-II
California Verbal Learning Test-Second Edition
- GWAS
genome-wide association study
- PSQI
Pittsburgh Sleep Quality Index
- PTSD
post-traumatic stress disorder
- SNP
single nucleotide polymorphism
- TBI
traumatic brain injury
- WTAR
Wechsler Test of Adult Reading.
References
- Barnes DE, Kaup A, Kirby KA, Byers AL, Diaz-Arrastia R, Yaffe K. Traumatic brain injury and risk of dementia in older veterans. Neurology 2014; 83: 312–19. [DOI] [PMC free article] [PubMed] [Google Scholar]
- Benson JH, Irizarry-Cruz WA, Dietz JE, Aviles JA, Reid CD, Stephens MS. et al. Medical communications for combat casualty care. Johns Hopkins APL Tech Digest 2013; 31: 301–9. [Google Scholar]
- Bigler ED. Traumatic brain injury, neuroimaging, and neurodegeneration. Front Hum Neurosci 2013; 7: 395. [DOI] [PMC free article] [PubMed] [Google Scholar]
- Blake DD, Weathers FW, Nagy LM, Kaloupek DG, Gusman FD, Charney DS. et al. The development of a Clinician-Administered PTSD scale. J Trauma Stress 1995; 8: 75–90. [DOI] [PubMed] [Google Scholar]
- Blennow K, Hardy J, Zetterberg H. The neuropathology and neurobiology of traumatic brain injury. Neuron 2012; 76: 886–99. [DOI] [PubMed] [Google Scholar]
- Blumbergs PC, Scott G, Manavis J, Wainwright H, Simpson DA, McLean J. Topography of axonal injury as defined by amyloid precursor protein and the sector scoring method in mild and severe closed head injury. J Neurotrauma 1995; 12: 565–72. [DOI] [PubMed] [Google Scholar]
- Buckner RL, Snyder AZ, Shannon BJ, LaRossa G, Sachs R, Fotenos AF. et al. Molecular, structural, and functional characterization of Alzheimer’s disease: evidence for a relationship between default activity, amyloid, and memory. J Neurosci 2005; 25: 7709–17. [DOI] [PMC free article] [PubMed] [Google Scholar]
- Buysse DJ, Reynolds CF, Monk TH, Berman SR, Kupfer DJ. The Pittsburgh Sleep Quality Index: a new instrument for psychiatric practice and research. Psychiatry Res 1989; 28: 193–213. [DOI] [PubMed] [Google Scholar]
- Cassidy JD, Carroll L, Peloso P, Borg J, Von Holst H, Holm L. et al. Incidence, risk factors and prevention of mild traumatic brain injury: results of the WHO Collaborating Centre Task Force on Mild Traumatic Brain Injury. J Rehabil Med 2004; 36: 28–60. [DOI] [PubMed] [Google Scholar]
- Chamelian L, Reis M, Feinstein A. Six-month recovery from mild to moderate traumatic brain injury: the role of APOE-ɛ4 allele. Brain 2004; 127: 2621–8. [DOI] [PubMed] [Google Scholar]
- Cole JH, Leech R, Sharp DJ. Prediction of brain age suggests accelerated atrophy after traumatic brain injury. Ann Neurol 2015; 77: 571–81. [DOI] [PMC free article] [PubMed] [Google Scholar]
- Crack PJ, Gould J, Bye N, Ross S, Ali U, Habgood MD. et al. The genomic profile of the cerebral cortex after closed head injury in mice: effects of minocycline. J Neural Transm 2009; 116: 1–12. [DOI] [PubMed] [Google Scholar]
- Delis D, Kramer J, Kaplan E, Ober B. CVLT-II California verbal learning test manual adult version. San Antonio, TX: The Psychological Corporation; 2000. [Google Scholar]
- Doody RS, Pavlik V, Massman P, Rountree S, Darby E, Chan W. Predicting progression of Alzheimer’s disease. Alzheimers Res Ther 2010; 2: 2. [DOI] [PMC free article] [PubMed] [Google Scholar]
- Fleminger S, Oliver D, Lovestone S, Rabe-Hesketh S, Giora A. Head injury as a risk factor for Alzheimer’s disease: the evidence 10 years on; a partial replication. J Neurol Neurosurg Psychiatry 2003; 74: 857–62. [DOI] [PMC free article] [PubMed] [Google Scholar]
- Fortier CB, Amick MM, Grande L, McGlynn S, Kenna A, Morra L. et al. The Boston Assessment of Traumatic Brain Injury–Lifetime (BAT-L) semistructured interview: evidence of research utility and validity. J Head Trauma Rehabil 2014; 29: 89–98. [DOI] [PMC free article] [PubMed] [Google Scholar]
- Friedman G, Froom P, Sazbon L, Grinblatt I, Shochina M, Tsenter J. et al. Apolipoprotein E-ɛ4 genotype predicts a poor outcome in survivors of traumatic brain injury. Neurology 1999; 52: 244–8. [DOI] [PubMed] [Google Scholar]
- Gardner RC, Burke JF, Nettiksimmons J, Kaup A, Barnes DE, Yaffe K. Dementia risk after traumatic brain injury vs nonbrain trauma: the role of age and severity. JAMA Neurol 2014; 71: 1490–7. [DOI] [PMC free article] [PubMed] [Google Scholar]
- Gatz M, Reynolds CA, Fratiglioni L, Johansson B, Mortimer JA, Berg S. et al. Role of genes and environments for explaining alzheimer disease. Arch Gen Psychiatry 2006; 63: 168–74. [DOI] [PubMed] [Google Scholar]
- Guo Z, Cupples L, Kurz A, Auerbach S, Volicer L, Chui H. et al. Head injury and the risk of AD in the MIRAGE study. Neurology 2000; 54: 1316–23. [DOI] [PubMed] [Google Scholar]
- Hayes AF. Mediation, moderation, and conditional process analysis: a regression-based approach. New York, NY: Guilford Press; 2013. [Google Scholar]
- Hayes JP, Miller DR, Lafleche G, Salat DH, Verfaellie M. The nature of white matter abnormalities in blast-related mild traumatic brain injury. Neuroimage Clin 2015; 8: 148–56. [DOI] [PMC free article] [PubMed] [Google Scholar]
- Jellinger KA, Paulus W, Wrocklage C, Litvan I. Traumatic brain injury as a risk factor for Alzheimer disease. Comparison of two retrospective autopsy cohorts with evaluation of ApoE genotype. BMC Neurol 2001; 1: 3. [DOI] [PMC free article] [PubMed] [Google Scholar]
- Johnson KA, Jones K, Holman B, Becker J, Spiers P, Satlin A. et al. Preclinical prediction of Alzheimer’s disease using SPECT. Neurology 1998; 50: 1563–71. [DOI] [PubMed] [Google Scholar]
- Johnson VE, Stewart W, Smith DH. Widespread tau and amyloid‐beta pathology many years after a single traumatic brain injury in humans. Brain Pathol 2012; 22: 142–9. [DOI] [PMC free article] [PubMed] [Google Scholar]
- Jones L, Holmans PA, Hamshere ML, Harold D, Moskvina V, Ivanov D. et al. Genetic evidence implicates the immune system and cholesterol metabolism in the aetiology of Alzheimer’s disease. PLoS One 2010; 5: e13950. [DOI] [PMC free article] [PubMed] [Google Scholar]
- Jordan BD, Relkin NR, Ravdin LD, Jacobs AR, Bennett A, Gandy S. Apolipoprotein E∈ 4 associated with chronic traumatic brain injury in boxing. JAMA 1997; 278: 136–40. [PubMed] [Google Scholar]
- Knopman DS, Ryberg S. A verbal memory test with high predictive accuracy for dementia of the alzheimer type. Arch Neurol 1989; 46: 141–5. [DOI] [PubMed] [Google Scholar]
- Kraus MF, Susmaras T, Caughlin BP, Walker CJ, Sweeney JA, Little DM. White matter integrity and cognition in chronic traumatic brain injury: a diffusion tensor imaging study. Brain 2007; 130: 2508–19. [DOI] [PubMed] [Google Scholar]
- Lambert JC, Ibrahim-Verbaas CA, Harold D, Naj AC, Sims R, Bellenguez C. et al. Meta-analysis of 74,046 individuals identifies 11 new susceptibility loci for Alzheimer’s disease. Nat Genet 2013; 45: 1452–8. [DOI] [PMC free article] [PubMed] [Google Scholar]
- Lehmann M, Rohrer JD, Clarkson MJ, Ridgway GR, Scahill RI, Modat M. et al. Reduced cortical thickness in the posterior cingulate gyrus is characteristic of both typical and atypical Alzheimer’s disease. J Alzheimers Dis 2010; 20: 587–98. [DOI] [PubMed] [Google Scholar]
- Logue MW, Schu M, Vardarajan BN, Farrell J, Lunetta KL, Jun G. et al. A search for age-related macular degeneration risk variants in Alzheimer disease genes and pathways. Neurobiol Aging 2014; 35: 1510 e7–18. [DOI] [PMC free article] [PubMed] [Google Scholar]
- McKee AC, Stein TD, Nowinski CJ, Stern RA, Daneshvar DH, Alvarez VE. et al. The spectrum of disease in chronic traumatic encephalopathy. Brain 2013; 136: 43–64. [DOI] [PMC free article] [PubMed] [Google Scholar]
- Merchant-Borna K, Lee H, Wang D, Bogner V, van Griensven M, Gill J. et al. Genome-wide changes in peripheral gene expression following sports-related concussion. J Neurotrauma 2016; 33: 1576–85. [DOI] [PMC free article] [PubMed] [Google Scholar]
- Millar K, Nicoll J, Thornhill S, Murray G, Teasdale G. Long term neuropsychological outcome after head injury: relation to APOE genotype. J Neurol Neurosurg Psychiatry 2003; 74: 1047–52. [DOI] [PMC free article] [PubMed] [Google Scholar]
- Miller DR, Hayes JP, Lafleche G, Salat DH, Verfaellie M. White matter abnormalities are associated with chronic postconcussion symptoms in blast‐related mild traumatic brain injury. Hum Brain Mapp 2016; 37: 220–9. [DOI] [PMC free article] [PubMed] [Google Scholar]
- Minoshima S, Foster N, Kuhl D. Posterior cingulate cortex in Alzheimer’s disease. Lancet 1994; 344: 895. [DOI] [PubMed] [Google Scholar]
- Mortimer J, Van Duijn C, Chandra V, Fratiglioni L, Graves A, Heyman A. et al. Head trauma as a risk factor for Alzheimer’s disease: a collaborative re-analysis of case-control studies. Int J Epidemiol 1991; 20: S28–35. [DOI] [PubMed] [Google Scholar]
- Omalu B, Hammers JL, Bailes J, Hamilton RL, Kamboh MI, Webster G. et al. Chronic traumatic encephalopathy in an Iraqi war veteran with posttraumatic stress disorder who committed suicide. Neurosurg Focus 2011; 31: E3. [DOI] [PubMed] [Google Scholar]
- Pavlik V, Doody R, Massman P, Chan W. Influence of premorbid IQ and education on progression of Alzheimer’s disease. Dement Geriatr Cogn Disord 2006; 22: 367–77. [DOI] [PubMed] [Google Scholar]
- Plassman BL, Havlik R, Steffens D, Helms M, Newman T, Drosdick D. et al. Documented head injury in early adulthood and risk of Alzheimer’s disease and other dementias. Neurology 2000; 55: 1158–66. [DOI] [PubMed] [Google Scholar]
- Purcell SM, Wray NR, Stone JL, Visscher PM, O’Donovan MC, Sullivan PF. et al. Common polygenic variation contributes to risk of schizophrenia and bipolar disorder. Nature 2009; 460: 748–52. [DOI] [PMC free article] [PubMed] [Google Scholar]
- Querbes O, Aubry F, Pariente J, Lotterie J-A, Démonet J-F, Duret V. et al. Early diagnosis of Alzheimer’s disease using cortical thickness: impact of cognitive reserve. Brain 2009; 132: 2036–47. [DOI] [PMC free article] [PubMed] [Google Scholar]
- Rapoport M, Wolf U, Herrmann N, Kiss A, Shammi P, Reis M. et al. Traumatic brain injury, apolipoprotein E-ε4, and cognition in older adults: a two-year longitudinal study. J Neuropsychiatry Clin Neurosci 2008; 20: 68–73. [DOI] [PubMed] [Google Scholar]
- Ridge PG, Mukherjee S, Crane PK, Kauwe JS. Alzheimer’s disease: analyzing the missing heritability. PLoS One 2013; 8: e79771. [DOI] [PMC free article] [PubMed] [Google Scholar]
- Ripke S, O’Dushlaine C, Chambert K, Moran JL, Kähler AK, Akterin S. et al. Genome-wide association analysis identifies 13 new risk loci for schizophrenia. Nat Genet 2013a; 45: 1150–9. [DOI] [PMC free article] [PubMed] [Google Scholar]
- Ripke S, Wray NR, Lewis CM, Hamilton SP, Weissman MM, Breen G. et al. A mega-analysis of genome-wide association studies for major depressive disorder. Mol Psychiatry 2013b; 18: 497–511. [DOI] [PMC free article] [PubMed] [Google Scholar]
- Sabuncu MR, Buckner RL, Smoller JW, Lee PH, Fischl B, Sperling RA. et al. The association between a polygenic Alzheimer score and cortical thickness in clinically normal subjects. Cereb Cortex 2012; 22: 2653–61. [DOI] [PMC free article] [PubMed] [Google Scholar]
- Sabuncu MR, Desikan RS, Sepulcre J, Yeo BTT, Liu H, Schmansky NJ. et al. The dynamics of cortical and hippocampal atrophy in Alzheimer disease. Arch Neurol 2011; 68: 1040–8. [DOI] [PMC free article] [PubMed] [Google Scholar]
- Terrio H, Brenner LA, Ivins BJ, Cho JM, Helmick K, Schwab K. et al. Traumatic brain injury screening: preliminary findings in a US Army Brigade Combat Team. J Head Trauma Rehabil 2009; 24: 14–23. [DOI] [PubMed] [Google Scholar]
- Trotter BB, Robinson ME, Milberg WP, McGlinchey RE, Salat DH. Military blast exposure, ageing and white matter integrity. Brain 2015; 138: 2278–92. [DOI] [PMC free article] [PubMed] [Google Scholar]
- Uryu K, Chen X-H, Martinez D, Browne KD, Johnson VE, Graham DI. et al. Multiple proteins implicated in neurodegenerative diseases accumulate in axons after brain trauma in humans. Exp Neurol 2007; 208: 185–92. [DOI] [PMC free article] [PubMed] [Google Scholar]
- Uryu K, Laurer H, McIntosh T, Praticò D, Martinez D, Leight S. et al. Repetitive mild brain trauma accelerates Aβ deposition, lipid peroxidation, and cognitive impairment in a transgenic mouse model of Alzheimer amyloidosis. J Neurosci 2002; 22: 446–54. [DOI] [PMC free article] [PubMed] [Google Scholar]
- Wang H-K, Lin S-H, Sung P-S, Wu M-H, Hung K-W, Wang L-C. et al. Population based study on patients with traumatic brain injury suggests increased risk of dementia. J Neurol Neurosurg Psychiatry 2012; 83: 1080–5. [DOI] [PubMed] [Google Scholar]
- Wechsler D. Wechsler Test of Adult Reading: WTAR. San Antonio, TX: Psychological Corporation; 2001. [Google Scholar]
- Weintraub S, Wicklund AH, Salmon DP. The neuropsychological profile of Alzheimer disease. Cold Spring Harb Perspect Med 2012; 2: a006171. [DOI] [PMC free article] [PubMed] [Google Scholar]
- Welsh K, Butters N, Hughes J, Mohs R, Heyman A. Detection of abnormal memory decline in mild cases of Alzheimer’s disease using CERAD neuropsychological measures. Arch Neurol 1991; 48: 278–81. [DOI] [PubMed] [Google Scholar]
- Welsh KA, Butters N, Hughes JP, Mohs RC, Heyman A. Detection and staging of dementia in Alzheimer’s disease: use of the neuropsychological measures developed for the consortium to establish a registry for Alzheimer’s disease. Arch Neurol 1992; 49: 448–52. [DOI] [PubMed] [Google Scholar]
- Wu F, Yao PJ. Clathrin-mediated endocytosis and Alzheimer’s disease: an update. Ageing Res Rev 2009; 8: 147–9. [DOI] [PubMed] [Google Scholar]
- Zhou Y, Kierans A, Kenul D, Ge Y, Rath J, Reaume J. et al. Mild traumatic brain injury: longitudinal regional brain volume changes. Radiology 2013; 267: 880–90. [DOI] [PMC free article] [PubMed] [Google Scholar]
Associated Data
This section collects any data citations, data availability statements, or supplementary materials included in this article.