

Abstract
Background
Retinol isotope dilution (RID) indirectly estimates vitamin A (VA) status. Multicompartment modeling of RID data is used to refine study designs and equations to calculate VA stores. Previous studies suggest that VA in slowly turning over pools is not traced if follow-up is not long enough; however, shorter RID studies are being investigated. Few long-term models have been published.
Objective
We determined the effect of time on mathematical models of VA kinetics, model parameters, and outcomes.
Methods
In this longitudinal study, women (mean ± SD age: 22 ± 3 y; n = 7) were given 2.0 µmol [14,15]-13C2-retinyl acetate. Blood samples were staggered from 4 h to 152 d; the fraction of dose in serum was modeled with compartmental models. Four model-time categories were created: full models that used all data (median: 137 d; range 97–152 d) and truncated shorter studies of 14, 27, and 52 d (range: 42–62 d). Outcomes included number of compartments to adequately model serum data, kinetic parameters, total traced VA mass, and time-to-dose equilibration. To gain insight into longer follow-up, an additional participant was given 17.5 µmol 13C4-VA, and data were modeled as long as enrichment was above baseline (5 y).
Results
Longer follow-up times affected kinetic parameters and outcomes. Compared with the 14-d models, long-term full models required an additional compartment for adequate fit (14.3% compared with 100%; P = 0.0056) and had longer [median (quartile 1, quartile 3)] whole-body half-life [15.0 d (10.5, 72.6 d) compared with 135 d (115, 199 d); P = 0.0006], time-to-dose equilibration [3.40 d (3.14, 6.75 d) compared with 18.9 d (11.2, 25.7 d); P < 0.0001], and total traced mass [166 µmol VA (162, 252 µmol VA) compared with 476 µmol VA (290, 752 µmol VA); P = 0.0031].
Conclusions
Extended RID sampling alters numerous mathematically modeled, time-dependent outcomes in women. Length of study should be considered when using mathematical models for calculating total-body VA stores or kinetic parameters related to VA turnover. This study is registered at www.clinicaltrials.gov as NCT03248700.
Keywords: mathematical modeling, retinol kinetics, stable isotopes, vitamin A status, 13C-retinol
Introduction
Vitamin A (VA) is an essential nutrient, with negative health consequences from both hypo- and hypervitaminosis A (1). VA deficiency (serum retinol <0.7 µmol/L) still affects a substantial proportion of children globally (2). Many notable interventions are being conducted to increase VA intakes, including high-dose supplementation and food fortification. However, combined VA interventions may result in high VA stores in target populations when estimated by stable isotopic techniques (3, 4). Accurate and straightforward VA status assessment is critical to establish the need for and effectiveness of interventions aimed at optimizing VA status.
Retinol isotope dilution (RID) is considered an accurate, minimally invasive technique to assess VA status from deficiency through excess (5). The principle of RID assumes that a tracer dose has completely mixed with endogenous VA stores by the time of sampling. Human studies have shown a correlation between RID and liver biopsy, with blood sampled at 10–47 (6) or 18–25 (7) d postdosing. There is much interest in developing methods to have short follow-up times after dosing for population studies by either extrapolating data (8) or devising modified equations to account for a shortened sampling time (9). Multicompartmental mathematical modeling of isotope tracer studies has determined VA kinetic parameters (10, 11) as well as attempted to refine RID equations for status assessment (9, 12).
Isotope dilution experiments with compartmental analysis in humans have used various lengths of follow-up after dosing: 7 (13), 14 (12, 14), 52 (15, 16), 56 (17, 18), 57 (19), and 240 (20) d. To determine the most appropriate model fit, Burri et al. (19) and Cifelli et al. (18) investigated increasing model complexity by adding an additional storage compartment, but neither found a statistically improved model fit to justify the addition. Green and Green (20) modeled tracer enrichment in 3 participants for 115, 211, and 240 d by using a model with 2 storage compartments (1 slower and 1 faster turning over). The authors noted that tracer studies should be carried out for ≥200 d to observe the full dynamics of VA turnover in participants with normal VA status, which was indicated by the final terminal slope in the tracer response curve (20). Sauberlich et al. (21) gave intravenous or oral 14C-retinyl acetate to 8 men undergoing VA depletion (533 ± 149 d). Four participants had estimated baseline VA body pools ranging from 1100 to 3070 μmol, corresponding to adequate- or high-VA status. The half-life of the VA body pool was calculated to be 154 ± 55 d, and the tracer equilibrated by 26 d.
Comparisons of estimated VA stores from mathematical modeling to measured liver VA in rats (10) and monkeys (22) have underestimated VA stores when adequate or elevated. This discrepancy is hypothesized to be due to untraced VA in slowly exchanging pools with short RID experiments. The accuracy of RID methods across the VA status continuum is essential to identify areas that need interventions while avoiding excessive intakes. To our knowledge, compartmental modeling of VA tracer data has not been directly compared with liver VA concentrations in humans. In this study, compartmental analysis was applied to RID data with a long follow-up and compared with truncated data to simulate shortened experiments to determine the effect of follow-up length on VA kinetic parameters and model outcomes in women. Results will inform future methodologic considerations of RID and modeling analyses.
Methods
Ethical approval
The Health Sciences Institutional Review Board of the University of Wisconsin (UW) School of Medicine and Public Health approved this study. Participants gave written informed consent after receiving written and verbal explanations of the study and having their questions or concerns addressed. All of the study events took place at UW-Madison. The use of isotope enrichment data for compartmental modeling is registered at clinicaltrials.gov (NCT03248700).
Participants
An e-mail advertisement was sent to female students at UW-Madison. Inclusion criteria were age 19–30 y, normal BMI (kg/m2; 18.5–24.9), nonsmoking, not pregnant, and not lactating. Exclusion criteria included weight loss ≥4.5 kg during 3 mo before recruitment, actively trying to lose weight, inability to refrain from drinking alcohol when requested, amenorrhea, acute or chronic illness including hepatitis, current or previous history of anorexia or bulimia, or concurrent participation in other studies. Recruitment occurred during March 2008 (Supplemental Figure 1). Participants underwent a phone screen, in-person screening, and brief medical history questionnaire to determine eligibility. Eight female participants were recruited to allow 4 observations/time point at early staggered sampling points. Seven participants had suitable data to fit VA kinetic models. The omitted participant had low isotope enrichments that could not be adequately fit by the previously used model, likely due to dose malabsorption or abnormal VA kinetics, which could not be confirmed. An additional woman (aged 36.7 y at baseline) was given an oral 17.5-µmol dose of 13C4-retinyl acetate for long-term follow-up.
Baseline dietary habits and anthropometric measures
To quantify VA intake, participants completed a 2007 Harvard FFQ (23, 24). Daily VA estimates are in retinol activity equivalents (RAEs) where 1 RAE = 1 µg all-trans-retinol, 2 µg supplemental all-trans-β-carotene, 12 µg dietary all-trans-β-carotene, or 24 µg α-carotene and β-cryptoxanthin (1).
Body weight was measured by a calibrated BOD POD (Life Measurements, Inc.). Height was measured by using a wall-mounted stadiometer.
Study design and sample collection
At baseline (day 0), phlebotomists obtained blood samples after an overnight fast for ≥10 h. Immediately afterward, each participant was given an oral dose of 2 μmol 13C2-retinyl acetate in corn oil, synthesized as published (25). Participants consumed peanut butter on a cracker or banana after dosing to provide fat for adequate dose absorption and were offered breakfast containing no VA. Participants were asked to refrain from drinking alcohol for 3 d before and 4 d after dosing to avoid altering VA absorption and metabolism.
To minimize the total number of individual blood draws during the first 24 h, participants were divided into 2 groups. Group 1 had blood samples taken at 4, 7, and 11 h and group 2 had blood samples taken at 5, 9, and 13 h after dosing. Participants stayed on site for 11–13 h after dosing to ensure blood collection timing and to provide VA-free food throughout the day so as to not perturb the labeled dose. For the remainder, participants consumed their typical foods. All of the participants had blood samples taken at 24, 33, 48, and 57 h and at 3, 4, 7, 10, 14, 17, 21, 27, 34, 42, and 52 d after dosing. After the first day, all but 2 blood draws occurred in the mornings after a 10-h food and alcohol fast, and participants received breakfast immediately after sampling. At the 52-d collection, participants received a transportation allowance. Participants were asked to give blood at 62, 77, 97, 122, and 152 d after dosing and were compensated $20 per visit. The additional participant was sampled at 2, 4, 8, 16, 24, 32, 64, 128, 256, 426, 730, 1095, 1387, 1460, 1825, and 2190 d postdosing. Venous blood was allowed to clot at room temperature and centrifuged at 2200 g for 10 min at 4°C. Serum was placed into aliquots, flushed with argon, and stored at –70°C.
Concentration of serum retinol
Serum (1 mL) was extracted by the addition of 1.5 mL ethanol (with 0.1% butylated hydroxytoluene), 200 µL C-23 β-apo-carotenol (OD ∼1 at 358 nm in methanol, analyzed daily) as internal standard, and 4 hexane extractions (1.5, 1.5, 1, and 1 mL). Hexane extractions were pooled, dried under nitrogen, and resuspended in 200 µL 50:50 (vol:vol) methanol:dichloroethane; 2 µL was injected onto a Waters Acquity H-class ultra-performance liquid chromatograph equipped with a guard column, a Waters Acquity (Waters, Milford, MA) HSS C18 1.8 μm, 2.1 × 150 mm column, and a heater set to 30°C. Mobile phases at 0.3 mL/min were as follows: (A) 70:25:5 (vol:vol:vol) acetonitrile:water:isopropanol with 10 mM ammonium acetate; (B) 65:15:20 (vol:vol:vol) methanol:acetonitrile:isopropanol with 10 mM ammonium acetate; and (C) isopropanol. The gradient had the following initial conditions: 85A:15C, linear change in 12 min to 65A:35B, linear change in 10 min to 15A:50B:35C, maintenance for 12 min, reverse to initial conditions in 2 min, and equilibration for 6 min. Retinol was quantified at 315 nm with a photodiode array detector to minimize influence from carotenoids and standardized against purified retinol.
Carbon isotope composition of serum retinol
Retinol was purified from 1–2 mL serum as described (6), with minor modifications. GraceSmart 5 µm RP18 columns (150 × 4.6 mm and 250 × 4.6 mm) were used for primary and secondary purifications. Purified retinol was injected onto a GC-combustion-isotope ratio MS system as published (6, 7); the GC-combustion-isotope ratio MS determines the atom percent 13C calibrated against an International Atomic Energy Agency sucrose standard (RM-8542; National Institute of Standards and Technology).
Calculation of fraction of dose
Mean serum retinol concentration over the study (n = 4–5/participant) was multiplied by estimated serum volume to determine the total serum retinol pool (micromoles). Blood volume was estimated by using the deviation from desirable weight method to account for body composition and to minimize systematic bias (26) with regression estimates using the Daxor Ideal Blood Calculator (Daxor Corporation), and serum volume was estimated as 0.64× blood volume for women to account for trapped plasma (27), but not the body-to-venous hematocrit ratio because venous samples were used (28). From raw atom percent 13C data, the tracer-to-tracee ratio (TTR) was calculated (8, 29). Tracer fraction [tracer/(tracer + tracee)] was calculated as [TTR/(TTR + 1)] and multiplied by the serum retinol pool (µmol tracer + tracee) to yield the amount of tracer in serum (µmol tracer), which was divided by the oral micromole dose of 13C-retinol given to obtain the fraction of dose in serum at each time point.
Model-based compartmental analysis
Fractions of dose in serum data were modeled by using Simulation, Analysis, and Modeling software for Windows (WinSAAM) with the use of published models of VA kinetics (18) with fixed parameters for absorption to reduce the number of adjustable parameters, yet to yield similar values as fully adjustable models for postabsorptive kinetics (30). The absorption of the small, physiologic 2.0-µmol dose was increased from 75% (18, 30) to 90% in healthy individuals (22, 31) in the models by adjusting the fixed parameter for dose absorption. Two models were developed for each participant per time category: one of identical structure to previously used models that included 1 extravascular compartment (18, 30) and another that had 2 extravascular storage compartments, 1 faster turning over and the other slowly turning over (10) (Figure 1). Models consist of compartments, fractional transfer coefficients [L(I,J), representing the fraction of compartment J transferred to compartment I per d], and a delay element (compartment 3) that is needed to account for the time delay associated with VA absorption to adequately fit early time points.
FIGURE 1.
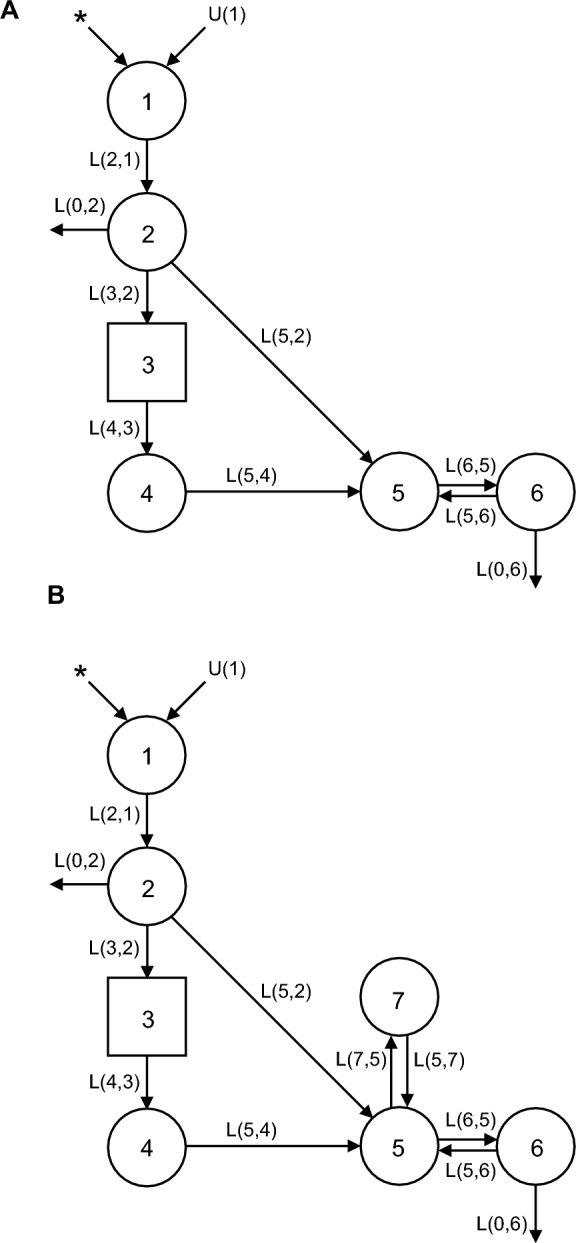
One- (A) and 2- (B) extravascular-pool compartment models of VA kinetics in US women given 13C-retinyl acetate. Circles represent compartments, arrows represent fractional transfer coefficients [denoted L(I,J), the fraction of compartment J transferred to compartment I per day], and the square represents a delay element. Compartments 1–4 (with delay element 3) represent the absorption, chylomicron delivery, and liver processing of VA. Compartment 5 refers to the serum, compartments 6 and 7 represent extravascular VA pools, and compartment 0 (not pictured) represents irreversible loss of VA from the system. L(I,J)s refer to the fractional transfer of pool J to pool I per day, U(1) refers to intake of dietary VA, and the asterisks (*) represent the site of tracer input. VA, vitamin A.
In both models, parameters related to dose absorption were fixed as identified for another group of US women (30). For “1 extravascular compartment” models (Figure 1A), adjustable parameters were delay element 3, L(5,4), L(6,5), L(5,6), and L(0,6). For “2 extravascular compartment” models (Figure 1B), L(7,5) and L(5,7) were additionally adjustable. Final model parameters were calculated in WinSAAM using the ITERation command for weighted nonlinear regression with a fractional SD of 0.05 (30). Serum VA pool mass was used in a steady state solution to calculate compartment masses. Other outcome measures included system fractional catabolic rate (fraction of retinol pool utilized or irreversibly lost per day), disposal rate, system half-life, the value of S (the ratio of specific activities or TTRs of retinol in serum to that in stores) over time, and the value of S at final equilibration.
Models were made for each participant as data allowed, including the full study length data set (n = 6; median: 137 d; quartile 1, quartile 3: 122, 152 d; range: 97–152 d), and truncated data to create 3 additional time categories to correspond to similar study lengths found in the literature: 14 d (n = 7), 27 d (n = 7), and 52 d (quartile 1, quartile 3: 52, 52; range: 42–62 d; n = 6). The additional participant had model time categories of 16, 32, 64, 128, 256, 426, 730, and 1825 d. Enrichment at 2190 d (6 y) had returned to baseline; therefore, only data through 1825 d were included. Residual weighted sums of squares were compared with the use of an F statistic to determine if the 2 extravascular pool models significantly improved model fit to justify the additional compartment (32). The statistically preferred model for each participant at each time category was used for additional kinetic and model outcomes.
Equations for calculation of total body stores or liver reserves
Equations used for calculating body pools of VA from isotope dilution data (8) were compared with results obtained from compartmental models. The Olson equation (6) was refined by Green et al. (9, 12) based on reflection of factors included in the following equation:
 |
(1) |
where TBS is total body stores of VA; F is a factor for efficiency of absorption and storage of the test dose in the liver [0.5 based on (33)]; “dose” is the oral dose in moles; S was originally defined as the ratio of specific activities of retinol in serum to that in liver (6) [0.65 based on (34)]; TTR is the stable isotope analog to specific activity, which is commonly used for radioisotopes (35), so S can be defined as the ratio of TTR in serum to TTR of stores; and H:D is the ratio of hydrogen:deuterium retinol (equal to 1/TTR) in plasma after an equilibration period, which is typically 14–21 d. A modified equation using a shortened equilibration period was recently proposed (12), as follows:
 |
(2) |
where TBS is total body stores of VA, Fa is the fraction of the administered dose absorbed and in stores, S is as in Equation 1, and (1/SAp) is equivalent to (dose × H:D) or (dose × 1/TTR). Although SAp is termed “specific activity,” specific activity traditionally refers to radioactive tracers and corresponds to TTR when used for stable isotopes (29, 35), which may create confusion. The equation is proposed to have a mixing period of 4–5 d, with modeling in that study suggesting that Fa × S equals 0.48 and 0.43 at 4 and 5 d postdosing, respectively (12). A value of 0.48 was used for Fa × S because all participants in the current study had a 4-d blood draw. Individualized factors of Fa and S have been used to compare compartmental modeling to Equation 2 (12) and were compared similarly for full and truncated models. Mass (isotope) balance equations have also been applied to total liver reserve (TLR) or TBS calculations, typically when isotope ratio MS is used (8), and results in the form:
 |
(3) |
where factors include a constant for dose absorption (0.9 in this study) and a constant for dose catabolism [e−kt where k = ln(2)/half-life in days (140 d), and t = time in d]. For TLR, an additional constant for fraction of VA stored in the liver is used (typically 0.5–0.8, dependent on projected VA status from TBS). In this study, liver concentrations were estimated with the use of Equation 3 assuming 0.8 of total body VA is stored in the liver and that adult liver is 2.4% of body weight (6, 36).
To compare TBS obtained from compartmental modeling with RID equations and truncated models, the relative traced mass was calculated by dividing the estimates calculated from each RID equation or truncated compartment model by the total traced mass from the full compartmental model.
Super-woman model
Individual models were compared against pooled models, sometimes referred to as “super” models’ (32, 37), characterized by pooling all data together into a single model by using the mean fraction of dose at each time point (n = 3–7/time point). The mean fraction of dose was then modeled similarly as above and included truncated models.
Statistical analysis
Data are reported as means ± SDs, medians (quartile 1, quartile 3), or percentages. Outcomes comparing study length were analyzed with a mixed model including a random effect for participant with the use of SAS (version 9.4; SAS Institute). Regressions were done with general linear models. Proportions were compared by using Fisher's exact test. Post hoc letter groupings among groups were determined with the use of Tukey-adjusted differences. Normality of residuals was tested with the Shapiro-Wilk test; homogeneity of variance was tested with Levene's test. Data failing normality or variance assumptions were analyzed nonparametrically by using a rank transformation. P < 0.05 was considered significant.
Results
Participant characteristics
Baseline characteristics of the study participants are shown in Supplemental Table 1. Three (43%) women reported using VA supplements. Compared with DRIs (1), 3 (43%) daily VA intakes were below the Estimated Average Requirement (EAR; 500 µg RAEs), 2 (29%) were between the EAR and the RDA (700 µg RAEs), 1 (14%) was between the RDA and the Tolerable Upper Intake Level (3000 µg RAEs as preformed VA), and 1 (14%) was >3000 µg RAEs from mixed VA sources (38). Participants had adequate estimated liver VA concentrations, with no participants having <0.1 µmol/g (deficiency cutoff) or >1 µmol/g (hypervitaminotic cutoff). No participant had serum retinol <0.7 µmol/L.
Model parameters
Individual and super-woman model mean delay times and fractional transfer coefficients by time category are presented for all 1-extravascular-pool (Supplemental Table 2) and 2-extravascular-pool (Supplemental Table 3) models, regardless of statistical preference. As length of study increased, parameters tended to change for 1, but not 2, extravascular compartment models. Super-woman model parameters followed similar patterns and tended to be within 1 SD of means of individual models.
Model complexity and outcomes
Four representative models from a single participant for the 4 time categories show how model-predicted values change and the terminal slope becomes shallower as the study duration is increased (Figure 2). For this participant, 1 extravascular compartment adequately fit 14-d and 27-d models (Figure 2A, B), but 2 extravascular compartments were required to fit 52-d and 152-d models (Figure 2C, D). For all participants, the proportion of models requiring an additional compartment to more accurately fit the data increased with study length, with 100% of participants requiring 2 extravascular compartments when full data sets were used (Table 1).
FIGURE 2.
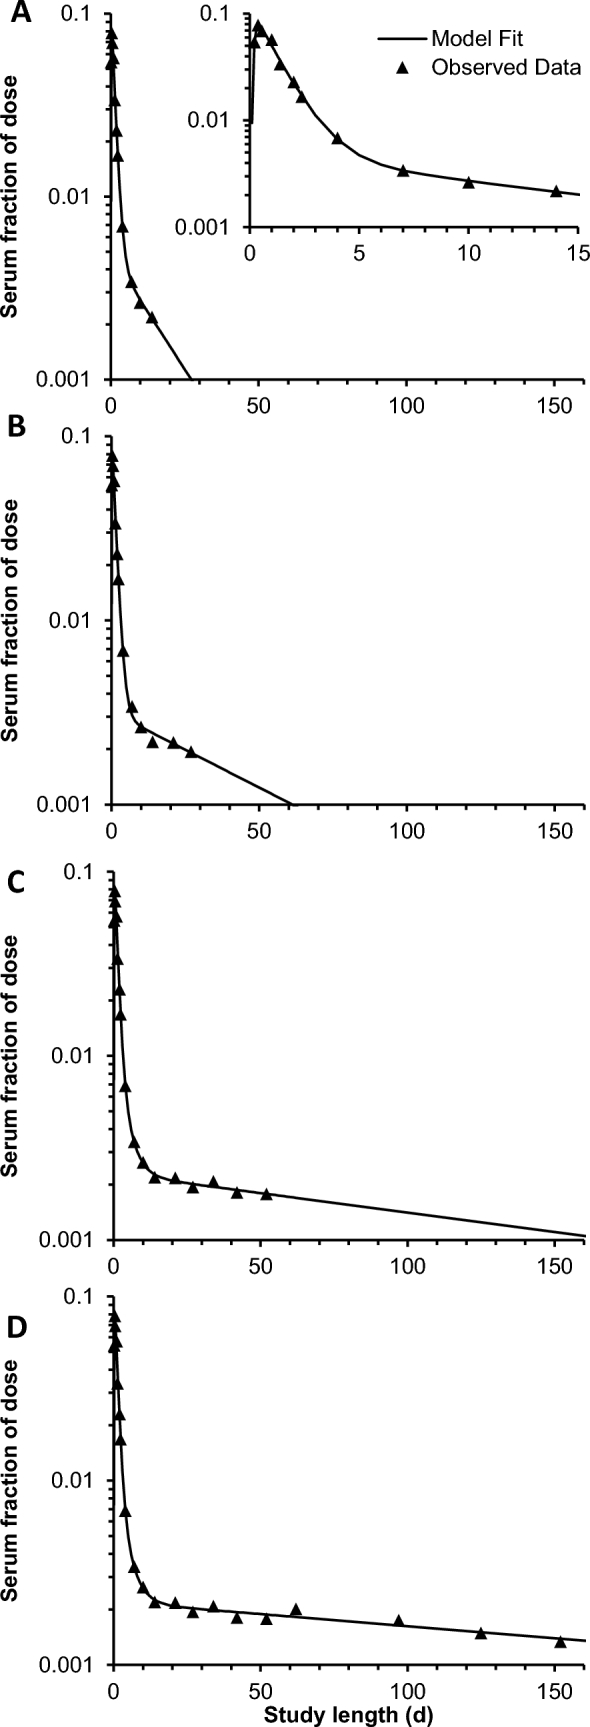
Representative fractions of the dose in serum compared with time and resulting models from a single woman given 13C-retinyl acetate representing different study lengths: (A) 14 d; inset is same model with altered axes; (B), 27 d; (C), 52 d; and (D), 152 d. Models that used data ≤14 d and 27 d (A and B) required only 1 extravascular compartment to adequately fit data, whereas models containing data ≤52 d and 152 d (C and D) required 2 extravascular compartments to adequately fit data.
TABLE 1.
Model outcomes of statistically preferred models of vitamin A kinetics in US women by length of study category1
| Study length category: median (range), d | |||||
|---|---|---|---|---|---|
| 14 (14–14) | 27 (27–27) | 52 (42–62) | 137 (97–152) | P | |
| n | 7 | 7 | 6 | 6 | |
| Models requiring 2 extravascular pools, % | 14 | 43 | 83 | 100 | 0.0056 |
| Super-woman model | 0 | 0 | 100 | 100 | — |
| Total traced mass, µmol | 166 (162, 252)b | 209 (180, 401)a,b | 494 (225, 825)a | 476 (290, 752)a | 0.0031 |
| Super-woman model | 236 | 265.7 | 304.2 | 474.3 | — |
| Half-life, d | 15.0 (10.5, 72.6)c | 37.4 (18.2, 58.0)b,c | 85.1 (47.5, 134)a,b | 135 (115, 199)a | 0.0006 |
| Super-woman model | 22.0 | 28.6 | 45.7 | 111.4 | — |
| Fractional catabolic rate, % | 4.62 (0.955, 6.61)a | 1.14 (0.099, 3.14)a,b | 1.52 (1.00, 1.64)a,b | 0.825 (0.607, 0.864)b | 0.0078 |
| Super-woman model | 3.15 | 2.42 | 1.52 | 0.62 | — |
| Disposal rate, µmol/d | 7.95 (2.26, 11.9)a | 3.98 (2.53, 9.90)a,b | 3.48 (2.30, 3.96)a,b | 2.10 (1.71, 3.88)b | 0.047 |
| Super-woman model | 7.44 | 6.44 | 5.16 | 2.95 | — |
| Time to S = 1, d | 3.40 (3.14, 6.75)c | 5.70 (3.95, 10.4)b,c | 8.38 (6.53, 17.3)a,b | 18.9 (11.2, 25.7)a | <0.0001 |
| Super-woman model | 4.24 | 4.61 | 5.89 | 20.62 | — |
| S at equilibration, TTRserum:TTRstores | 0.64 (0.51, 0.86) | 0.78 (0.56, 0.79) | 0.81 (0.8, 0.85) | 0.85 (0.81, 0.85) | 0.081 |
| Super-woman model | 0.666 | 0.707 | 0.776 | 0.817 | — |
Values are % or medians (quartile 1, quartile 3). Outcomes from the super-woman model are singlet. Models with 1 or 2 extravascular pools were used depending on statistical justification of minimizing residual weighted sum of squares relative to increased model complexity. P values testing the null hypothesis that outcomes were equal among time categories using a mixed model with random effect of participant or Fisher's exact text. Groups without a common superscript letter differ, a > b > c. S, the ratio of specific activities or TTRs of retinol in serum to that in stores; TTR, tracer-to-tracee ratio; P = 0.05.
The TTR/dose plotted against time for serum and storage compartments from the short 14-d model compared with the full model from the same representative participant indicates how the calculated kinetic behavior for storage compartments changes with increased study length (Figure 3). With a 14-d follow-up, only a single storage compartment is required, and TTR/dose in the storage pool increases, equaling that in serum at 3.4 d, and decreases rapidly afterward to parallel the decline in serum (Figure 3A). With the full model (152 d; Figure 3C), 2 storage compartments are required, and TTR/dose in compartment 6 (fast turning over) increases more rapidly to equal that in serum at 2.0 d, whereas TTR/dose in compartment 7 (slow turning over) increases more slowly to equal that in serum at 11.3 d and that in compartment 6 at 17.3 d. TTR/dose then declines in both storage compartments more slowly to parallel the more shallow decline in serum at further time points (Figure 3B, C).
FIGURE 3.
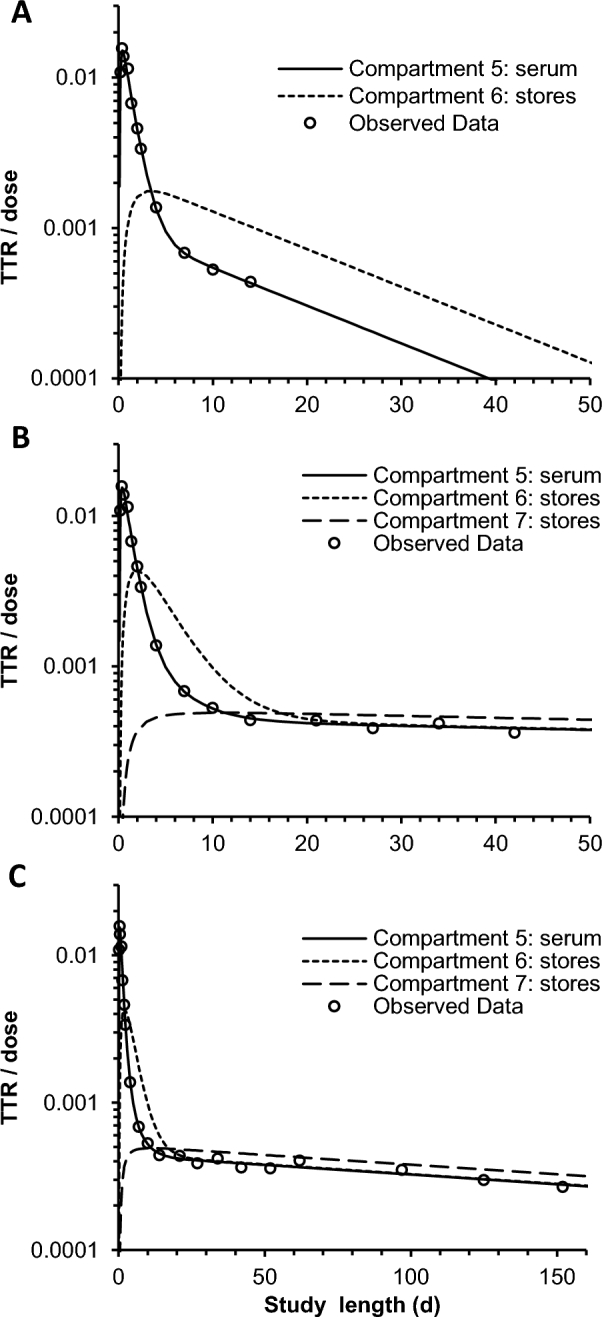
Representative TTRs/doses (equivalent to fraction of dose/compartment mass) for a single woman given 13C-retinyl acetate. (A) Model truncated to 14 d. (B) Full model plotted only to 50 d. (C) Full model with all data plotted. The model with data through 14 d required 1 extravascular pool, whereas the full model required 2. TTR, tracer-to-tracee ratio.
For all participants, as study length increased, total traced mass increased, half-life increased (while inversely related system fractional catabolic rate decreased), disposal rate decreased, and time for S to equal 1 increased (representative of time for the dose to mix with body stores) (Table 1). The value of S when the dose was fully equilibrated did not differ significantly with study duration (P = 0.08), although medians followed a time-related response. Super-woman models followed similar time-related response patterns as length of study duration increased.
Comparison with dietary intake
Total daily intake in micrograms of RAEs was significantly and positively associated with total traced mass for each participant's compartmental model including all data [R2 = 0.75, total traced mass (µmol) = 0.356 × intake (µg RAEs/d) + 177; P = 0.012] as well as estimated liver concentration [R2 = 0.80, TLR (µmol/g) = 0.000235 × intake (µg RAEs/d) + 0.124; P = 0.0064].
Comparison with isotope dilution equations
Comparison of total mass calculated by the compartmental models to RID equations indicated that relative to full-length compartment models, the modified Olson and short-term Olson equations had lower estimates, and the mass-balance equation had a higher estimate with mean relative ratios of 0.49, 0.26, and 1.2, respectively (Table 2). Shorter models also had lower relative calculated masses, in agreement with Table 1. Short-term RID (Equation 2) with customized individual factors (12) agreed well with total traced mass for both 27-d and full models (Figure 4), despite total traced mass being greater by a factor of 2.1 ± 1.1 in full models compared with 27-d models.
TABLE 2.
Comparison of estimated TBS of vitamin A in US women by mathematical models of different study lengths and isotope dilution equations1
| Relative total traced mass to full compartmental model | |||
|---|---|---|---|
| Mean ± SD | Minimum, maximum | n | |
| Mathematical models | |||
| 14 d | 0.46 ± 0.26 | 0.21, 0.86 | 7 |
| 27 d | 0.63 ± 0.34 | 0.23, 1.31 | 7 |
| 52 (42–62) d | 0.87 ± 0.19 | 0.61, 1.09 | 5 |
| Full model2 | Reference | — | 7 |
| Isotope dilution equations | |||
| Modified Olson (Equation 1)3 | 0.49 ± 0.08 | 0.37, 0.60 | 7 |
| Short-term Olson (Equation 2)4 | 0.26 ± 0.09 | 0.14, 0.46 | 7 |
| Mass balance (Equation 3)5 | 1.23 ± 0.20 | 0.93, 1.46 | 7 |
Values were calculated as total traced mass or TBS of indicated model or equation/total traced mass from the full-length compartmental model. F, factor for efficiency of absorption and storage of a tracer dose in the liver; Fa, the fraction of the administered dose absorbed and in stores; S, ratio of specific activities or TTRs of retinol in serum to that in stores; SAp, “specific activity” (dose × 1/TTR) TBS, total body stores; TTR, tracer-to-tracee ratio.
One participant had her longest time point in the 52-d (42–62 d) category, which was used as her full model; therefore, she had no relative value for 52 d (42–62 d). The duration of the full model for this analysis was a median (quartile 1, quartile 3) of 122 d (110, 152 d).
Equation used was TBS = F × dose × S × H:D = 0.5 × 0.65 × dose × 1/(21 d TTR).
Equation used was TBS = Fa × S × (1/SAp) = 0.48 × dose × 1/(4 d TTR).
Equation used was TBS = factor for absorption × factor for catabolism × dose × 1/(21 d TTR) = 0.9 × 0.9 × dose ×1/(21 d TTR).
FIGURE 4.

Comparison plots of model-calculated total traced mass and short-term isotope dilution TBS (Equation 2) in US women. Each data point represents 1 participant. Short 4-d TBS were determined by the following equation: TBS = Fa × S × dose × (1/TTR), with factors Fa and S customized for each participant with the corresponding model. (A) Total traced mass and customized Fa and S for each participant from the statistically preferred model with data ≤27 d. (B) Total traced mass and customized Fa and S for each participant from the statistically preferred model with all data. Fa, the fraction of the administered dose absorbed and in store; S, ratio of specific activities or TTRs of retinol in serum to that in stores; TBS, total body stores; TTR, tracer-to-tracee ratio.
Additional participant followed long term
The additional participant had an estimated liver VA concentration of 0.44 µmol/g liver, indicating adequate VA status. One outlier data point, 1460 d, was omitted from the 1825-d model, although it was plotted and noted (Figure 5A). Mean serum retinol concentration was 1.52 µmol/L. One extravascular pool was sufficient to fit 16-, 32-, and 64-d models, but all longer models statistically preferred 2 extravascular pools. Model outputs of total traced mass, half-life, time-to-dose equilibration, and the value of S at equilibration all increased as the study length increased, similarly to other participants with apparent threshold effects that varied by outcome (Figure 5B–E).
FIGURE 5.

Kinetic data and model outcomes for an additional woman given 17.5 µmol 13C4-retinyl acetate with 1825 d of follow-up. (A) Observed data and model-predicted fraction of oral dose in serum over time for the full model. Inset is same model with altered axes. (B) Total traced mass compared with truncated study length. Lines represent total body VA stores estimated from isotope dilution equations. (C) Vitamin A half-life compared with truncated study length. (D) Time-to-dose equilibration (time at which S = 1) compared with truncated study length. (E) Value of S at final equilibration (time to infinity) compared with truncated study length. All data for panels B–E represent the statistically preferred compartmental model (1 compared with 2 extravascular pools); 2 pools were required for models with >64 d of follow-up. S, ratio of specific activities or TTRs of retinol in serum to that in stores; TTR, tracer-to-tracee ratio; VA, vitamin A.
Discussion
Compartmental modeling applied to full and truncated RID data from US women showed that model complexity, parameters, and outcomes are all affected by the duration of sampling. Follow-up length must be considered when evaluating, comparing, or using models of VA kinetics because a short-term model may not yield the same outcomes. Mathematical modeling has provided valuable insights with regard to VA kinetics. However, external comparisons to analytical determination of liver VA in rats (10) and nonhuman primates (22) with elevated VA concentrations had much lower total traced mass than the amount analytically determined in liver alone, which is hypothesized to be due to untraced, slowly turning over pools of VA. The present study provides evidence that, with longer studies, these pools manifest as an additional storage compartment in the model structure and contribute to increased traced mass. Strengths of these data include both short- and relatively long-term sampling from each participant to determine needed model complexity, as well as to observe a time-dependent response on outcomes. Further evaluation of VA kinetic models should include validation against determinations of VA pools of interest to confirm accuracy or adjust models accordingly.
These outcomes fit in the context of previous VA kinetic work. In the longest VA tracer study to date (533 ± 149 d), Sauberlich et al. (21) observed a mean half-life of 154 d and the time for tracer to mix into TBS was 26 d, which was comparable to the full models in the current study with a median half-life of 135 d and time to tracer mixing of 18.9 d. Burri et al. (19) and Cifelli et al. (18) applied compartmental modeling with 57 and 56 d of follow-up, respectively, and both stated that a second extravascular pool was not necessary to fit the models. Green and Green (20) used compartmental modeling in 3 participants sampled through 115, 211, and 240 d and fit these data to 2 extravascular pool models but did not report if a single extravascular pool would have been sufficient. The terminal slope in the 2 participants who were followed the longest became shallower after 50 d, and it was unclear if the third participant reached the final terminal slope by 115 d. These studies agree with the current results that models with longer follow-up required a 2-extravascular-pool model with changes in terminal slope and associated kinetic outcomes.
Compared with different subsets of US participants who were older than the current participants (18, 30), parameters obtained from 1-extravascular-pool, 52-d category models (to most closely match comparison studies) were generally comparable (means within 1 SD), except that delay element 3 was slightly lower in this study; however, it was comparable to that in Chinese participants using the same mathematical model (18). Considering the full, 1-extravascular-pool models, most parameters were comparable with the same 2 modeling studies, except for lower L(0,6). However, these longer models preferred 2 extravascular pools, and parameter comparisons are difficult because of different model structure. The lack of change in parameters in 2-extravascular-pool models should be interpreted with caution because, with short models, the second extravascular pool was typically not statistically required and parameters related to this pool [i.e., L(7,5) and L(5,7)] were not well defined.
Participants in this study had lower total traced mass (∼500 ± 300) than those in the comparison studies who had ∼900 ± 600 (18) and ∼1100 ± 900 (30) µmol VA. The disposal rate of VA was also lower than estimated in the previous study (i.e., ∼15 ± 6 µmol/d) (18), ranging from ∼8 µmol/d with the shorter 14-d models to ∼2 µmol/d for the full models. The EAR and RDA are 1.7 and 2.4 µmol/d, respectively (1). In a previous human VA modeling study, disposal rate was positively associated with total traced mass (18). In this study, the linear regression estimate was as follows: disposal rate (µmol/d) = 0.00200 × total traced mass (µmol) + 1.63; R2 = 0.44, P-slope = 0.07. Daily intakes of VA varied considerably among participants, ranging from less than the EAR to more than the RDA, with almost a 10-fold difference between the highest and lowest intakes. Significant and positive associations of estimated liver concentration and total traced mass with dietary VA intake are in agreement with a previous comparison of dietary VA intake by FFQ and TBS by RID (39).
The super-woman model developed from these data agreed well with median values from individual models, indicating that this approach is a feasible way to obtain population-level VA kinetic parameters. One consideration to the generalizability of these data is that all data were used for the super-woman approach, whereas in a practical application, likely more participants would be used with less sampling from each individual participant, as done in Peruvian (40) or Mexican (41) children, which may increase variance in parameter estimates.
The additional participant who was sampled until the enrichment from the dose returned to baseline shows how VA models can behave if participants are followed as long as possible. Despite obvious limitations of generalizability, results from this participant agree with data from the other participants in this study, and follow similar trends for most outcomes through 730 d of follow-up. The 1825-d model had similar outcomes to the 730-d model, indicating that any exchangeable VA pools had likely been traced and a true terminal slope observed.
With compartmental modeling, there are assumptions that must be clearly stated and considered. These include dose absorption (if orally administered), plasma volume, and plasma retinol pool size. Absorption of preformed VA has been reported as 99% (31), 94% (42), and 81% (43) in apparently healthy individuals, but can be reduced during infection or diarrhea (31, 42, 43). If not analytically determined, models with different absorption estimates can fit the same data, but model parameters will be affected to adjust for different absorption estimates. In preliminary studies, estimated absorption affected total traced mass in a linear manner similar to coefficients used for RID equations (8). The estimation of plasma volume is not trivial because plasma volume per unit of body mass changes with tissue type and body composition. Methods attempting to correct for this using weight and body surface area are prone to systematic errors (26, 44). Plasma volume is used to calculate the plasma retinol pool, which serves as the “known” compartment mass to determine all others in the steady state solution to the model. Therefore, error in this estimate will translate into compartment mass determinations. Fractional VA storage in liver must also be considered, depending on the outcome of interest (TBS compared with estimated liver concentration).
Adapting RID equations has occurred so that a short mixing period can be used by 2 approaches (8, 16). The first took a short-term mixing sample (e.g., 3 d postdosing) and correlated it with a sample taken after a standard mixing period (14, 20, or 21 d) in a subset of different participants (39, 45, 46), yielding similar correction factors among studies (8). The second used mathematical modeling to estimate values for factors, such as “S” or “F”, at shorter time points to simplify the equation matching short-term sampling. The present study shows that these factors can differ depending on the length of study used to build the model, and therefore must be considered when using this approach. The use of customized factors from models for short-term RID equations will allow pool-size estimates from compartmental analysis and RID to agree despite estimates varying between short- and long-term models.
Although this study showed relative differences between models of different study lengths and RID equations, model accuracy cannot be guaranteed without external validation of VA status (i.e., analytical determination of pool of interest) for the population of interest. Although longer-term models likely reflect slower turning over pools more accurately, all model estimates rely on certain assumptions, such as tracer absorption, that can affect resulting model outcomes. Limitations of this study include participant homogeneity due to targeted recruitment in a university setting (e.g., age, sex, education), which limits generalizability to populations such as infants and children in more socioeconomically disadvantaged situations. Determining an ideal study length is not possible with these data because the effect of time did not reach a threshold for outcomes, and the additional model outcomes from the participant who was followed for 6 y appeared to change even after 200 d of follow-up. Furthermore, the length of time needed may depend on other factors that influence VA kinetics, such as age, VA status, and infection or inflammation burden. Determining model or equation parameters while considering the effects of study length will continue to refine RID methods for accuracy and ease of use. Individual- or population-specific predictors would allow customizable factors to be used for populations of interest.
Supplementary Material
Acknowledgments
We thank Michael Green and Harold Furr for providing instruction and guidance in mathematical modeling techniques. We thank Kevin Packard of the Cornell Statistical Consulting Unit for statistical consultation. The authors’ responsibilities were as follows—BMG: performed mathematical modeling and data analysis and wrote the first draft of the manuscript; ARV: conducted the kinetic study and wrote sections of the manuscript; CRD: was involved with sample analysis and maintenance of the mass spectrometer; JAH: developed mass spectrometer methods; SAT: designed the kinetic study and revised the manuscript; and all authors: read and approved the final manuscript.
Notes
This work ranked first in the Emerging Leaders Competition for the Carotenoids and Retinoids Interactive Group at the ASN meeting in 2017.
Supported by NIH National Institute of Diabetes and Digestive and Kidney Diseases (NIDDK) 61973 and the National Research Initiative of the USDA Cooperative State Research, Education, and Extension Service (grant 2003-35200-05377).
Author disclosures: BMG, ARV, CRD, JAH, and SAT, no conflicts of interest.
Supplemental Figure 1 and Supplemental Tables 1–3 are available from the “Supplementary data” link in the online posting of the article and from the same link in the online table of contents at https://academic.oup.com/jn/.
Abbreviations used:
- EAR
Estimated Average Requirement
- RAE
retinol activity equivalent
- RID
retinol isotope dilution
- TBS
total body stores
- TLR
total liver reserve
- TTR
tracer-to-tracee ratio
- UW
University of Wisconsin
- VA
vitamin A
References
- 1. Institute of Medicine Food and Nutrition Board. Vitamin A In: Dietary Reference Intakes for vitamin A, vitamin K, arsenic, boron, chromium, copper, iodine, iron, manganese, molybdenum, nickel, silicon, vanadium, and zinc. Washington (DC): National Academies Press; 2001. p. 82–161. [PubMed] [Google Scholar]
- 2. Stevens GA, Bennett JE, Hennocq Q, Lu Y, De-Regil LM, Rogers L, Danaei G, Li G, White RA, Flaxman SR et al. Trends and mortality effects of vitamin A deficiency in children in 138 low-income and middle-income countries between 1991 and 2013: a pooled analysis of population-based surveys. Lancet Glob Health 2015;3:e528–36. [DOI] [PubMed] [Google Scholar]
- 3. Ribaya-Mercado JD, Solomons NW, Medrano Y, Bulux J, Dolnikowski GG, Russell RM, Wallace CB. Use of the deuterated-retinol-dilution technique to monitor the vitamin A status of Nicaraguan schoolchildren 1 y after initiation of the Nicaraguan national program of sugar fortification with vitamin A. Am J Clin Nutr 2004;80:1291–8. [DOI] [PubMed] [Google Scholar]
- 4. Gannon BM, Kaliwile C, Arscott SA, Schmaelzle S, Chileshe J, Kalungwana N, Mosonda M, Pixley K, Masi C, Tanumihardjo SA. Biofortified orange maize is as efficacious as a vitamin A supplement in Zambian children even in the presence of high liver reserves of vitamin A: a community-based, randomized placebo-controlled trial. Am J Clin Nutr 2014;100:1541–50. [DOI] [PMC free article] [PubMed] [Google Scholar]
- 5. Tanumihardjo SA, Russell RM, Stephensen CB, Gannon BM, Craft NE, Haskell MJ, Lietz G, Schulze K, Raiten DJ. Biomarkers of Nutrition for Development (BOND)—vitamin A review. J Nutr 2016;146(Suppl):1816S–48S. [DOI] [PMC free article] [PubMed] [Google Scholar]
- 6. Furr HC, Amedee-Manesme O, Clifford AJ, Bergen H III, Jones A, Anderson D, Olson J. Vitamin A concentrations in liver determined by isotope dilution assay with tetradeuterated vitamin A and by biopsy in generally healthy adult humans. Am J Clin Nutr 1989;49:713–6. [DOI] [PubMed] [Google Scholar]
- 7. Haskell MJ, Handelman GJ, Peerson JM, Jones AD, Rabbi MA, Awal MA, Wahed MA, Mahalanabis D, Brown KH. Assessment of vitamin A status by the deuterated-retinol-dilution technique and comparison with hepatic vitamin A concentration in Bangladeshi surgical patients. Am J Clin Nutr 1997;66:67–74. [DOI] [PubMed] [Google Scholar]
- 8. Gannon BM, Tanumihardjo SA. Comparisons among equations used for retinol isotope dilution in the assessment of total body stores and total liver reserves. J Nutr 2015;145:847–54. [DOI] [PMC free article] [PubMed] [Google Scholar]
- 9. Green MH. Evaluation of the “Olson equation”, an isotope dilution method for estimating vitamin A stores. Int J Vitam Nutr Res 2014;84:9–15. [DOI] [PubMed] [Google Scholar]
- 10. Green MH, Green JB. Quantitative and conceptual contributions of mathematical modeling to current views on vitamin A metabolism, biochemistry, and nutrition. Adv Food Nutr Res 1996;40:3–24. [DOI] [PubMed] [Google Scholar]
- 11. Cifelli CJ, Green JB, Green MH. Use of model-based compartmental analysis to study vitamin A kinetics and metabolism. Vitam Horm 2007;75:161–95. [DOI] [PubMed] [Google Scholar]
- 12. Green MH, Ford JL, Green JB, Berry P, Boddy AV, Oxley A, Lietz G. A retinol isotope dilution equation predicts both group and individual total body vitamin A stores in adults based on data from an early postdosing blood sample. J Nutr 2016;146:2137–42. [DOI] [PMC free article] [PubMed] [Google Scholar]
- 13. von Reinersdorff D. Development of a compartmental model describing the dynamics of vitamin A metabolism in men. Adv Exp Biol Med 1998;445:207–23. [DOI] [PubMed] [Google Scholar]
- 14. Green MH, Ford JL, Oxley A, Green JB, Park H, Berry P, Boddy AV, Lietz G. Plasma retinol kinetics and β-carotene bioefficacy are quantified by model-based compartmental analysis in healthy young adults with low vitamin A stores. J Nutr 2016;146:2129–36. [DOI] [PMC free article] [PubMed] [Google Scholar]
- 15. Tang G, Qin J, Dolnikowski GG, Russell RM. Short-term (intestinal) and long-term (postintestinal) conversion of beta-carotene to retinol in adults as assessed by a stable-isotope reference method. Am J Clin Nutr 2003;78:259–66. [DOI] [PubMed] [Google Scholar]
- 16. Furr HC, Green MH, Haskell M, Mokhtar N, Nestel P, Newton S, Ribaya-Mercado JD, Tang G, Tanumihardjo S, Wasantwisut E. Stable isotope dilution techniques for assessing vitamin A status and bioefficacy of provitamin A carotenoids in humans. Public Health Nutr 2005;8:596–607. [DOI] [PubMed] [Google Scholar]
- 17. Wang Z, Yin S, Zhao X, Russell RM, Tang G. β-Carotene–vitamin A equivalence in Chinese adults assessed by an isotope dilution technique. Br J Nutr 2004;91:121–31. [DOI] [PubMed] [Google Scholar]
- 18. Cifelli CJ, Green JB, Wang Z, Yin S, Russell RM, Tang G, Green MH. Kinetic analysis shows that vitamin A disposal rate in humans is positively correlated with vitamin A stores. J Nutr 2008;138:971–7. [DOI] [PubMed] [Google Scholar]
- 19. Burri BJ, Park JY. Compartmental models of vitamin A and β-carotene metabolism in women. Adv Exp Med Biol 1998;445:225–37. [DOI] [PubMed] [Google Scholar]
- 20. Green MH, Green JB. Dynamics and control of plasma retinol. In: Blomhoff R, editor. Vitamin A in health and disease. New York: Marcel Dekker, Inc.; 1994. p. 119–33. [Google Scholar]
- 21. Sauberlich HE, Hodges RE, Wallace DL, Kolder H, Canham JE, Hood J, Raica N Jr., Lowry LK. Vitamin A metabolism and requirements in the human studied with the use of labeled retinol. Vitam Horm 1974;32:251–75. [DOI] [PubMed] [Google Scholar]
- 22. Escaron AL, Green MH, Howe JA, Tanumihardjo SA. Mathematical modeling of serum 13C-retinol in captive rhesus monkeys provides new insights on hypervitaminosis A. J Nutr 2009;139:2000–6. [DOI] [PMC free article] [PubMed] [Google Scholar]
- 23. Willett W, Sampson L, Stampfer M, Rosner B, Bain C, Witschi J, Hennekens C, Speizer F. Reproducibility and validity of a semiquantitative food frequency questionnaire. Am J Epidemiol 1985;122:51–65. [DOI] [PubMed] [Google Scholar]
- 24. Willett W, Sampson L, Browne M, Stampfer M, Rosner B, Hennekens C, Speizer F. The use of a self-administered questionnaire to assess diet four years in the past. Am J Epidemiol 1988;127:188–99. [DOI] [PubMed] [Google Scholar]
- 25. Tanumihardjo SA. Synthesis of 10, 11, 14, 15-13C4-and 14, 15-13C2-retinyl acetate. J Label Compd Radiopharm 2001;44:365–72. [Google Scholar]
- 26. Feldschuh J, Enson Y. Prediction of the normal blood volume: relation of blood volume to body habitus. Circulation 1977;56:605–12. [DOI] [PubMed] [Google Scholar]
- 27. Chaplin H, Mollison P. Correction for plasma trapped in the red cell column of the hematocrit. Blood 1952;7:1227–38. [PubMed] [Google Scholar]
- 28. Chaplin H, Mollison PL, Vetter H. The body/venous hematocrit ratio: its constancy over a wide hematocrit range. J Clin Invest 1953;32:1309–16. [DOI] [PMC free article] [PubMed] [Google Scholar]
- 29. Cobelli C, Toffolo G, Foster D. Tracer-to-tracee ratio for analysis of stable isotope tracer data: link with radioactive kinetic formalism. Am J Physiol Endocrinol Metab 1992;262:E968–75. [DOI] [PubMed] [Google Scholar]
- 30. Park H, Green MH. Parameter identifiability and extended multiple studies analysis of a compartmental model for human vitamin A kinetics: fixing fractional transfer coefficients for the initial steps in the absorptive process. Br J Nutr 2014;111:1004–10. [DOI] [PubMed] [Google Scholar]
- 31. Sivakumar B, Reddy V. Absorption of labelled vitamin A in children during infection. Br J Nutr 1972;27:299–304. [DOI] [PubMed] [Google Scholar]
- 32. Landlaw EM, DiStefano JJ III. Multiexponential, multicompartmental, and noncompartmental modeling. II. Data analysis and statistical considerations. Am J Physiol 1984;246:R665–77. [DOI] [PubMed] [Google Scholar]
- 33. Bausch J, Rietz P. Method for the assessment of vitamin A liver stores. Acta Vitam Enzym 1977;31:99–112. [PubMed] [Google Scholar]
- 34. Hicks VA, Gunning DB, Olson JA. Metabolism, plasma transport and biliary excretion of radioactive vitamin A and its metabolites as a function of liver reserves of vitamin A in the rat. J Nutr 1984;114:1327–33. [DOI] [PubMed] [Google Scholar]
- 35. Wolfe RR, Chinkes DL. Isotope tracers in metabolic research: principles and practice of kinetic analysis. 2nd ed Hoboken (NJ): John Wiley & Sons, Inc.; 2005. [Google Scholar]
- 36. Olson JA. Recommended Dietary Intakes (RDI) of vitamin A in humans. Am J Clin Nutr 1987;45:704–16. [DOI] [PubMed] [Google Scholar]
- 37. Cifelli CJ, Green JB, Green MH. Dietary retinoic acid alters vitamin A kinetics in both the whole body and in specific organs of rats with low vitamin A status. J Nutr 2005;135:746–52. [DOI] [PubMed] [Google Scholar]
- 38. National Research Council. Dietary Reference Intakes for vitamin C, vitamin E, selenium, and carotenoids. Washington (DC): National Academies Press; 2000. [PubMed] [Google Scholar]
- 39. Valentine AR, Davis CR, Tanumihardjo SA. Vitamin A isotope dilution predicts liver stores in line with long-term vitamin A intake above the current Recommended Dietary Allowance for young adult women. Am J Clin Nutr 2013;98:1192–9. [DOI] [PMC free article] [PubMed] [Google Scholar]
- 40. Haskell MJ, Lembcke JL, Salazar M, Green MH, Peerson JM, Brown KH. Population-based plasma kinetics of an oral dose of [2H4]retinyl acetate among preschool-aged Peruvian children. Am J Clin Nutr 2003;77:681–6. [DOI] [PubMed] [Google Scholar]
- 41. Lopez-Teros V, Ford JL, Green MH, Tang G, Grusak MA, Quihui-Cota L, Muzhingi T, Paz-Cassini M, Astiazaran-Garcia H. Use of a “super-child” approach to assess the vitamin A equivalence of Moringa oleifera leaves, develop a compartmental model for vitamin A kinetics, and estimate vitamin A total body stores in young Mexican children. J Nutr 2017;147:2356–63. [DOI] [PubMed] [Google Scholar]
- 42. Reddy V, Raghuramulu N, Arunjyoti, Shivaprakash M, Underwood B. Absorption of vitamin A by children with diarrhoea during treatment with oral rehydration salt solution. Bull World Health Organ 1986;64:721–4. [PMC free article] [PubMed] [Google Scholar]
- 43. Aklamati E, Mulenga M, Dueker S, Buchholz B, Peerson J, Kafwembe E, Brown KH, Haskell M. Accelerator mass spectrometry can be used to assess vitamin A metabolism quantitatively in boys in a community setting. J Nutr 2010;140:1588–94. [DOI] [PMC free article] [PubMed] [Google Scholar]
- 44. Feldschuh J, Katz S. The importance of correct norms in blood volume measurement. Am J Med Sci 2007;334:41–6. [DOI] [PubMed] [Google Scholar]
- 45. Tang G, Qin J, Hao L, Yin S, Russell RM. Use of a short-term isotope-dilution method for determining the vitamin A status of children. Am J Clin Nutr 2002;76:413–8. [DOI] [PubMed] [Google Scholar]
- 46. Ribaya-Mercado JD, Solon FS, Dallal GE, Solomons NW, Fermin LS, Mazariegos M, Dolnikowski GG, Russell RM. Quantitative assessment of total body stores of vitamin A in adults with the use of a 3-d deuterated-retinol-dilution procedure. Am J Clin Nutr 2003;77:694–9. [DOI] [PubMed] [Google Scholar]
Associated Data
This section collects any data citations, data availability statements, or supplementary materials included in this article.