1. Introduction
Many hematological malignancies are treated with glucocorticoids (GCs), and recent work has begun to reveal the network of genes leading to GC-dependent apoptosis. Action of GCs involves cross-talk between the glucocorticoid receptor (GR) and several cell signaling cascades [1–7]. MAPKs ERK [5, 7], JNK [5,7] and p38 [6,7] as well as cAMP-driven PKA [4, 7] and mTOR [7,8] pathways can influence GC-GR effects on cell growth and differentiation. Resistance to GC may therefore derive not from lack of GR but altered pathway interactions.
Studies from our laboratory had shown that ERK and JNK serve to inhibit the apoptotic effects of GC in CEM clones [7]. A correlation between GC-driven induction of the GR and apoptotic outcome has been shown in CEM and other malignant lymphoid cells [9–14]. In a GC-sensitive CEM clone the GR is phosphorylated at serine 211 (GRP S211) by p38 MAPK, resulting in increased GR-driven transcription and apoptosis [6,15]. PKA and GC synergize to overcome resistance in human leukemic CEM-C1 cells, and this finding was correlated with c-myc suppression [4, 16, 17]. In lymphoid T-cells, GR autoinduction also has been linked to GC sensitivity [18, 19]. Gene array analysis of Dex-sensitive CEM cells destined for apoptosis 24 hours after GC-activated the GR showed a striking increase in mRNA of the pro-apoptotic Bcl2 family member Bim, just at the onset of the cell death process [20, 21]. We hypothesized that the disregulation of signal transduction pathways is a general mechanism in GC-resistant hematological malignancies.
We tested predictions of our hypothesis: that ERK and JNK and mTOR activation act to oppose the apoptotic effect of GCs, while activation of PKA and p38 MAPK promotes it. The outcome and quantity of pro-apoptotic pathway adjustments, we reasoned, would converge on the induction and phosphorylation state of the GR. A final pro-apoptotic consequence should be the induction of Bim. Eight cell lines from various types of human hematological malignancies were selected. All contain functional GR; and all are resistant to GC-dependant apoptosis. RPMI 8226 and OPM I are B-lymphoblastic myelomas derived from peripheral blood. IM-9 is an EBV positive B-cell leukemia. Ramos represents Burkitt’s lymphoma, a B-lymphocyte, as well as an EBV negative cell line. Molt-4, like CEM, is a T-cell lineage ALL. Mo (MoT) is a hairy cell (specialized T-cell) leukemia line. We chose two myeloid lineage cell lines: HL-60 (acute myelogenous leukemia, AML) and K-562 (chronic myelogenous leukemia, CML).
Consistent with our hypothesis, inhibition of ERK and JNK or of mTOR, and activation of PKA restored GC sensitivity to all but one of the resistant lymphoid malignancies. Increased total GR and/or GRP at S211 and increased levels of Bim were accompanied with restored sensitivity. Appropriate pharmacological modulations of the ERK, JNK, PKA and/or mTOR pathways in combination GC may offer potential for treatment of certain refractory hematological malignancies.
2. Materials and Methods
2.1. Cell lines
The following cell lines were obtained from ATCC: HL-60, IM-9, K-562, Mo, Molt-4, and Ramos. OPM-I [22] and RPMI 8226 [23] were established as previously reported.
2.2. Cell culture and drug treatments
RPMI 8226, IM-9, Ramos and Molt 4 cells were grown in RPMI 1640 (Cellgro Media Tech, Herndon, VA) at pH 7.4 supplemented with 10% fetal bovine serum (FBS, Atlanta Biologicals, Norcross, GA). OPM-I cells were cultured in RPMI 1640 at pH 7.4 supplemented with 10% defined FBS (HyClone, Logan, UT); HL-60, K-562 and Mo cells were grown in Iscove’s modification of DMEM (Cellgro Media Tech, Herndon, VA) at pH 7.4, supplemented with 10% FBS (Atlanta Biologicals). Cells were cultured at 37°C in a humidified atmosphere of 95% air / 5% CO2 and subcultured regularly to ensure logarithmic growth. In preliminary experiments, the concentrations of forskolin (Fsk) and rapamycin that provided optimal effect with minimal toxicity were determined. RPMI 8226 and Ramos cells were treated as appropriate for each experiment with vehicle (ethanol/DMSO/and/or sterile HPLC-grade water < 0.1% final concentration), 1 µM Dex, 1 µg/ml SP600125, 1 µg/ml U0126, 10 µM Fsk, 1 µM cell permeable JNK inhibitory peptide (ip) (Calciochem, San Diego, CA), 15 nM rapamycin, or various combinations of each. Molt 4 cells were treated identically except for using 5 nM rapamycin. IM-9 cells were treated the same as RPMI 8226 except for substituting 3 µg/ml U0126 and 100 nM rapamycin. OPM I cells were treated as RPMI 8226 except for 5 µM Fsk and 5 nM rapamycin. All reagents were from Sigma-Aldrich (St. Louis, MO), Burdick and Jackson (Muskegon, MI), or Calbiochem.
2.3. Viable cell determination
Cell culture density ranged from 1×10⁵ to 1×10⁶ viable cells/ml. Cell viability was determined by Trypan blue vital dye exclusion (Sigma-Aldrich) using automated cell counting (Vi-Cell, Beckman Coulter, Miami, FL). Doubling times, in hours, were generated using GENTIME: OPM-I 32.8, HL-60 30.0, Mo 29.6, Ramos 24.5, CEM-C7-14 22.0, Molt-4 19.5, RPMI 8226 16.5, IM-9 14.5, and K-562 12.0. For flow cytometry, cells were collected by centrifugation and stained with propidium iodide (PI) as described [7]. At least 25,000 cells per assay were analyzed.
2.4. Detection of active caspase 3
To evaluate caspase involvement when cell death was observed, cells were treated with the pan-caspase inhibitor Z-VAD (15µM) (R&D Systems, Inc., Minneapolis, MN) for 2 hours, followed by the above mentioned concentrations of Fsk, rapamycin and Sp600125 + U0126 with and without Dex. APO ACTIVE 3 antibody-FITC detection kit was used per manufacturer’s instructions (Cell Technology, Mountain View, CA.). Approximately 20,000 cells were analyzed using single color flow cytometry at 488 nm.
2.5. Immunochemical analysis
Cells in mid-logarithmic growth (3×10⁵ cells/ml) were pretreated for varying times with Dex +/− appropriate pharmacological agents, after which whole cell lysates were immunoblotted. Antibodies used: phospho-specific GR at S211 (Cell Signaling Technology, Danvers, MA); anti-GR (Affinity Bioreagents, Golden, CO); β-actin (Santa Cruz Biotechnology, Santa Cruz, CA); and Bim (Sigma-Aldrich).
MAPK Immunoblots were performed with antibodies specific for: phospho-(Threonine202 and Tyrosine204) – ERK; phospho (Threonine183 and Tyrosine182) – p38 (Cell Signaling Technology); or phosphorylation state independent ERK (Calbiochem), or JNK (Cell Signaling Technology), or p38 MAPK (Calbiochem).
2.6. MAPK proportion calculation
Preliminary experiments in each cell line established the linear range for detection of immunochemical reaction for ERK, JNK, and p38 (data not shown). Working within this range, total and phosphorylated ERK, JNK, and p38 were estimated quantitatively by image analysis. In 3 independent experiments, none of the MAPK's showed variation in the basal state or after Dex treatment. Therefore, the amount of each immunochemically detected MAPK could be expressed in terms of total protein extracted (adjusted to X/ml in every experiment). The relative phosphorylated forms of each MAPK, estimated immunochemically, could be calculated:
For more details on this analysis refer to Miller et al. [7].
3. Results
3.1. Characterization of resistant cell lines
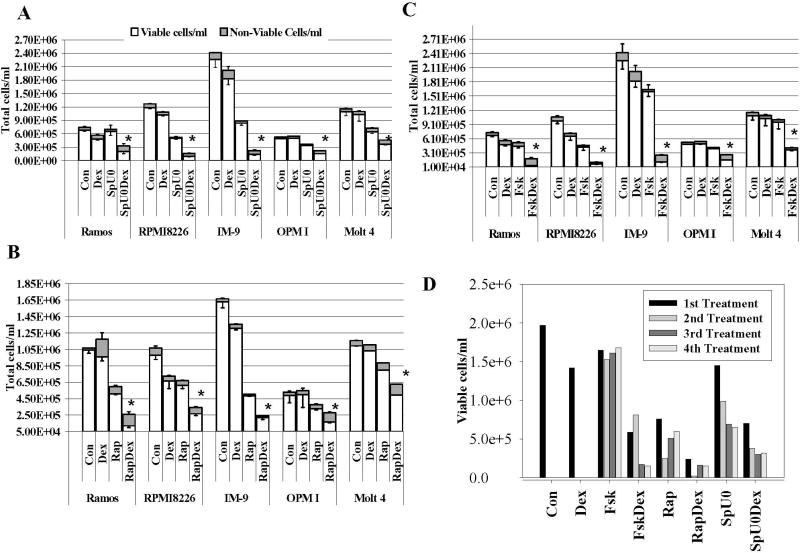
All chosen cell lines had been reported, with varying degrees of detail, to be GC-resistant. We confirmed that they were resistant to 1µM Dex by following growth and viability for 96 hours. Three lines (Ramos, RPMI 8226 and IM-9) showed minimal to modest slowing of doubling time with Dex, without loss in viability. (Data not shown; see Dex controls, Fig. 2A, Supplementary Figure 1).
Fig. 2. Manipulation of three signaling pathways can sensitize lymphoid cells to Dex.
Equal numbers of growing cells were plated in triplicate in 12-well tissue culture plates. In each experiment, the pathway-altering agents at empirically determined concentrations that caused little or no reduction in viability were added first, and after a suitable interval, Dex was added to 1 µM. Control wells (Con) received <0.1% by volume ethanol vehicle. Total, viable and non-viable (Trypan-blue stained) cells were counted (Vi-cell Counter, Beckman) 96 h after addition of Dex. Results are shown as averages from three such experiments. Error bars correspond to 1 standard deviation: upward, for non-viable cells; downward, for viable cells. Where no error bars are shown, the standard deviation fell within the margins of the bar. Error bars= 1 standard deviation of average experiments, n=3 each performed in triplicates; p value based on two-tailed students t-test for matched drug treatments using Excel. A. Inhibition of ERK and JNK. ERK inhibitor via upstream MEK: U0126 (U0); JNK inhibitor: SP600125 (Sp). Combined treatment, SpU0. Comparing SpU0 treated cells with SpU0 + Dex gave p values for the reduction in viable cells (*) ranging from 0.02 to 0.007. B. Rapamycin (Rap). Rap vs. Rap + Dex comparisons gave p values 0.02-0.001. C. Forskolin (Fsk). Fsk vs. Fsk + Dex comparisons gave p 0.02-0.00006. D. Repeated treatments with pathway-altering combinations. IM-9 cells were treated with each drug or combination, counted 96 h later, allowed to recover, and retreated four times in succession. Each bar shows the results from one cycle. Con and Dex only show one bar because after cycle one, the cells overgrew the wells. Ramos and Molt-4 cells were tested using the same protocol and showed similar results.
Most lymphoid cells in tissue culture selected for GR resistance have been shown to lose active GR [24, 25]. Cells from GC-resistant patients, however, are often GR+ [26]. We therefore selected lines previously reported to be GR positive: RPMI 8226 37,000 sites/cells [27], IM-9 23,000 [12], K-562 12,300 [13], HL-60 10,300 [13], Ramos 8,870 [28], MOLT-4 8,600 [12]; and the Dex-sensitive cell line CEM-C7-14 8,400 (EBT, unpublished data). The GR content of OPM-I has been reported as 64.3± 11.0 fmol GR protein/106 cells [27]. To our best knowledge, only GR presence and function in Mo (MoT) has been reported, as discussed later [29]. The cell lines all had similar GR binding affinities for Dex, with Kds ranging from 1.9×10⁻⁹M for CEM-C7-14 cells to 12.5×10⁻⁹M for Ramos. We have confirmed the presence of GR in each cell line by immunoblot analysis (data not shown).
Functionality of the GR in these cell lines has been reported. IM-9 cells showed some biochemical responses to GCs but were not growth inhibited [30, 31]. HL-60 cells were growth inhibited when GCs were administered together with interferon-α [32]. Functional GR was documented for RPMI 8226 and OPM-1 [12], Molt-4, K-526 [30] and Ramos [33]. Transient transfection experiments of the Hairy cell leukemia cell line MoT with reporter plasmid driven by a GC response element (GRE) resulted in an increase in GRE-dependent transcriptional activity indicating endogenous functional GR [34].
3.2. Dex-resistant cell lines have higher basal levels of phosphorylated (active) JNK and ERK than a Dex-sensitive cell line
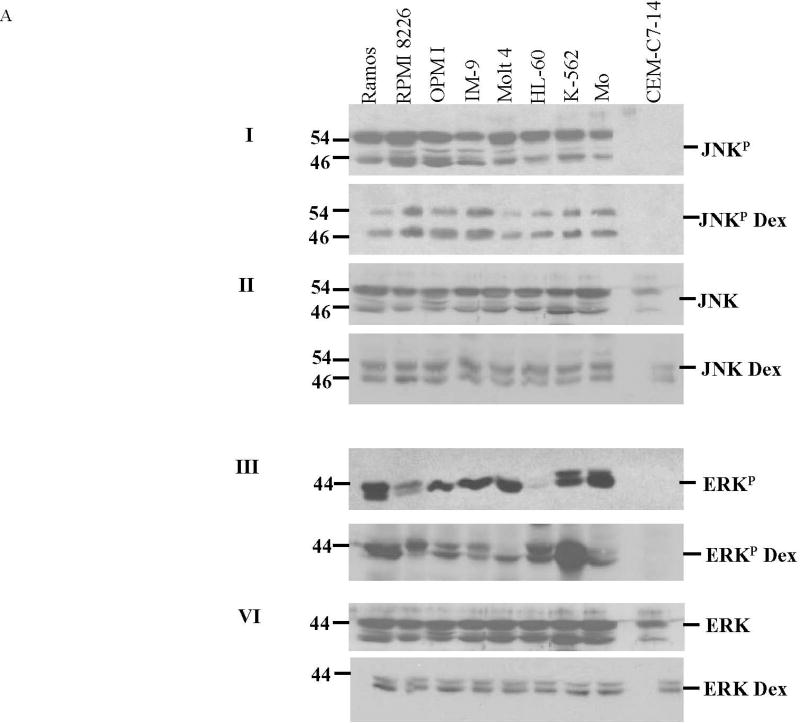
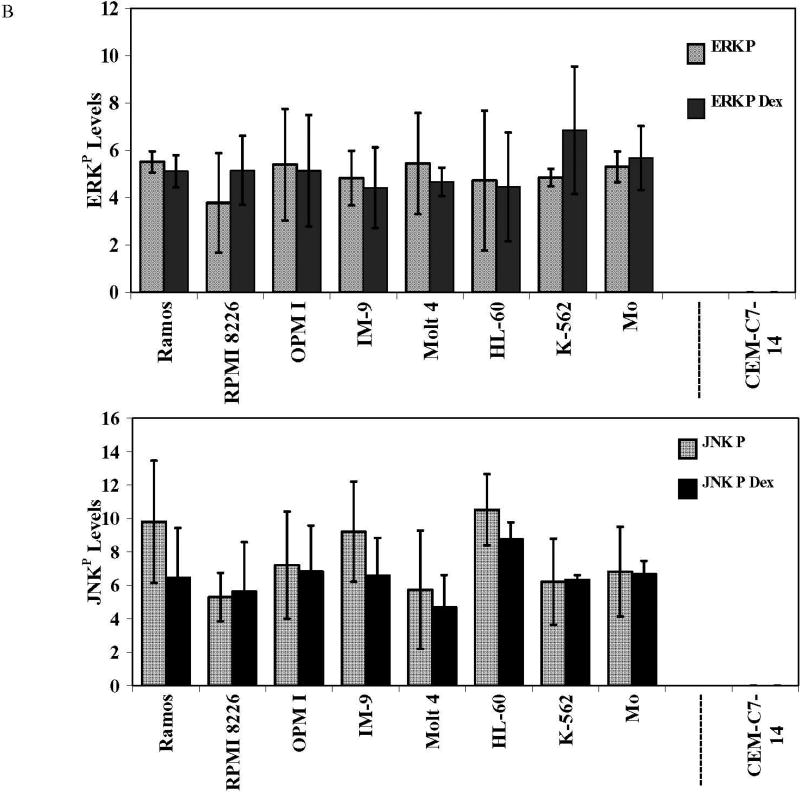
Data from CCRF-CEM clones indicates that JNK and ERK protect against, whereas p38 enhances, GC-dependent apoptosis [7]. The GC-resistant clone CEM-C1-15 contains high basal levels of phosphorylated (activated) JNK as well as phosphorylated ERK, compared to sensitive clones CEM-C1-6 and CEM-C7-14. Inhibition of ERK and JNK converted C1-15 cells to GC-sensitive [7]. We therefore compared the phosphorylation levels of JNK and ERK in the eight malignant Dex-resistant cell lines with those of the Dex-sensitive clone CEM-C7-14 without or with Dex treatment. Within each cell line neither total nor phosphorylated JNK or ERK varied significantly with or without Dex (Figure 1). However the levels of phosphorylated JNK and ERK were much higher in each of the resistant lines than in GC-sensitive clone CEM-C7-14 (Fig. 1). The bar graph shows the average phosphorylated JNK and ERK levels, with and without Dex treatment; In the same scale, in CEM-C7-14 cells they are too low to be seen’ though they are detectable with longer film exposure. Phosphorylation of MAPKs is associated with their activation; hence these results are consistent with our hypothesis that ERK and JNK activities are protective and may play a crucial role in resistance to GCs. We concluded that: 1. total JNK and ERK protein levels were not affected by the addition of Dex; 2. total JNK and ERK protein levels were somewhat higher in the resistant cell lines when compared to the sensitive cell line; and 3. all the GC-resistant cell lines expressed higher levels of phosphorylated JNK and ERK than GC-sensitive CEM cells.
Fig. 1. All the Dex-resistant cell lines have high levels of JNKP and ERKP relative to Dex-sensitive CEM-C7-14 cells.
Cells were plated at 3×10⁵ viable cells/ml. After exposure to 1 µM Dex or vehicle for 24 h, cell lysates were prepared and analyzed by immunoblot for total and phosphorylated ERK and JNK. Each filter was subsequently blotted for β-actin (not shown). A. Characteristic blots from two experiments, Experiment 1, filters I and II, for phosphorylated (JNKP) and total JNK, each ± Dex. Experiment 2, filters III and IV, for ERKP and total ERK ± Dex. B. Average JNKP and ERKP levels, ± Dex, each cell line. Means from 3 independent experiments. Images were analyzed densitometrically and normalized to β-actin. Ordinate: Ratio of densitometry units, MAPK/actin. Error bars =1 standard deviation of average n=3 independent experiments; p value based on two-tailed students t-test using Excel.
3.3. Manipulation of several signaling pathways can restore sensitivity to Dex in resistant lymphoid malignancies
Cell growth and viability were evaluated by several methods, including phase contrast microscopy, counts of viable cells and flow cytometry for DNA content.
ERK activity was pharmacologically blocked by inhibiting its upstream MEK with U0126, and JNK activity was inhibited by either SP600125 or i.p. Inhibition of ERK and JNK slowed cell growth with minimal effects on viability. In five of the eight tested cell lines addition of Dex then caused apoptosis, with a marked reduction of total viable cells and obvious cellular death seen by phase contrast microscopy (Figure 2A, E). These cell lines were the Burkitt’s lymphoma (Ramos), 3 myeloma lines (RPMI 8226, IM-9, OPM-I), and the T-cell leukemia Molt-4 (Fig. 2A). The bar graphs show total cell counts after 96 hours and distinguish residual viable cells (open bar) from countable but non-viable (shaded bar) Trypan blue-positive cells. The combination of both inhibitors (Fig. 2A, SpU0) had a greater sensitizing effect in the B-lineage cell lines, where viable cell counts were reduced after Dex (SpU0Dex) by 66% – 87% than in the T cell derived Molt-4 cells, where the block of ERK and JNK followed by Dex resulted in a 45% decrease. To test for non-specific drug effects, we also employed a peptide specifically inhibitory to JNK in Ramos and RPMI 8226 cells. The combination of JNK inhibitory peptide and ERK inhibitor U0126 also rendered the cells sensitive to Dex-dependent apoptosis (data not shown). Treatment of the hairy cell leukemia line Mo cells with inhibitors of ERK and JNK alone reduced cell growth and viable cell numbers; however, no additional Dex effect was observed (Supplementary Figure 1a). Finally, the myelogenous leukemias HL-60 and K-562 showed no response to any of the treatments (Supplementary Figure 1b and 1c respectively).
Rapamycin, an inhibitor of mTOR, has been reported to stimulate G1 arrest in cycling B-chronic lymphoblastic leukemia cells and to interfere with many molecules important for cell cycle regulation [35]. We also confirm and extend prior studies linking rapamycin treatment to Dex induced apoptosis, in two resistant myeloma lines [8] and one T-cell leukemia line [7]. Following pretreatment with rapamycin for 24 hours, Dex was added to the cell cultures and the effect was followed by counting viable cells after a total treatment time of 96 hours. The same five cell lines that had shown Dex sensitization by blocking ERK and JNK were sensitized by rapamycin (Figure 2B). The extend of cell death was greatest in Ramos cells (87% decrease in viable cells), followed by myelomas RPMI 8226 and OPM-I, IM-9 cells and the T-cell line Molt-4 (38% decrease).
Fsk activates adenylate cyclase and thus cAMP production, which in turn causes activation of PKA [4, 15]. Loss of PKA activity has been demonstrated to cause a significant decrease in GC sensitivity [36]. PKA and GCs act synergistically to overcome resistance in Dex-resistant CEM cells and this correlates with c-myc and Hedgehog pathway suppression [4, 15]. We now extend these results by showing a synergistic effect of PKA with GCs to induce apoptosis in several lymphoid malignancies (Fig. 2C, Supplementary Figure 2). Ramos and IM-9 cells showed the greatest sensitivity to combined treatment with Fsk plus Dex, with decreases of viable cells by 97 and 93%, respectively. The treatment resulted in a reduction of drug matched viable cells by 83, 69 and 60% in RPMI 8226, OPM-I and Molt-4, respectively. Significant growth inhibitory effect by Fsk alone was only seen in RPMI 8226 when compared to Dex treatment. Thus of the three pathways, the PKA path provided the greatest sensitization to Dex and the least effect on cell growth. The myeloid cell lines exhibited no response to Dex when Fsk was present (Supplementary Figure 1b,c).
3.4. Repeated cycles of treatment with sensitizing drugs followed by Dex leads to increased cell kill
Since the restored sensitivity of these cell lines did not result in a complete loss of viable cells during a single round of treatment, we evaluated the sensitivity of the residual cell populations. The possibility of a completely resistant subpopulation was excluded by re-treating the cell population of Ramos, IM-9 and Molt-4 after 2–3 days of recovery time, when cell viability of the population had returned to ≥ 85%. All three cell lines responded with a similar or greater degree of cell kill when given up to 4 additional cycles of combination drugs. This response is shown for IM-9 cells in Fig. 2D, as typical of the three cell lines. No significant population of resistant cells appears to have emerged after four rounds of treatment.
3.5. Flow cytometry and caspase 3 activity (FACS) indicate that in inhibitor treated cells Dex causes apoptosis
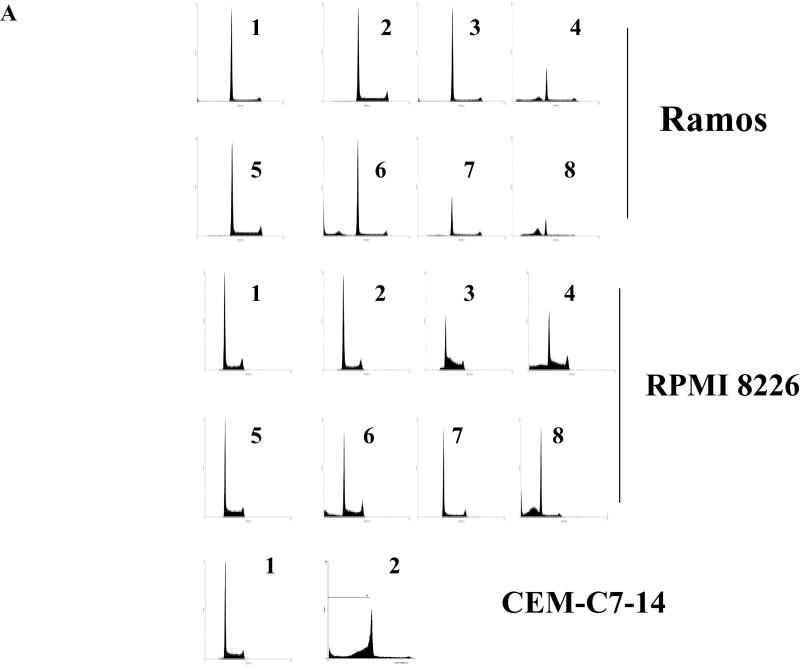
The appearance of apoptosis in microscopic visualization of cells reverted to Dex sensitivity was confirmed by documenting two characteristic features of apoptosis: lysis of DNA karyorrhexis within intact plasma membranes and activation of caspases. Flow cytometry of PI-stained cells showed that none of the single treatments increased the population of cells with sub-diploid amounts of DNA. Each combination of drug(s) plus Dex, however, resulted in a clear increase of sub-diploid cells, a classic indicator of apoptosis. Results with RPMI 8226 and Ramos cells are shown, with the Dex-treated, Dex-sensitive clone CEM-C7-14 as positive control (Fig 3A). An increase over controls by each combination was confirmed in all 5 lines convertible to Dex-sensitive and was not observed in the 3 lines that did not convert (not shown).
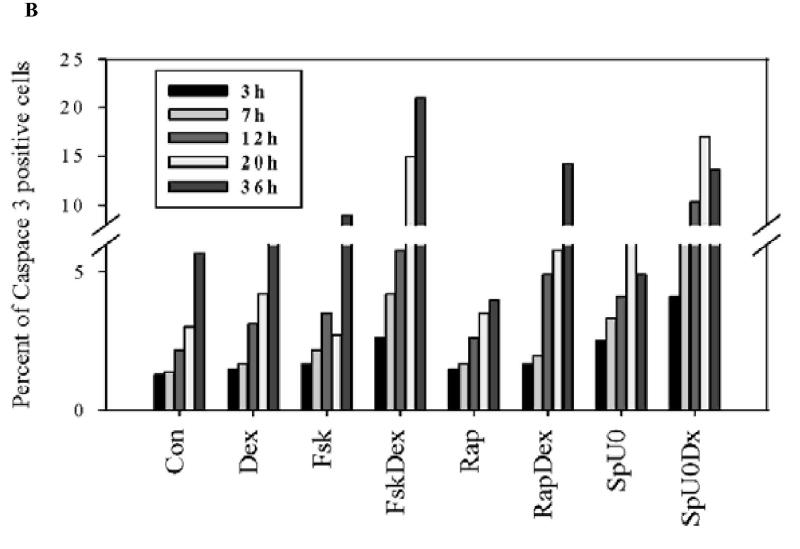
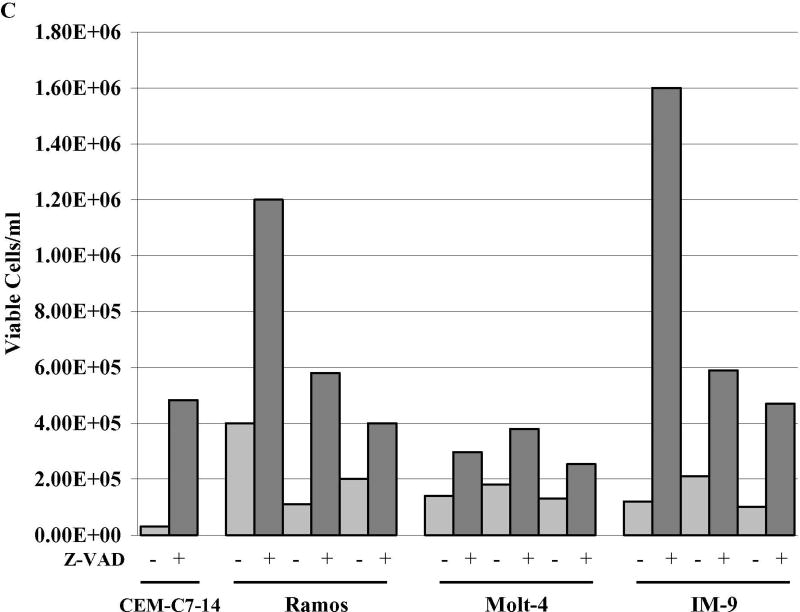
Fig. 3. Biochemical markers indicate Dex-dependant cell death is apoptotic after sensitizing treatments.
A. Acquisition of sud-diploid DNA content. FACS analysis of PI stained cells. RPMI 8226 and Ramos cells treated for 96 h. 1- vehicle control, 2- Dex, 3- Fsk, 4- FskDex, 5- Rap, 6-Rap+Dex, 7-Sp600125+U0126, 8- Sp600125+U0126+Dex. B. Time course, activation of caspase 3. Percent cells positive for activated caspase 3 at times indicated after each treatment. Note break scale of ordinate. Ramos cells. C. Inhibition of Dex-dependant apoptosis by Z-VAD. CEM-C7-14 cells (Dex-sensitive controls) were exposed to Dex ± Z-VAD to block caspase activity. Dex-resistant, Ramos, Molt-4 and IM-9 were treated with Fsk+ Dex, Rap+ Dex and SpU0 + Dex, each ± Z-VAD and viable cells counted 96 h later. Averages from three experiments, error bars= 1 standard deviation of the average n=3 each performed in triplicates; p value based on two-tailed students t-test using Excel. In all conditions, comparing Z-VAD with non Z-VAD treatments gave p value ranging from 0.05 to 0.0003.
FACS identified cells containing activated caspase 3 after exposure to purified polyclonal antibodies specific for the cleaved protease raised against amino acid sequence 163–175 of murine caspase 3. A time course analysis was performed in Ramos cells, following each of the three sensitizing treatments: block ERK and JNK activity, inhibition of mTOR or activation of PKA, alone and with the addition of Dex (Fig. 3B). Alone, Dex, Fsk, rapamycin, and the SP600125 plus UO126 combination each caused a modest increase in caspase 3 positive cells, control also increased over time. Dex in conjunction with each of the other treatments resulted after ≥ 20 hours in a two to three fold increase in caspase positive cells relative to drug-matched controls. This substantiates a late apoptotic event, consistent with the lag before overt apoptosis seen microscopically or by cell counting. Treatment for 36h was therefore chosen to screen IM-9 and Molt-4, representing the other two classes of cells that could be sensitized to Dex. Caspase 3 positive cells in IM-9 ranged from 3–5% after single-variable treatments and rose to 11–20% when Dex was added to the respective sensitizing treatments. Molt-4 showed 2–5% caspase 3 positive cells in single variable circumstances, and this rose to 7–10% after Dex was added to the other drugs (data not shown). The inherently Dex-sensitive cell line CEM-C7-14 was used as a positive control. Dex-sensitive CEM-C7-14 cells were 10% caspase 3 positive after 36 hours with Dex. This single time-point may not show the maximum effect in each cell line, but the data clearly indicate a “snapshot” sensitizing effect of each of the three pathway inhibitors to Dex-dependent activation of caspase 3.
3.6. Inhibition of caspase activity by Z-VAD blocks the death of cells sensitized to Dex
To confirm the causative role of caspases in these apoptotic events, we inhibited caspase activity in cell cultures by addition of Z-VAD, and then carried out sensitizing treatments followed by Dex challenge. Dex-sensitive CEM-C7-14 cells, given Dex, which are known to die by apoptosis, were also treated with Z-VAD to confirm reversal of Dex sensitivity. In these and in all three tested cell lines- Ramos, IM-9 and Molt-4, there was a statistically significant reduction in Dex-dependent death when caspases were blocked by Z-VAD (Figure 3C).
3.7. Dex-sensitizing treatments alter the balance between anti- and pro-apoptotic MAPK’s
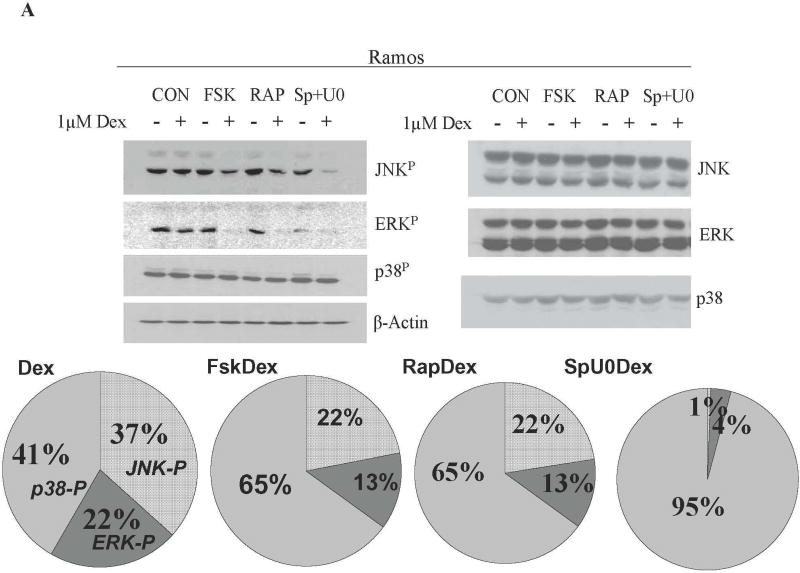
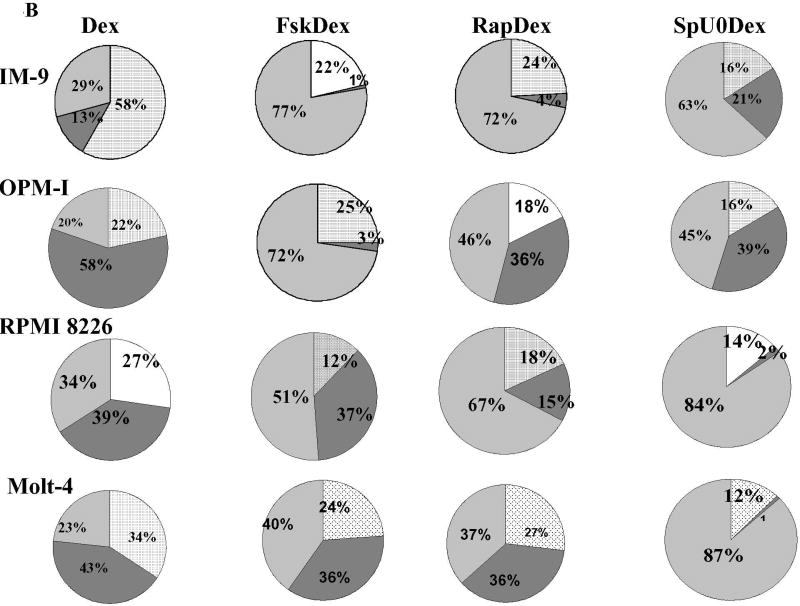
In CEM clones, inhibition of ERK and JNK enhances while inhibition of p38 activity opposes GC-induced apoptosis [7]. We hypothesized that this balance of MAPK activities is more general and evaluated the relative levels of total and activated MAPKs in all five sensitizable cell lines. Each of the Dex-sensitizing treatments alters the balance between the three major MAPK signal transduction pathways as hypothesized. Total protein levels of the three MAPKs did not change, regardless of the treatment. This allowed comparison of proportions of the phosphorylated p38, ERK and JNK within each cell line (Fig. 4 and Supplementary Figure 4). In all, the proportions of JNKP and ERKP diminished while p38P levels increased after the Dex-sensitizing treatments. Figure 4A shows representative immunoblots of Ramos cell proteins after all eight treatments, analyzed for total and phosphorylated MAPK levels. The cells were extracted after a total treatment time of 24 hours, a time just prior to the onset of apoptosis. As immunoblots show, total JNK, ERK, and p38 varied little, but phosphorylated MAPK quantities varied considerably, depending on the treatments. The large pie charts below the blots show proportions of phosphorylated p-38 (p38P) and (JNKP + ERKP), averaged from three experiments. The smaller charts in 4B show the proportions of phosphorylated MAPKs for all other cell lines that became Dex-sensitive with combined treatments. In each case, the sensitizing treatments increased pro-apoptotic p38P but decreased the anti-apoptotic MAPKs, JNKP and ERKP. The myeloid lineage cell lines HL-60 and K-562 that did not undergo apoptosis as a result of the treatment regimen, were unaffected as to the distribution of ERKP, JNKP and p38P. The Fsk+Dex and the Rap+Dex treatments did not diminish the high (ERK+JNK)P levels and did not increase those of p38P. This further strengthens our hypothesis that myeloid derived cells are not dependant on the proposed interactions. In Mo, inhibiting active ERK and JNK by SP+U0 decreased their levels but no additional Dex induced decrease was observed (Supplementary Figure 3).
Fig. 4. Altered balance of JNKP, ERKP, and p38P correlates with a shift to a Dex sensitive phenotype.
A. Ramos Cells. Immunoblots from one experiment showing in alternate lanes levels of indicated components in control and variously treated extracts. Extracts prepared after 24 h drug exposure, before apoptosis begins. JNK, ERK, p38 indicate total protein of each. JNKP, ERKP, and p38P indicate phosphorylated (active) forms. Actin: loading control. Large pie charts below show average proportions of the phosphorylated forms of three such experiments (for detailed description see Methods). Labels in leftward chart identify the pattern code; labels at top indicate treatment. B. Proportions of the phospho-MAPKs in the 4 other sensitizable lines. Averages from 3 independent experiments.
3.8. Auto-induction of GR site-specific and activating phosphorylation of GR correlated with conversion to Dex sensitivity
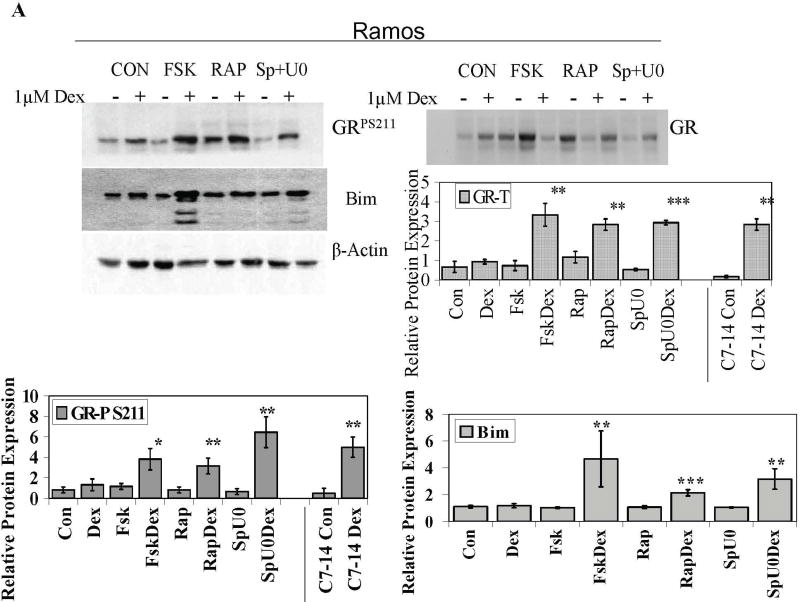
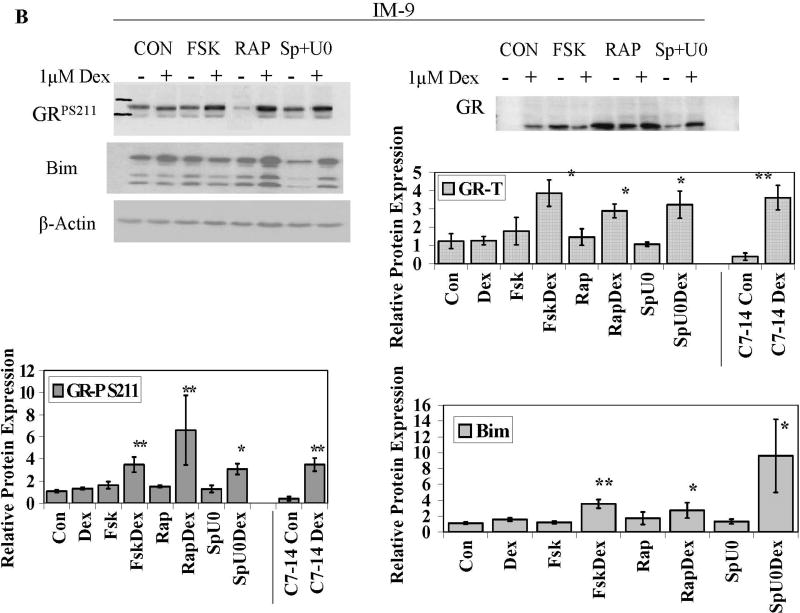
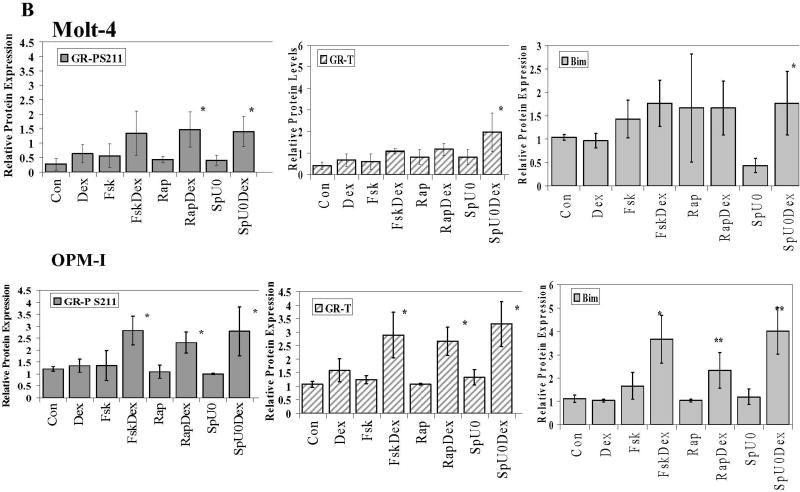
In several lymphoid systems ligand-driven transcriptional autoinduction of GR is important for GC-induced cell death [18, 19]. We tested the generality of this effect by analyzing the cell lines herein converted to be Dex-responsive. Inhibition of ERK and JNK followed by addition of Dex increased GR protein levels in all five cell lines by at least 2.5-fold. Rapamycin plus Dex increased GR protein levels by 2.2–2.7-fold in Ramos, IM-9, RPMI 8226, and OPM-I cells. All these increases were statistically significant compared to Dex or drugs only (Fig 5). In Molt-4 the average 1.7-fold increase did not reach statistical significance. Fsk plus Dex increased GR levels significantly with respect to Dex or Fsk alone in Ramos, RPMI 8226 and IM-9 and cells. In OPM-I cells, the increase reached significance with respect to Fsk alone but not to Dex-only GR levels. In Molt-4 cells, Fsk alone increased GR levels (Fig. 5). Thus there was a clear tendency for the sensitized cells to show Dex-driven induction of GR.
Fig. 5. Cells converted to GC sensitivity show Dex-driven increase in total GR, GRP S211 and Bim.
Cells from 5 cell lines were treated with the MAPK path inhibitors SP600125 (Sp) plus U0126 (U0), the mTOR inhibitor Rapamycin (Rap), or the PKA pathway stimulator Forskolin (Fsk) for 6 h, followed by Dex for an additional 18 h. Cell extracts were immunoblotted for total GR, GRP S211 (GRP) or Bim isoforms EL, L and S (Bim). A. Ramos cells. Immunoblots typical of those from all experiments are shown. A and B. Densitometric scans of blots from three independent experiments were normalized to actin and plotted in the bar graphs. Cell lines are indicated. Error bars= 1 standard deviation of the independent experiments, p value based on two tailed students t-test using Excel. * Indicates p<0.05 and ** indicates p<0.009 obtained from drug matched controls.
To cause apoptosis, the quantity of active GR and not just GR protein is critical. The phosphoprotein GR is a target of site-specific phosphorylation by p38 MAPK and GRP is involved in the apoptotic progress in CEM cells [6, 36]. Therefore we assayed for the effect of the sensitizing treatments on phosphorylation of GR S211, the critical site. Phosphorylation of S211 was identified by imunoblotting with a site-specific anti-serum to GRP S211. In every case, after treatment with sensitizing compounds, addition of Dex resulted in a 2–7 -fold increase of GRP 211 (Fig. 5A+B). These increases were all statistically significant with the sole exception of Fsk plus Dex in Molt-4 cells, wherein the 2-fold averaged increase showed too much variability. When phosphorylated, S226 of the GR has been reported to be inhibitory to GR actions in certain cells (3, 37). We therefore also checked for the effects of our treatments on S226. We found that this site also tended to be relatively more phosphorylated. Further experiments suggested that in our systems, S226P enhances rather than inhibits GR actions (data not shown). Further experiments will be required to define the cellular differences that distinguish the actions of S226. Thus, in five cell lines converted to be sensitive to Dex-driven apoptosis, Dex causes increased total and site-specific phosphorylated GR (Supplementary Figure 4).
The myeloid lines were unresponsive to treatment regimen and no increase in GRP levels or GR and Bim protein was observed, consistent with the conclusion that these cell lines do not signal for apoptosis through the GR (Supplementary Figure 3).
3.9. In sensitized cells, a Dex-dependent increase in Bim precedes apoptosis
Mounting evidence implicates the pro-apoptotic Bcl-2 family protein Bim is an important precipitating factor in GC-induced apoptosis. By gene array studies of CEM C7 cells, we discovered strong Dex-dependent induction of Bim mRNA just prior to the onset of apoptosis [10]. This was shown almost simultaneously in an independent study [21]. We hypothesized that we would find Bim increased in the Dex-resistant cell-lines converted to Dex-sensitivity. Indeed, in four out of the five cell lines, pharmacological manipulation of each of the three signaling pathways led to Dex-dependant increases in Bim. Ramos, IM-9, OPM-I and RPMI 8226 cells all displayed statistically significant increases in Bim protein levels after Dex when compared to their respective drug-treated controls (Fig.5, right-hand column of graphs and Supplementary Figure 4). Molt-4 cells were an exception and showed significant increases of Bim levels only in the SpU0/SpU0 plus Dex treatment group. Fsk or Rap alone seemed to increase Bim in these cells, though the increases were not found to be statistically significant. This exception of the pattern suggests that induction of Bim may not be the sole mechanism for Dex-dependant apoptosis.
4. Discussion
GCs such as Dex are widely used in the treatment of hematological malignancies. The presence of GR in the malignant cells is necessary but not sufficient for the steroids to evoke cell death. Too often, the cells are GR-positive but steroid resistant. Recently, studies have shown that GR function can be affected by interactions with other signal transduction pathways [1–5, 8, 16]. In the CEM cell system of closely related Dex-sensitive or Dex-resistant clones, we have shown that the MAPK and PKA pathways are deeply involved in this regulation of GR function. These pathway interconnections are most vividly revealed by treatments which can convert GR-positive but Dex-resistant CEM cells to cells that are killed by the steroid. Stimulating the PKA pathway does so [10, 38] and so does blocking the ERK/JNK pathways [7]. Armstrong et al. showed that the mTOR blocker rapamycin also converts GR-positive cells to Dex-sensitive [39] and we confirmed this and found that rapamycin also causes a reduction in phosphorylated JNK [7].
These results encouraged an examination of the generality of these effects. CEM cells are of an early T-cell lineage. We selected eight GR-positive cell lines, all resistant to Dex-evoked cell death, from various lineages. Molt-4 cells, also T-lineage, were chosen to see whether the studied effects are specific to that sub-group of cells. MoT cells, from hairy cell leukemia, represent a very specialized sub-set. B-lineage cells were represented by myeloma lines and Ramos cells derived from Burkitt’s lymphoma. Two myeloid-derived lines were found in HL-60 and K-562.
We tried to rebalance the three major MAPK paths by inhibiting ERK and JNK (anti-apoptotic in CEM cells). We blocked mTOR with rapamycin (which in CEM cells also lowers activated JNK) and we stimulated PKA by use of Fsk. Together with our collaborators we have recently shown that this also suppresses the hedgehog (Hh) pathway [16]. Consistent with results from the resistant CEM clone C1-15, all the resistant lines had very high ERK and JNK levels relative to sensitive CEM clone C7-14. Treatment with Dex alone had no effect on these or on phosphorylated ERK and JNK levels. Alone, none of the treatments caused significant cell death in the absence of steroid, although several dramatically slowed cell growth.
Each of these manipulations succeeded in conferring sensitivity to Dex-induced apoptotic death on five of the eight test lines. The two myeloid lines and the hairy cell MoT line were resistant to all treatments. We explored these known aspects of mechanisms for this shift to Dex sensitivity. First, each of the treatments shifted the ratio of phosphorylated/activated MAPKs in favor of pro-apoptotic p38P and away from anti-apoptotic JNKP / ERKP. The ratio of the phosphorylated forms seems key. Since the total immunoreactive protein protein of each MAPK remained constant, we normalized the quantity of the immunoreactive phosphorylated form to that constant and then compared the relative amounts of the phosphorylated forms. Generally, the treatments lowered the phosphor-JNK and –ERK, without much effect on p38. Thus, the relative amount of p38P increased. Second, the sensitizing treatments caused Dex to promote GR autoinduction and phosphorylation of GR at a site known to enhance the transcriptional and apoptotic actions of the receptor. We note that p38 is among the kinases that phosphorylate this site [6]. More GR favors a stronger response and greater sensitivity to a given concentration of GC [40]. Some treatments increased GR, with a constant proportion of GR S211P, whereas others resulted in increased GR and a higher fraction of S211P as well (Figs 4,5). The net result in either case was increased total GR with S211P. Third, we found that the sensitizing treatments to alter pathways influential on the GR path caused almost all the sensitized cells to respond to Dex by increasing levels of the pro-apoptotic protein Bim. Bim has been implicated repeatedly in steroid-induced apoptosis of lymphoid cells [10, 21]. The exception is instructive; Fsk or Rap alone in Molt-4 cells tended to raise Bim levels, without causing apoptosis. This suggests that Bim alone may not always be both necessary and sufficient to bring about apoptosis. Exactly how the pathways examined interact to converge in these effects will require detailed dissection of each pathway.
5. Conclusions
We conclude that several types of T- and B-lineage malignant cells can be converted from Dex-resistant to Dex-sensitive by certain pharmacological manipulations. These include suppressing ERK and JNK activity, blocking m-TOR (and suppressing JNKP) with rapamycin, and stimulating PKA. The successful conversion to Dex-sensitive results in induction of GR, at a specific phosphorylation dependant activating site, and induction of Bim. Very recently, it has been shown that activated JNK promotes Bim EL degradation [41]. Our results are consistent with this finding. Treatments that reduce JNKP enhance Dex induction of Bim. Several compounds that have these actions on the cross-talk pathways are in clinical use or trials [42, 43]. Others may be suggested by our results. We hope that these results offer encouragement to those who might envisage improved treatments for certain lymphoid malignancies.
Supplementary Material
Supplementary Figure 1.
Manipulation of three signaling pathways does not sensitize MoT cells or myeloid cells to Dex. Equal numbers of growing cells were plated in triplicate in 12-well tissue culture plates. In each experiment, the pathway-altering agents at empirically determined concentrations were added first, and after a suitable interval, Dex was added to 1 µM. Control wells (Con) received <0.1% by volume ethanol vehicle. Total, viable and nonviable (Trypan-blue stained) cells were counted (Vi-cell Counter, Beckman) 96 h after addition of Dex. Results are shown as averages from three such experiments. Error bars correspond to 1 standard deviation: upward, for non-viable cells; downward, for viable cells. Where no error bars are shown, the standard deviation fell within the margins of the bar. Error bars= 1 standard deviation of average experiments, n=3 each performed in triplicates. Treatments are labeled on the graph. (a) Mo (b) HL-60 (c) K-562.
Supplementary Figure 2.
Overt apoptosis in cells reverted to Dex sensitivity. Examples are shown of three cell lines: As a positive control, CEM-C7-14 cells were given vehicle only (1) or Dex (2) for 96 h. Below, results for Ramos and RPMI 8226 cells. Vehicle (1), Dex only (2), Fsk (3), FskDex (4), Rap (5), RapDex (6), SpU0 (7), SpU0Dex (8). Phase contrast photomicrographs of typical fields.
Supplementary Figure 3. Unchanging JNKP, ERKP, and p38P levels correlate with inability to convert to Dex sensitive phenotype and with no Dex-driven increases in total GR, GRP S211 and Bim. Cell lines were treated with the MAPK inhibitors SP600125 (Sp) plus U0126 (U0), the mTOR inhibitor Rapamycin (Rap), or the PKA pathway stimulator Forskolin (Fsk) for 6 h, followed by Dex for an additional 18 h. Immunoblots from one experiment showing in alternate lanes levels of indicated components in control and variously treated extracts. Extracts prepared after 24 h drug exposure, before apoptosis begins. JNK, ERK, p38 indicate total protein of each. JNKP, ERKP, and p38P indicate phosphorylated (active) forms. Actin: loading control. Cell extracts were immunoblotted for total GR, GRP S211 (GRP) or Bim isoforms EL, L and S (Bim).
Supplementary Figure 4. Altered balance of JNKP, ERKP, and p38P correlates with a shift to a Dex sensitive phenotype and show Dex-driven increase in total GR, GRP S211 and Bim. Immunoblots from one experiment showing in alternate lanes levels of indicated components in control and variously treated extracts. Extracts prepared after 24 h drug exposure, before apoptosis begins. JNK, ERK, p38 indicate total protein of each. JNKP, ERKP, and p38P indicate phosphorylated (active) forms. Actin: loading control. Cells from 5 cell lines were treated with the MAPK path inhibitors SP600125 (Sp) plus U0126 (U0), the mTOR inhibitor Rapamycin (Rap), or the PKA pathway stimulator Forskolin (Fsk) for 6 h, followed by Dex for an additional 18 h. Cell extracts were immunoblotted for total GR, GRP S211 (GRP) or Bim isoforms EL, L and S (Bim).
Footnotes
Publisher's Disclaimer: This is a PDF file of an unedited manuscript that has been accepted for publication. As a service to our customers we are providing this early version of the manuscript. The manuscript will undergo copyediting, typesetting, and review of the resulting proof before it is published in its final citable form. Please note that during the production process errors may be discovered which could affect the content, and all legal disclaimers that apply to the journal pertain.
References
- 1.Kyriakis JM. MAP kinases and the regulation of nuclear receptors. Sci STKE. 2000;48:1–4. doi: 10.1126/stke.2000.48.pe1. [DOI] [PubMed] [Google Scholar]
- 2.Bruna A, Nicolas M, Munoz A, Kyriakis JM, Caelles C. Glucocorticoid receptor-JNK interaction mediates inhibition of the JNK pathway by glucocorticoids. EMBO J. 2003;22:6035–6044. doi: 10.1093/emboj/cdg590. [DOI] [PMC free article] [PubMed] [Google Scholar]
- 3.Rogatsky I, Logan SK, Garabedian MJ. Antagonism of glucocorticoid receptor transcriptional activation by the c-Jun N-terminal kinase. Proc Natl Acad Sci USA. 1998;95:2050–2055. doi: 10.1073/pnas.95.5.2050. [DOI] [PMC free article] [PubMed] [Google Scholar]
- 4.Medh RD, Saeed MF, Johnson BH, Thompson EB. Resistance of human leukemic CEM-C1 cells is overcome by synergism between glucocorticoid and protein kinase A pathways: correlation with c-Myc suppression. Cancer Res. 1998;58:3684–3693. [PubMed] [Google Scholar]
- 5.Wada T, Penninger JM. Mitogen-activated protein kinases in apoptosis regulation. Oncogene. 2004;23:2838–2849. doi: 10.1038/sj.onc.1207556. [DOI] [PubMed] [Google Scholar]
- 6.Miller AL, Webb MS, Copik AJ, Wang Y, Johnson BH, Kumar R, Thompson EB. p38 MAP kinase is a key mediator in glucocorticoid-induced apoptosis of lymphoid cells: correlation between p38 MAPK activation and site-specific phosphorylation of the human glucocorticoid receptor at serine 211. Mol Endocrinol. 2005;19:1569–1583. doi: 10.1210/me.2004-0528. [DOI] [PubMed] [Google Scholar]
- 7.Miller AL, Garza SA, Johnson BH, Thompson EB. Pathway interactions between MAPKs, mTOR, PKA, and the glucocorticoid receptor in lymphoid cells. Cancer Cell International. 2007;7:3. doi: 10.1186/1475-2867-7-3. [DOI] [PMC free article] [PubMed] [Google Scholar]
- 8.Stromberg T, Dimberg A, Hammarberg A, Carlson K, Osterborg A, Nilsson K, Jernberg-Wiklund H. Rapamycin sensitizes multiple myeloma cells to apoptosis induced by dexamethasone. Blood. 2004;103:3138–47. doi: 10.1182/blood-2003-05-1543. [DOI] [PubMed] [Google Scholar]
- 9.Thompson EB. Apoptosis and steroid hormones. Mol Endocrinol. 1994;8:665–73. doi: 10.1210/mend.8.6.7935482. [DOI] [PubMed] [Google Scholar]
- 10.Medh RD, Webb MS, Miller AL, Johnson BJ, Fofanov Y, Li T, Wood TG, Luxon BA, Thompson EB. Gene expression profile of human lymphoid CEM cells sensitive and resistant to glucocorticoid-evoked apoptosis. Genomics. 2003;81:543–55. doi: 10.1016/s0888-7543(03)00045-4. [DOI] [PMC free article] [PubMed] [Google Scholar]
- 11.Zhou F, Thompson EB. Role of c-jun induction in the glucocorticoid-evoked apoptotic pathway in human leukemic lymphoblasts. Mol Endocrinol. 1996;10:306–316. doi: 10.1210/mend.10.3.8833659. [DOI] [PubMed] [Google Scholar]
- 12.Harmon JM, Eisen HJ, Brower ST, Simons SS, Jr, Langley CL, Thompson EB. Identification of human leukemic glucocorticoid receptors using affinity labeling and anti-human glucocorticoid receptor antibodies. Cancer Res. 1984;44:4540–7. [PubMed] [Google Scholar]
- 13.Koeffler HP, Golde DW, Lippman ME. Glucocorticoid sensitivity and receptors in cells of human myelogenous leukemia lines. Cancer Res. 1980;40:563–6. [PubMed] [Google Scholar]
- 14.Ashraf J, Thompson EB. Identification of the activation-labile gene: a single point mutation in the human glucocorticoid receptor presents as two distinct receptor phenotypes Molecular Endocrinology. 1993;7:631–642. doi: 10.1210/mend.7.5.8316249. [DOI] [PubMed] [Google Scholar]
- 15.Tanaka T, Okabe T, Gondo S, Fukuda M, Yamamoto M, Umemura T, Tani K, Nomura M, Goto K, Yanase T, Nawata H. Modification of glucocorticoid sensitivity by MAP kinase signaling pathways in glucocorticoid-induced T-cell apoptosis. Exp Hematol. 2006;34:1542–52. doi: 10.1016/j.exphem.2006.06.018. [DOI] [PubMed] [Google Scholar]
- 16.Ji Z, Mei FC, Johnson BH, Thompson EB, Cheng X. PKA, not EPAC, suppresses hedgehog activity and regulates glucocorticoid sensitivity in acute lymphoblastic leukemia cells. J Biol Chem. 2007;282(52):37370–7. doi: 10.1074/jbc.M703697200. [DOI] [PubMed] [Google Scholar]
- 17.Medh RD, Wang A, Zhou F, Thompson EB. Constitutive expression of ectopic c-Myc delays glucocorticoid-evoked apoptosis of human leukemic CEM-C7 cells. Oncogene. 2001;20(34):4629–4639. doi: 10.1038/sj.onc.1204680. [DOI] [PMC free article] [PubMed] [Google Scholar]
- 18.Ramdas J, Liu W, Harmon JM. Glucocorticoid-induced cell death requires autoinduction of glucocorticoid receptor expression in human leukemic T cells. Cancer Res. 1999;59:1378–85. [PubMed] [Google Scholar]
- 19.Tonko MJ, Ausserlechner D Bernhard, Helmberg A, Kofler R. Gene expression profiles of proliferating vs. G1/G0 arrested human leukemia cells suggest a mechanism for glucocorticoid-induced apoptosis. FASEB J. 2001;15(3):693–699. doi: 10.1096/fj.00-0327com. [DOI] [PubMed] [Google Scholar]
- 20.Webb MS, Miller AL, Johnson BH, Fofanov Y, Li T, Wood TG, Thompson EB. Gene networks in glucocorticoid-evoked apoptosis in leukemic cells. J Steroid Biochem Mol Biol. 2003;85(2–5):183–93. doi: 10.1016/s0960-0760(03)00194-8. [DOI] [PubMed] [Google Scholar]
- 21.Wang Z, Malone MH, He H, McColl KS, Distelhorst CW. Microarray analysis uncovers the induction of the proapoptotic BH3-only protein Bim in multiple models of glucocorticoid-induced apoptosis. J Biol Chem. 2003;278(26):23861–7. doi: 10.1074/jbc.M301843200. [DOI] [PubMed] [Google Scholar]
- 22.Katagiri S, Yonezawa T, Kuyama J, Kanayama Y, Nishida K, Abe T, Tamaki T, Ohnishi M, Tarui S. Two distinct human myeloma cell lines originating from one patient with myeloma. Int J Cancer. 1985;36(2):241–6. doi: 10.1002/ijc.2910360217. [DOI] [PubMed] [Google Scholar]
- 23.Matsuoka Y, Moore GE, Yagi Y, Pressman D. Production of free light chains of immunoglobulin by a hematopoietic cell line derived from a patient with multiple myeloma. Proc Soc Exp Biol Med. 1967;125(4):1246–50. doi: 10.3181/00379727-125-32327. [DOI] [PubMed] [Google Scholar]
- 24.Thompson EB, Nazareth LV, Thulasi R, Ashraf J, Harbour D, Johnson BH. Glucocorticoids in malignant lymphoid cells: gene regulation and the minimum receptor fragment for lysis. J Steroid Biochem Mol Biol. 1992;41(3–8):273–82. doi: 10.1016/0960-0760(92)90352-j. [DOI] [PubMed] [Google Scholar]
- 25.Helmberg A, Auphan N, Caelles C, Karin M. Glucocorticoid-induced apoptosis of human leukemic cells is caused by the repressive function of the glucocorticoid receptor. EMBO J. 1995;14(3):452–60. doi: 10.1002/j.1460-2075.1995.tb07021.x. [DOI] [PMC free article] [PubMed] [Google Scholar]
- 26.Leventhal BG. Glucocorticoid Receptors in lymphoid tumors. Cancer Res. 1981;41(11 Pt 2):4861–2. [PubMed] [Google Scholar]
- 27.Gomi M, Moriwaki K, Katagiri S, Kurata Y, Thompson EB. Glucocorticoid effects on myeloma cells in culture: correlation of growth inhibition with induction of glucocorticoid receptor messenger RNA. Cancer Res. 1990;50:1873–8. [PubMed] [Google Scholar]
- 28.Sasaki R, Mishima Y, Srivastava BI, Minowada J. Effect of Dexamethasone on the growth of human lymphoblastoid cell lines. Jpn J Med. 1982;21:89–95. doi: 10.2169/internalmedicine1962.21.89. [DOI] [PubMed] [Google Scholar]
- 29.Kontula K, Paavonen T, Vuopio P, Andersson LC. Glucocorticoid receptors in hairy-cell leukemia. Int J Cancer. 1982;30:423–6. doi: 10.1002/ijc.2910300407. [DOI] [PubMed] [Google Scholar]
- 30.Lozzio CB, Lozzio BB. Human chronic myelogenous leukemia cell-line with positive Philadelphia chromosome. Blood. 1975;45:321–34. [PubMed] [Google Scholar]
- 31.Rousseau GR, Chambon P, Amar-Coster A. Glucocorticoid-receptor-mediated stimulation of 5’ nucletidase in human lyphoblastoid IM-9 cells. FEBS Lett. 1980;121:249–252. doi: 10.1016/0014-5793(80)80354-1. [DOI] [PubMed] [Google Scholar]
- 32.Sica G, Lama G, Tartaglione R, Picarrelli L, Frati L. Effects of natural β-interferon and recombinant α-2B-interferon proliferation, glucocorticoid receptor content, and antigen expression in cultured HL-60 cells. Cancer. 1990;65:920–925. doi: 10.1002/1097-0142(19900215)65:4<920::aid-cncr2820650417>3.0.co;2-e. [DOI] [PubMed] [Google Scholar]
- 33.Sinclair AJ, Jacquemin MG, Brooks L, Shanahan F, Brimmell M, Rowe M, Farrell P. Reduced Signal Transduction through Glucocorticoid Receptor in Burkitt’s Lymphoma Cell Lines. Virology. 1994;199:338–353. doi: 10.1006/viro.1994.1132. [DOI] [PubMed] [Google Scholar]
- 34.Srivastava MD, Anderson DJ. Progesterone receptor expression by human leukocyte cell lines: molecular mechanisms of cytokine suppression. Clin Exp Obstet Gynecol. 2007;34(1):14–24. [PubMed] [Google Scholar]
- 35.Decker T, Hipp S, Ringshausen I, Bogner C, Oelsner M, Schneller F, Peschel C. Rapamycin-induced G1 arrest in cycling B-CLL cells is associated with reduced expression of cyclin D3, cyclin E, cyclin A, and survivin. Blood. 2003;101:278. doi: 10.1182/blood-2002-01-0189. [DOI] [PubMed] [Google Scholar]
- 36.Gruol DJ, Rajah FM, Bourgeouis S. Cyclic AMP-dependent protein kinase modulation of the glucocorticoid-induced cytolytic response in murine T-lymphoma cells. Mol Endocrinol. 1989;3:2119–27. doi: 10.1210/mend-3-12-2119. [DOI] [PubMed] [Google Scholar]
- 37.Itoh M, Adachi M, Yasui H, Takekawa M, Tanaka H, Imai K. Nuclear export of glucocorticoid receptor is enhanced by c-Jun N-terminal kinase-mediated phosphorylation. Mol Endocrinol. 2002;16(10):2382–2392. doi: 10.1210/me.2002-0144. [DOI] [PubMed] [Google Scholar]
- 38.Meyers JA, Taverna J, Chaves J, Makkinje A, Lerner A. Receptor in B Cell Chronic Lymphocytic Leukemia but Not in Normal Circulating Hematopoietic Cells Phosphodiesterase 4 Inhibitors Augment Levels of Glucocorticoid. Clinical Cancer Research. 2007;13:4920–4927. doi: 10.1158/1078-0432.CCR-07-0276. [DOI] [PMC free article] [PubMed] [Google Scholar]
- 39.Wei G, Twomey D, Lamb J, Schlis K, Agarwal J, Stam RW, Opferman JT, Sallan SE, den Boer ML, Pieters R, Golub TR, Armstrong SA. Gene expression-based chemical genomics identifies rapamycin as a modulator of MCL1 and glucocorticoid resistance. Cancer Cell. 2006;10(4):331–42. doi: 10.1016/j.ccr.2006.09.006. [DOI] [PubMed] [Google Scholar]
- 40.Simons SS., Jr How much is enough? Modulation of dose-response curve for steroid receptor-regulated gene expression by changing concentrations of transcription factor. Curr Top Med Chem. 2006;6(3):271–85. doi: 10.2174/156802606776173465. [DOI] [PubMed] [Google Scholar]
- 41.Leung KT, Li K, Sai-Ming Sun S, Sheung Chan PK, Eng-Choon Ooi V, Chi-Ming Chiu L. Activation of the JNK pathway promotes phosphorylation and degradation of BimEL a novel mechanism of chemoresistance in T-cell acute lymphoblastic leukemia. Carcinogenesis. 2007 doi: 10.1093/carcin/bgm294. Epub. PMID: 18174237. [DOI] [PubMed] [Google Scholar]
- 42.Davies BR, Logie A, McKay JS, Martin P, Steele S, Jenkins R, Cockerill M, Cartlidge S, Smith PD. AZD6244 (ARRY-142886), a potent inhibitor of mitogen-activated protein kinase/extracellular signal-regulated kinase kinase 1/2 kinases: mechanism of action in vivo, pharmacokinetic/pharmacodynamic relationship, and potential for combination in preclinical models. Mol Cancer Therapy. 2007;6(8):2209–19. doi: 10.1158/1535-7163.MCT-07-0231. [DOI] [PubMed] [Google Scholar]
- 43.Mita MM, Mita AC, Chu QS, Rowinsky EK, Fetterly GJ, Goldston M, Patnaik A, Mathews L, Ricart AD, Mays T, Knowles H, Rivera VM, Kreisberg J, Bedrosian CL, Tolcher AW. Phase I trial of the novel mammalian target of rapamycin inhibitor deforolimus (AP23573; MK-8669) administered intravenously daily for 5 days every 2 weeks to patients with advanced malignancies. J Clin Oncol. 2008;26(3):361–7. doi: 10.1200/JCO.2007.12.0345. [DOI] [PubMed] [Google Scholar]
Associated Data
This section collects any data citations, data availability statements, or supplementary materials included in this article.
Supplementary Materials
Supplementary Figure 1.
Manipulation of three signaling pathways does not sensitize MoT cells or myeloid cells to Dex. Equal numbers of growing cells were plated in triplicate in 12-well tissue culture plates. In each experiment, the pathway-altering agents at empirically determined concentrations were added first, and after a suitable interval, Dex was added to 1 µM. Control wells (Con) received <0.1% by volume ethanol vehicle. Total, viable and nonviable (Trypan-blue stained) cells were counted (Vi-cell Counter, Beckman) 96 h after addition of Dex. Results are shown as averages from three such experiments. Error bars correspond to 1 standard deviation: upward, for non-viable cells; downward, for viable cells. Where no error bars are shown, the standard deviation fell within the margins of the bar. Error bars= 1 standard deviation of average experiments, n=3 each performed in triplicates. Treatments are labeled on the graph. (a) Mo (b) HL-60 (c) K-562.
Supplementary Figure 2.
Overt apoptosis in cells reverted to Dex sensitivity. Examples are shown of three cell lines: As a positive control, CEM-C7-14 cells were given vehicle only (1) or Dex (2) for 96 h. Below, results for Ramos and RPMI 8226 cells. Vehicle (1), Dex only (2), Fsk (3), FskDex (4), Rap (5), RapDex (6), SpU0 (7), SpU0Dex (8). Phase contrast photomicrographs of typical fields.
Supplementary Figure 3. Unchanging JNKP, ERKP, and p38P levels correlate with inability to convert to Dex sensitive phenotype and with no Dex-driven increases in total GR, GRP S211 and Bim. Cell lines were treated with the MAPK inhibitors SP600125 (Sp) plus U0126 (U0), the mTOR inhibitor Rapamycin (Rap), or the PKA pathway stimulator Forskolin (Fsk) for 6 h, followed by Dex for an additional 18 h. Immunoblots from one experiment showing in alternate lanes levels of indicated components in control and variously treated extracts. Extracts prepared after 24 h drug exposure, before apoptosis begins. JNK, ERK, p38 indicate total protein of each. JNKP, ERKP, and p38P indicate phosphorylated (active) forms. Actin: loading control. Cell extracts were immunoblotted for total GR, GRP S211 (GRP) or Bim isoforms EL, L and S (Bim).
Supplementary Figure 4. Altered balance of JNKP, ERKP, and p38P correlates with a shift to a Dex sensitive phenotype and show Dex-driven increase in total GR, GRP S211 and Bim. Immunoblots from one experiment showing in alternate lanes levels of indicated components in control and variously treated extracts. Extracts prepared after 24 h drug exposure, before apoptosis begins. JNK, ERK, p38 indicate total protein of each. JNKP, ERKP, and p38P indicate phosphorylated (active) forms. Actin: loading control. Cells from 5 cell lines were treated with the MAPK path inhibitors SP600125 (Sp) plus U0126 (U0), the mTOR inhibitor Rapamycin (Rap), or the PKA pathway stimulator Forskolin (Fsk) for 6 h, followed by Dex for an additional 18 h. Cell extracts were immunoblotted for total GR, GRP S211 (GRP) or Bim isoforms EL, L and S (Bim).


