

Abstract
Insulin resistance is a homeorhetic adaptation to parturition in dairy cows transitioning from late pregnancy to early lactation. An increase in prepartum adiposity can predispose periparturient cows to greater lipolysis and insulin resistance, thus increasing the risk for metabolic disease. Mechanisms mediating the development of insulin resistance in overweight peripartal dairy cows may depend on ceramide metabolism. The sphingolipid ceramide accumulates in plasma and tissues of overweight monogastric animals, and facilitates saturated fatty acid-induced insulin resistance. Considering this evidence, we hypothesized that plasma ceramides would be elevated in periparturient dairy cattle and that these sphingolipids would correlate with the magnitude of lipolysis and insulin resistance. To test our central hypothesis, multiparous Holstein cows were allocated into 2 groups according to their body condition score (BCS) at d −30 prepartum: lean (BCS <3.0; n = 10) or overweight (BCS >4.0; n = 11). Blood samples were collected at d −45, −30, −15, and −7, relative to expected parturition, and at d 4 postpartum. Plasma glucose, insulin, nonesterified fatty acids (NEFA), and β-hydroxybutyrate (BHBA) concentrations were measured, and insulin sensitivity was estimated. The concentrations of individual plasma ceramide and glycosylated ceramide were determined using liquid chromatography-based mass spectrometry. Results demonstrated that greater adiposity was associated with a greater loss in body condition during late pregnancy. Overweight cows had greater circulating concentrations of glucose, insulin, and NEFA, and lower insulin sensitivity relative to lean cows. We detected 30 different sphingolipids across 6 lipid classes with acyl chains ranging from 16 to 26 carbons. The most abundant plasma sphingolipids detected were C24:0-ceramide, C24:0-monohexosylceramide, and C16:0-lactosylceramide. Plasma concentrations of total ceramide and monohexosylceramide increased as lactation approached, and saturated ceramide and monohexosylceramide were elevated in cows with greater adiposity relative to those with a lean phenotype. Plasma ceramides (e.g., C24:0-ceramide) were positively correlated with plasma NEFA and inversely correlated with insulin sensitivity. Our data demonstrate a remodeled plasma sphingolipidome in dairy cows transitioning from late pregnancy to lactation characterized by a concomitant increase in plasma ceramides with the development of peripartal insulin resistance.
Keywords: ceramide, insulin resistance, periparturient dairy cow
INTRODUCTION
Periparturient dairy cows experience an elevated demand for glucose due to an increased requirement by the mammary gland for lactose synthesis (Bell, 1995). Dairy cattle transitioning from late pregnancy to early lactation develop insulin resistance (Bell and Bauman, 1997) as a metabolic adaptation to energy deficit. Insulin resistance facilitates an increase in hepatic gluconeogenesis and a decrease in glucose uptake by skeletal muscle and adipose tissue (Bell, 1995; Spachmann et al., 2013). Consequently, circulating glucose is spared for lactose synthesis, a major osmotic regulator of milk secretion. To increase NEFA availability for β-oxidation in peripheral tissues and re-esterification in the mammary gland, the periparturient dairy cow mobilizes triacylglycerol stores in adipose tissue (Drackley et al., 2005; Drackley and Andersen, 2006). Because insulin is an antilipolytic hormone, insulin resistance can further increase adipose tissue lipolysis (Pires et al., 2007a,b). Collectively, the transition dairy cow adapts to energy insufficiency by modifying peripheral insulin action to augment glucose economy.
An increase in prepartum adiposity can predispose dairy cows to a greater magnitude of insulin resistance during early lactation (Holtenius et al., 2003; Holtenius and Holtenius, 2007). The greater extent of insulin resistance in overweight peripartal dairy cows can contribute to excessive adipose tissue lipolysis and thus greater metabolic disease risk (e.g., hepatic steatosis and ketosis). Although insulin resistance in dairy cattle transitioning from pregnancy to lactation is mediated in part by growth hormone (Bell and Bauman, 1997), considerable evidence supports a causative role of long-chain saturated fatty acids as antagonists of whole-body insulin sensitivity (Boden, 1997; Funaki, 2009). The ability of surplus saturated fatty acyl-CoA to inhibit insulin action appears to be mediated by the structurally diverse sphingolipid ceramide (Chavez and Summers, 2012).
Although ceramides were previously believed to be merely structural elements of cell membranes, recent discoveries demonstrate that ceramides are directly implicated in evolutionarily conserved cellular processes, such as cell cycle arrest, apoptosis, and stress responses (Hannun and Obeid, 2008). Ceramides can be (1) formed by de novo synthesis initiated by the condensation of palmitoyl-CoA via action of serine palmitoyltransferase, (2) formed by hydrolysis of sphingomyelin by either acid or neutral sphingomyelinases, or (3) salvaged from complex sphingolipids that are broken down into sphingosine and reacylated (Figure 1; Hirabayashi et al., 2006). An increase in palmitoyl-CoA availability upregulates de novo ceramide synthesis and sphingomyelin hydrolysis in peripheral tissues of obese insulin resistant mice with hepatic steatosis, responses that contribute to ceramide accumulation in tissues and plasma (Cuschieri et al., 2007; Holland et al., 2011).
Figure 1.

Metabolic pathways of ceramide synthesis. Ceramide can be generated by 3 pathways: de novo synthesis initiated by the condensation of palmitoyl-CoA and serine to form 3-ketosphinganine; hydrolysis of sphingomyelin; or breakdown of complex sphingolipids via a series of reactions referred to as the salvage pathway. Complex sphingolipids have various acyl chain lengths varying in carbon length and degree of saturation. For simplicity, only C16:0-linked sphingolipids and glycosphingolipids are illustrated. Monohexosylceramides consist of a single sugar residue, either glucose or galactose (galactosylceramide is not shown).
The extent of insulin resistance correlates with the concentrations of ceramide in plasma collected from obese humans with type 2 diabetes, most notably C24:0-ceramide, which is the most abundant ceramide species in human circulation (Haus et al., 2009). Plasma ceramide is transported as components of low-density lipoproteins (LDL) of hepatic origin that contribute to the pathophysiology of whole-body insulin resistance. Although the mechanisms are not completely understood, an increase in the level of LDL enriched with C24:0-ceramide decreases whole-body and skeletal muscle glucose uptake in lean mice, a response accompanied by C24:0-ceramide accrual in the plasma membrane and reduced insulin-stimulated protein kinase B phosphorylation (Boon et al., 2013). The effect of endogenous, long-chain plasma ceramide on lipolysis are not known; however, culturing 3T3-L1 adipocytes with exogenous hydrophilic C2:0-ceramide can increase lipolysis by suppressing insulin-stimulated activation of cyclic nucleotide phosphodiesterase 3B (Mei et al., 2002). The inhibitory effect of ceramide on insulin signaling is ameliorated by treatments that decrease de novo ceramide synthesis (e.g., reducing palmitic acid availability or pharmacological inhibition; Mei et al., 2002; Holland et al., 2007; Ussher et al., 2010).
Although the link between NEFA mobilization and metabolic disease has been extensively studied (Drackley and Andersen, 2006), the relationship between circulating ceramides, lipolysis, and insulin sensitivity has not been defined. Considering the recognized association between lipotoxicity-induced ceramide accumulation in plasma and the development of insulin resistance in overweight monogastric animals, we hypothesized that plasma ceramide concentrations would increase concomitantly with NEFA availability and the decline in insulin sensitivity characteristic of the ruminant dairy cow transitioning from late pregnancy to early lactation. We further hypothesized that overweight peripartal cows would exhibit greater concentrations of ceramide in plasma and magnitude of insulin resistance compared with lean cows. To test our hypotheses, we used liquid chromatography coupled with mass spectrometry to perform a sphingolipidomic analysis of plasma ceramides and glycosylated ceramides, an approach described by Merrill et al. (2009).
MATERIALS AND METHODS
Experimental Design
Experimental procedures were approved by the West Virginia University Institutional Animal Care and Use Committee (Morgantown). The experiment was completed at Dovan Farms, WVU Agricultural Research and Education Partner, and a 700-Holstein cow commercial dairy farm (located in Berlin, PA). Nonlactating, pregnant, multiparous Holstein cows (n = 21) were enrolled in the study 45 d before expected parturition and allocated to 1 of 2 groups according to their adiposity at d −30 relative to calving, as either lean (BCS 2.9 ± 0.22, n = 10) or overweight (BCS 4.1 ± 0.10, n = 11). Parity was not different between BCS groups (P > 0.9), averaging 3.5 ± 0.82 and 3.45 ± 1.08 for lean and overweight cows, respectively. Diets were formulated to meet nutrient recommendations and cows were fed once and twice daily during pregnancy and lactation, respectively. All diets were fed for ad libitum intake with free access to water. Ingredient and nutrient compositions of the diets fed during the experiment are shown in Table 1. Samples of TMR were obtained weekly throughout the experiment, and DM content was determined by drying at 60°C until a static weight was observed. Weekly TMR samples were submitted to a commercial laboratory for nutrient composition analysis by near-infrared spectroscopy (Cumberland Valley, Cumberland, MD; AOAC International, 1995; method 989.03).
Table 1.
Ingredients and nutrient composition (% of DM unless otherwise noted) of diets fed to lean and overweight cows during the transition from late pregnancy to early lactation
| Diet
|
|||
|---|---|---|---|
| Item | d −60 to −21 | d −21 to parturition | Lactation |
| Ingredient | |||
| Corn silage | 32.2 | 30.7 | 42.4 |
| Mixed grass haylage | 29.8 | 28.4 | 7.0 |
| Mixed grass hay | 13.9 | 13.2 | 2.1 |
| Dry ground corn | — | 14.4 | |
| Prepartum mix1 | 14.7 | 13.9 | — |
| Lactation mix A2 | — | — | 14 |
| Aminoplus | 9.4 | 9.0 | 4.7 |
| Cottonseed with lint | — | — | 4.5 |
| Sugar cane syrup | — | — | 3.6 |
| Lactation mix B3 | — | — | 4.5 |
| Close-up supplement4 | — | 4.8 | 2.7 |
| Rumensin5 | — | — | 0.1 |
| Nutrient composition | |||
| DM, % | 49.1 | 49 | 47.4 |
| NDF | 48 | 49 | 33.4 |
| Forage NDF | 42.8 | 43.7 | 25.1 |
| Forage NDF, % of NDF | 89.2 | 89.2 | 75.3 |
| ADF | 32 | 32.5 | 21.4 |
| CP | 12.3 | 12.2 | 16.5 |
| Starch | 15 | 14.7 | 24.8 |
| Crude fat | 3.1 | 3.4 | 4.4 |
| Ash | 7.4 | 7.5 | 7.6 |
Mix contained 27% commercial dry cow mix with Animate (Phibro Animal Health Corp., Teaneck, NJ), 17.3% ground corn, 17.3% crimped oats, 13% corn distillers, 12.9% soybean meal, 4.3% calcium carbonate, 4.3% calcium sulfate, 2.6% Omnigen AF (Phibro Animal Health Corp.), 1.1 Monocalcium phosphate, and < 1% of each of the following: Sel-plex 600 (Alltech Biotechnology, Nicholasville, KY) and vitamin E.
Mix contained 33.6% citrus pulp, 19% soybean meal. 15.6% canola meal, 14% soybean hulls, 4.5% calcium carbonate, 4.5% sodium bicarbonate, 2.8% urea, 2.7% fat, 2.4% sodium chloride, and <1% from each of the following: Monocalcium phosphate, biotin, and Rumensin 90 (Elanco Animal Health, Greenfield, IN).
Mix contained 43.6% Fermenten (Church and Dwight Co., Princeton, NJ), 21.8% calcium carbonate, 10.8% soybean hulls, 7.8% Mintrex blend (Novus International Inc., St. Charles, MO), 5.2% blood meal, 3.5% magnesium oxide, 2.6% Celmanax (Vi-COR, Mason City, IA), 2.6% Omnigen (Phibro Animal Health Corp.), and <1% of each of the following: vitamin E, selenium selenite, and selenium yeast 600.
Mix contained 74.5% ground oats, 15.3% commercial amino acid, 8% Reashure (Balchem Encapsulates, Slate Hill, NY), and <1% of each of the following: vitamin E and Niashure (Balchem Corporation, New Hampton, NY).
Rumensin for dairy included at 4,890 mg/kg.
Body weights and BCS were recorded weekly. Three trained investigators independently recorded BCS for all cows and data were averaged for each cow at d −45, −30, −15, −7, 4, 14, and 21 relative to expected parturition, postpartum using a 1.0 to 5.0 scale (Wildman et al., 1982). Blood samples (10 mL) were collected by coccygeal venipuncture at d −45, −30, −15, −7, and 4 relative to expected parturition. Blood was kept on ice for 30 min until centrifugation at 3,400 × g for 10 min. Following centrifugation, plasma was removed and snap-frozen in liquid nitrogen and then stored at −80°C until further analysis. Milk production was recorded from d 2 to 21 postpartum. Milk samples were collected at d 4 and 10 postpartum, preserved using Bronopol tablets (D&F Control Systems, San Ramon, CA), and stored at 4°C for milk component analysis.
Plasma samples were analyzed for glucose, insulin, NEFA, BHBA, and ceramides. Plasma concentrations of glucose, NEFA, and BHBA were determined by enzymatic methods using commercial kits (Autokit Glucose, HR Series NEFA-HR (2) and Autokit 3-HB, respectively; Wako Chemicals USA Inc., Richmond, VA). Plasma concentrations of insulin were determined by ELISA using a commercial product (Mercodia Bovine Insulin ELISA; Mercodia AB, Uppsala, Sweden). All spectrophotometric measurements were conducted using a SpectraMax Plus 384 Microplate Reader (Molecular Devices, Sunnyvale, CA). Intra- and interassay CV were 3.8 and 3.0%, 2.6 and 7.7%, 2.3 and 9.5%, and 3.7 and 16.6%, for glucose, NEFA, BHBA, and insulin, respectively. Individual milk samples were analyzed for fat, true protein, and lactose concentrations and SCC by mid-infrared spectroscopy (Dairy One, Ithaca, NY; AOAC, 1990; method 972.160) within 1 wk of collection.
Ceramide Measurements
Plasma extraction was conducted using a modified Bligh and Dyer procedure including ceramide C12:0 as an internal standard (Avanti Polar Lipids, Alabaster, AL; Haughey et al., 2004; Bandaru et al., 2013). Plasma extracts were dried using a nitrogen evaporator and resuspended in pure methanol for analysis. Sample extracts were handled using an autosampler (Leap Technologies Inc., Carrboro, NC) that introduced extracts into an HPLC (PerkinElmer, Boston, MA) with a C18 reverse-phase column (Phenomenex, Torrance, CA). Individual species of ceramide were separated by gradient elution and injected into an electrospray ion source coupled to a triple quadrupole mass spectrometer (API3000; AB Sciex Inc., Thornhill, ON, Canada; Bandaru et al., 2007, 2011, 2013). Ion spray voltage was 5,500 V at a temperature of 80°C with a nebulizer gas of 8 psi, curtain gas 8 psi, and collision gas 4 psi. Declustering potential was 80 V, focusing potential 400 V, entrance potential 10 V, collision energy 30 V, and collision cell exit potential 18 V. Individual ceramide species were detected by multiple reaction monitoring. Six-point calibration curves (0.1 to 750 ng/mL) were constructed by plotting the area under the curve for each calibration standard, C16:0-, C18:0-, C20:0, C22:0-, and C24:0-ceramide, normalized to C12:0-ceramide. Sphingolipid concentrations were determined by curve fitting the identified ceramide species based on acyl-chain length. Quantification of spectral data was performed using Analyst 1.4.2 and MultiQuant software (AB Sciex Inc.).
Calculations and Statistical Analysis
Plasma glucose, insulin, NEFA, and BHBA concentrations were measured, and insulin sensitivity was estimated using the revised quantitative insulin sensitivity check index (RQUICKI; Holtenius and Holtenius, 2007), where RQUICKI = 1/[log (glucose) + log (insulin) + log (NEFA)], and glucose = basal glucose (mg/dL), insulin = basal insulin (μU/mL), and NEFA = basal NEFA (mmol/L), such that lower RQUICKI values suggest reduced whole-body insulin sensitivity, and higher values are indicative of elevated whole-body insulin sensitivity. Changes in BCS and BW of lean and overweight cows were calculated as the differences between values at d −21 and −7, and the differences between d 4 and 21, relative to parturition. Somatic cell score was calculated from SCC for statistical analysis, using the following logarithmic transformation (Ali and Shook, 1980), where SCS = Log2 (SCC/100,000) + 3.
Changes in BCS and BW pre- and postpartum were analyzed using the GLM procedure of SAS (version 9.3; SAS Institute Inc., Cary, NC). All data for plasma and milk variables were analyzed as repeated measures over time relative to parturition under the MIXED procedure of SAS (SAS Institute Inc.). The statistical model included the random effect of cow nested within BCS and the fixed effects of BCS, day relative to parturition, and their interaction. The most appropriate covariance structure for the repeated-measures analysis was selected for each variable after evaluating 7 different covariance structures (variance components, first-order autoregressive, heterogeneous first-order autoregressive, compound symmetry, heterogeneous compound symmetry, first-order ante-dependence, and unstructured), and the structure with the smallest Akaike’s information criterion coefficient was selected for analysis. Modeling of the covariance structure allowed the identification of patterns that best describe relationships between the repeated measures in the model. The method of Kenward-Roger was used for calculation of denominator degrees of freedom. Preplanned contrasts were used to evaluate differences between lean and overweight cows at each time point. Relationships between select ceramides were evaluated by random regression, using the MIXED procedure of SAS (SAS Institute Inc.). The full model included the random effect of cow and the linear and quadratic effects of each predictor. Quadratic effects were removed from the model based on fit by Akaike’s information criterion scores when P > 0.05. Denominator degrees of freedom were calculated by the Satterthwaite method. Studentized residual values >3.0 or < −3.0 were considered outliers and removed from the analysis (typically 1 per response variable). Nonparametric Spearman rank-order correlations were performed to determine associations between plasma sphingolipids and NEFA levels, and between sphingolipids and RQUICKI values. All results are expressed as least squares means and their standard errors, unless stated otherwise. Significance was declared at P < 0.05 and trends at P < 0.10.
RESULTS AND DISCUSSION
Overweight dairy cows transitioning from late pregnancy to early lactation will mobilize more adipose to meet energy demands than lean cows (Rukkwamsuk et al., 1999). To validate this response, BCS and BW were evaluated in lean and overweight transition cows (Figure 2). Cows that were overweight experienced accelerated BCS loss (P < 0.01) and tended to lose more BW (P = 0.10) during late pregnancy; however, no differences in the rate of BCS or BW loss were detected during lactation (data not shown). Milk yield increased during early lactation but was not affected by BCS (29.4 ± 1.2, 37.5 ± 1.0, 39.3 ± 1.0 and 42.1 ± 1.1 kg/d, for 4, 10, 14 and 21 DIM, respectively; P < 0.001). Although no change was observed for milk fat or lactose yield, a tendency for a BCS × day relative to parturition interaction was found for increased milk protein yield in overweight cows at 10 DIM (1.38 vs. 1.15 kg/d; P = 0.06). No significant response was detected for SCS; however, overweight cows tended to have an elevated SCS at 10 DIM relative to lean cows (2.27 vs. 1.86, respectively; P = 0.10)—a potential indicator of compromised mammary gland immune function.
Figure 2.

(A) Timeline of BCS records during the transition from late pregnancy to early lactation; (B) changes in BCS prepartum; and (C) changes in BW prepartum. Changes in BCS and BW prepartum correspond to the difference between values recorded at d −30 and −7 relative to parturition. Overweight dairy cows lost more prepartum body condition and BW, relative to lean cows. Data are represented as least squares means and their standard errors. *P < 0.05; †P < 0.10.
In overweight humans, elevated plasma concentrations of glucose, insulin, and NEFA are markers associated with the development of insulin resistance, hallmark characteristics of type 2 diabetes (Reaven et al., 1988; Thévenod, 2008). Comparably, Holtenius and Holtenius (2007) demonstrated a negative linear relationship between adiposity and RQUICKI (i.e., cows with a high BCS have a low RQUICKI value), an observation supported by reduced glucose disappearance following a glucose tolerance test in overweight cows (Holtenius et al., 2003; Jaakson et al., 2013). For validation, we measured the plasma concentrations of glucose, insulin, and NEFA, and calculated RQUICKI values for lean and overweight cows during the transition from pregnancy to lactation (Figure 3). Compared with lean cows, plasma glucose concentrations were greater in overweight animals at d −15 and −7 relative to parturition (P < 0.05). Insulin concentrations were higher in overweight cows at d −30 and −15 (P < 0.01), and tended to be greater at d 4 (P = 0.06). A progressive decline in plasma insulin concentrations was observed, being 25 and 55% lower at d −7 and 4, respectively, relative to d −30 (P < 0.001). Plasma NEFA concentrations increased by 30, 149, and 321% on d −15, −7 and 4, respectively, relative to d −30 (P < 0.001). As expected, overweight cows had higher NEFA concentrations at d −15 (P < 0.05), and tended to be higher at d −7 and 4 relative to parturition (P = 0.06). The observed increase in plasma NEFA and decrease in plasma insulin at the onset of lactation are characteristic homeorhetic adaptations to maximize milk synthesis, responses linked with lower voluntary energy intake (Drackley et al., 2005). These physiological changes were associated with lower RQUICKI values postpartum (P < 0.001), indicative of reduced insulin sensitivity. Specifically, RQUICKI decreased by 8, 15, and 14% on d −15, −7, and 4, respectively, relative to d −30 (P < 0.001). Compared with lean cows, insulin sensitivity was significantly lower at d −30, −15, −7 and 4 relative to parturition (P < 0.05). We also observed lower RQUICKI values in dairy cattle with greater adiposity as early as d −45 (P = 0.07), a pathological response that preceded prepartum elevations in plasma glucose, insulin, and NEFA. The observed reductions in prepartum insulin sensitivity may relate to antagonism of adipose tissue insulin signal transduction by saturated fatty acids in overweight cows (Boden, 1997), an action that could explain the observed acceleration in adipose tissue NEFA mobilization. Plasma concentrations of BHBA were not affected by BCS; however, BHBA was 40% higher at d 4 relative to d −30 (465 vs. 333 μmol/L, respectively; P < 0.01).
Figure 3.
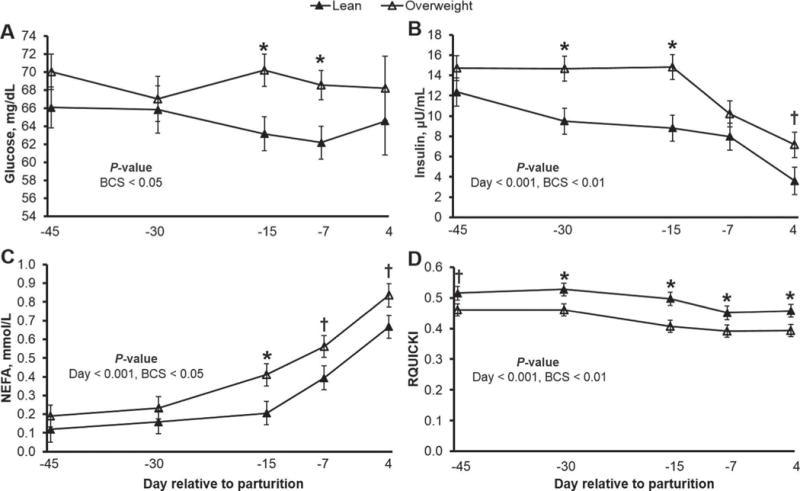
Plasma concentrations of (A) glucose, (B) insulin, and (C) NEFA, of lean and overweight dairy cattle transitioning from late pregnancy to early lactation; (D) estimated insulin sensitivity as measured by the revised quantitative insulin sensitivity check (RQUICKI), where RQUICKI was calculated as follows: 1/[log(glucose) + log(insulin) + log(NEFA)]. Lower RQUICKI values are indicative of reduced insulin sensitivity. Overweight dairy cows are insulin resistant before onset of lipolysis. Data are least squares means and their standard errors. *P < 0.05; †P < 0.10.
The acyl chain specificity of 6 dihydroceramide synthases produces structurally diverse sphingolipids (Park and Pewzner-Jung., 2013). To elucidate the structural diversity of ceramide and glycosylated ceramide in dairy cows, we used liquid chromatography coupled with mass spectrometry to separate 30 plasma species by acyl chain length including long-chain ceramides, monohexosylceramides, and lactosylceramides, as well as a limited number of dihydro species (Figure 4). Similar to humans and rodents (Ichi et al., 2006; Haus et al., 2009), C16:0- and C24:0-ceramide were the most abundant plasma ceramides, representing 30 and 58% of total ceramide, respectively, across lean and overweight cows. Similarly, C24:0-monohexosylceramide and C16:0-lactosylceramide represented the major plasma monohexosylceramide and lactosylceramide species, respectively. In humans, approximately 98% of plasma ceramides are found within liver-derived lipoprotein subfractions (i.e., high, low, and very low density lipoproteins; Lightle et al., 2003; Boon et al., 2013); however, the origin of ceramides over time and between BCS groups in this study is unknown and will require further definition.
Figure 4.

Plasma composition of (A) ceramides, (B) monohexosylceramides, and (C) lactosylceramides in lean and overweight dairy cows transitioning from late pregnancy to early lactation (d −30 to 4 relative to parturition). C16:0-dihydroceramide, C16:0-dihydro-monohexosylceramide, and C16:0-dihydro-lactosylceramide are not included; C16:0- and C24:0-ceramide are the high-abundant ceramides in bovine plasma. Data presented as mean abundance ± SD.
Measurement of plasma ceramides can be a means to diagnose the severity of insulin resistance in humans experiencing hyperlipidemia and nonalcoholic fatty liver disease (Haus et al., 2009). Therefore, we compared the plasma ceramide and glycosylated ceramide profiles with the development of insulin resistance in lean and overweight dairy cows (Figure 5). Plasma concentrations of total ceramide increased as parturition approached (Figure 6); however, these responses were accelerated in dairy cows exhibiting greater adiposity, NEFA mobilization, and magnitude of insulin resistance. Of interest, plasma C24:0-ceramide, the most abundant ceramide in bovine plasma, increased by 92% on d 4 relative to d −30 (P < 0.001; Figure 7), and tended to be greater in overweight cows at d −7 (P = 0.09). Concentrations of C18:0-, C18:1-, C20:0-, C22:0, C22:1, and C24:1-ceramide were also significantly greater in overweight cows during the peripartal period (P < 0.05; Supplemental Figure S1; http://dx.doi.org/10.3168/jds.2015-9519), relative to lean cows, and C26:0- and C26:1-ceramide concentrations tended to be increased in overweight dairy cows on d 4 and d −15, respectively, relative to d −30 (P = 0.06). In contrast, plasma C16:0-ceramide concentrations did not change with time or score of adiposity (Figure 7). Because palmitic acid is a required substrate for de novo synthesis of all sphingolipids including ceramides, glycosylated ceramides, and sphingomyelins (i.e., palmitic acid is part of the sphingoid backbone), palmitic acid availability may have been limited for C16:0-ceramide synthesis in overweight cows.
Figure 5.
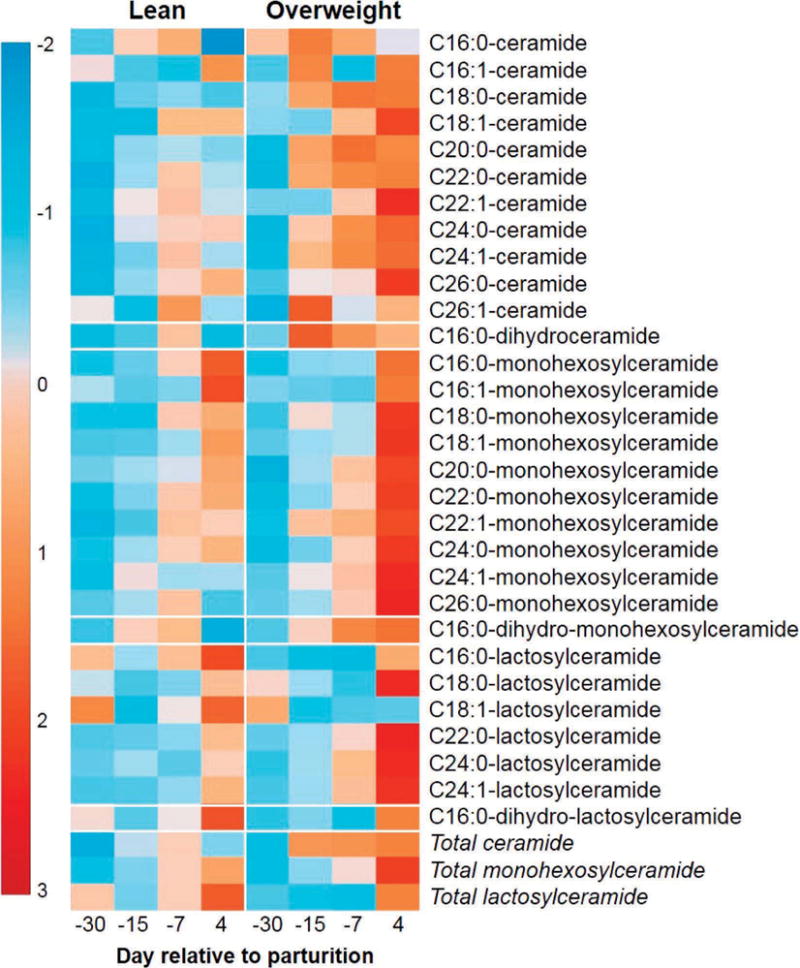
For visualization purposes, the heat map represents the magnitude of mean-centered, fold change increases (red) or decreases (blue) for each sphingolipid or glycosphingolipid, relative to lean cows sampled at d −30 prepartum. Comparisons should be made within metabolite. Plasma ceramides, monohexosylceramides, and lactosylceramides are elevated in overweight dairy cows transitioning from gestation to lactation. The heat map was generated using MetaboAnalyst 2.0 (Xia et al., 2012).
Figure 6.

Plasma concentrations (ng/mL) of total (A) ceramide, (B) monohexosylceramide, and (C) lactosylceramide in lean and overweight peripartal dairy cows. Data are represented as least squares means and their standard errors. *P < 0.05.
Figure 7.
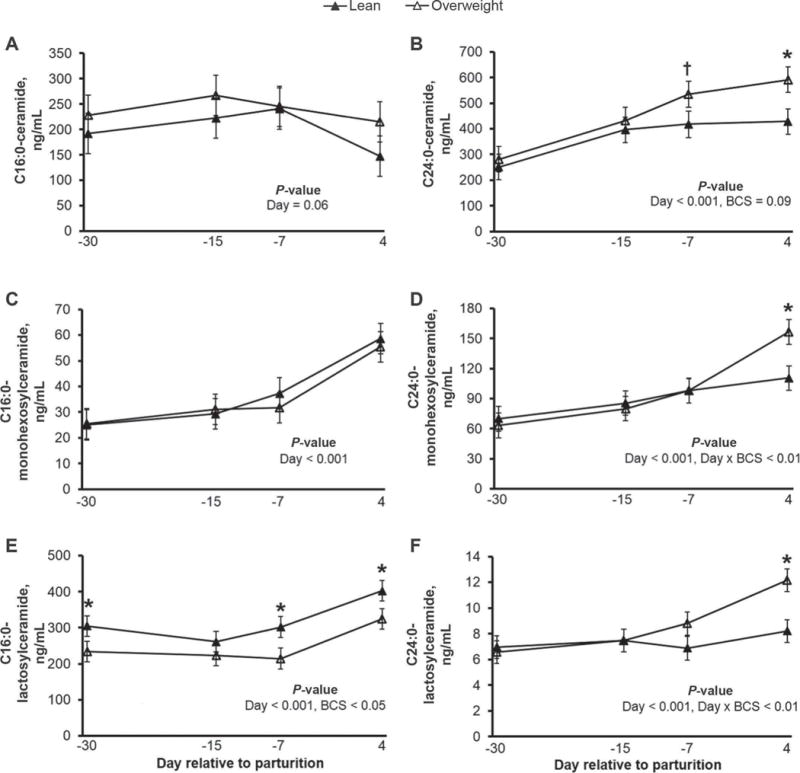
Plasma concentrations (ng/mL) of (A) C16:0-ceramide, (B) C24:0-ceramide, (C) C16:0-monohexosylceramides, (D) C24:0-monohexosylceramide, (E) C16:0-lactosylceramide, and (F) C24:0-lactosylceramide in lean and overweight transition dairy cows. Plasma concentrations of C24:0-linked ceramide, monohexosylceramide, and lactosylceramide were elevated in overweight cows transitioning from late pregnancy to early lactation, relative to lean cows. Data are represented as least squares means and their standard errors. *P < 0.05; †P < 0.10.
De novo synthesis of ceramide is contingent on the fatty acyl-CoA-dependent acylation of sphinganine to form dihydroceramide, a reaction mediated by dihydroceramide synthase. We measured one dihydroceramide in bovine plasma, C16:0-dihydroceramide (Supplemental Figure S2; http://dx.doi.org/10.3168/jds.2015-9519). Plasma C16:0-dihydroceramide tended to be greater in overweight cows at d −15 (+47%; P = 0.07). The elevated concentration of plasma C16:0-dihydroceramide is indicative of increased ceramide anabolism in tissues of dairy cows transitioning from pregnancy to lactation. We also detected a significant positive association between plasma C16:0-dihydroceramide and C16:0-ceramide across all sampled cows (P < 0.001; Supplemental Figure S3; http://dx.doi.org/10.3168/jds.2015-9519). The strong relationship between these sphingolipids may be explained by enhanced activity of hepatic dihydroceramide desaturase in transition dairy cows; however, additional research is needed to confirm this hypothesis.
Glycosylated ceramides include monohexosylceramides (e.g., glucosylceramide and galactosylceramide) and lactosylceramides, glycosphingolipids synthesized from ceramide and precursors for monosialodihexosylganglioside synthesis (GM3, a ganglioside; Figure 1). Similar to ceramide, monohexosylceramide levels are elevated in plasma from obese, insulin-resistant rodents (Chavez et al., 2014). To determine whether a similar relationship exists in overweight dairy cows, we profiled these plasma glycosphingolipids (Figures 5, 6, and 7 and Supplemental Figures S4 and S5; http://dx.doi.org/10.3168/jds.2015-9519). Subsequent to the prepartum increases in plasma ceramides, we detected an increase in the concentrations of most plasma monohexosylceramides in overweight cows postpartum (Figure 5). These results were expected because monohexosylceramide synthesis is contingent on ceramide availability (Figure 1). For example, as plasma NEFA and ceramide levels increased with time, the concentration of C24:0-monohexosylceramide (the most abundant plasma monohexosylceramide) increased (P < 0.001; Figure 7). Relative to adiposity, plasma C24:0-monohexosylceramide was elevated in overweight cows at d 4 postpartum (BCS × day relative to parturition, P < 0.01). Similar observations were observed for C24:0-lactosylceramide. Furthermore, we observed a strong positive association between C24:0-ceramide and C24:0-monohexosylceramide, and between C24:0-monohexosylceramide and C24:0-lactosylceramide across all sampled cows (Figure 8). These results may indicate a coordinated regulation of synthesis for these sphingolipids containing the C24:0 acyl moiety in transition dairy cow tissues. In contrast to total ceramide and monohexosylceramide, total lactosylceramide concentrations were not modified with enhanced adiposity (Figure 6); however, C16:0-lactosylceramide (the most abundant plasma lactosylceramide) concentrations were lower in overweight cows compared with lean cows (P < 0.01).
Figure 8.

Random regression analysis between plasma concentrations of (A) C24:0-ceramide and C24:0-monohexosylceramide, and (B) C24:0-monohexosylceramide and C24:0-lactosylceramide in lean and overweight dairy cows during the transition from late pregnancy to early lactation. Coefficients of determination (R2) represent the association between observed and model predicted values when accounting for the random effect of cow. Plasma C24:0-ceramide was positively associated with C24:0-monohexosylceramide, and C24:0-monohexosylceramide was positively associated with C24:0-lactosylceramide. Data represent measurements for d −30, −15, −7, and 4 relative to parturition.
Increased circulating NEFA can promote insulin resistance by promoting ceramide accumulation in plasma and peripheral tissues of humans and rodents (Watt et al., 2012). Considering that NEFA can induce insulin resistance in dairy cows (Pires et al., 2007a), we hypothesized that plasma ceramide concentrations would increase concomitantly with NEFA availability and the development of insulin resistance. To test this hypothesis, we performed a Spearman correlation analysis to identify significant correlations between individual sphingolipid species, and NEFA levels or RQUICKI values (Figure 9). As expected, NEFA correlated negatively with insulin sensitivity (r = −0.62, P < 0.05). The majority of ceramides and monohexosylceramides were positively correlated with NEFA concentrations and negatively correlated with insulin sensitivity. Significant positive correlation coefficients between NEFA levels and multiple ceramide species were detected, ranging from 0.23 to 0.60 (P < 0.05), with the strongest correlations observed for C24:0-ceramide, total monohexosylceramide, and C22:0-monohexosylceramide (P < 0.001). Significant negative correlation coefficients between ceramides and RQUICKI values ranged from −0.33 to −0.22 (P < 0.05), and included total ceramide as well as individual ceramide subspecies (i.e., 20:0, C22:0, C24:0, C24:1, and C26:0). A remarkably similar relationship has been observed in obese type 2 diabetic patients and lean healthy control subjects (Haus et al., 2009). In further support, baseline measurements of C20:0-, C24:0-, and C24:1-ceramide were inversely related to insulin sensitivity in overweight adults (Dubé et al., 2011). In contrast, we did not detect significant correlations between plasma glycosylated ceramides (i.e., monohexosylceramides or lactosylceramides) and estimated whole-body insulin sensitivity. Comparably, dihydroceramide and ceramide classes correlate with type 2 diabetes and prediabetes in humans, correlations not observed for monohexosylceramide or lactosylceramide (Meikle et al., 2013).
Figure 9.

Nonparametric Spearman rank-order correlations of circulating ceramides to (A) plasma NEFA, and (B) revised quantitative insulin sensitivity check (RQUICKI), where RQUICKI was calculated as follows: 1/[log(glucose) + log(insulin) + log(NEFA)]. Lower RQUICKI values are indicative of reduced insulin sensitivity. Plasma ceramides were positively correlated with circulating NEFA, and negatively correlated with insulin sensitivity in dairy cows transitioning from late pregnancy to lactation. ***P < 0.001; **P < 0.01; *P < 0.05; †P < 0.10.
The development of insulin resistance and lipolysis represent coordinated shifts in metabolism to support lactation. Reduced insulin stimulation during the transition from gestation to lactation allows adipose tissue metabolism to change from lipogenic to lipolytic (McNamara, 1991), a shift that facilitates hepatic NEFA processing (Drackley et al., 2005). Although ceramides can be synthesized from NEFA and are known effectors of insulin resistance in monogastrics, little is known of their involvement in the homeorhetic process that modifies nutrient partitioning in cows transitioning from gestation to lactation. Because our observed increases in plasma ceramide concentrations occurred concomitantly with changes in NEFA, insulin, and insulin sensitivity in both lean and overweight cows during the transition from gestation to lactation (Figure 3, Figure 6, and Figure 9), the accumulation of ceramide may represent a homeorhetic adaptation that allows periparturient cows to undergo these characteristic shifts in metabolism.
Given that the mammalian sphingolipidome comprises a vast array of complex lipids, a major challenge in the field of sphingolipid biology is to identify which species are the primary effectors of insulin resistance in different tissues. A limitation of the current study is that we did not evaluate ceramide metabolism or insulin signaling in liver, skeletal muscle, or adipose tissue. Future studies will need to use rapidly advancing sphingolipidomics-based methodologies to address whether plasma or tissue ceramide can mediate the development of insulin resistance in periparturient dairy cows.
CONCLUSIONS
Insulin resistance accelerates lipolysis and increases metabolic disease risk in periparturient dairy cattle, and ceramide is an inhibitor of insulin action in monogastrics; however, the relationship between plasma ceramide and insulin resistance has not been characterized in peripartal cows. We conclude that ceramides accumulate in plasma during the progression of insulin resistance in overweight cows transitioning from late pregnancy to early lactation. These data support the potential involvement of ceramide in the pathological development of insulin resistance in dairy cattle. We also conclude that changes in plasma ceramide abundance occur concomitantly with changes in plasma NEFA, insulin, and insulin sensitivity, suggesting that circulating ceramides may be fundamentally involved in the homeorhetic adaptation to early lactation. To evaluate these possibilities, future work should focus on determining whether augmented insulin resistance in overweight cows is caused by maladaptive changes in fatty acid processing that promote the synthesis and accumulation of ceramide, and whether antagonism of insulin signaling is ceramide dependent. Identifying the mechanisms of insulin resistance may reveal metabolic pathways that can be manipulated to improve insulin sensitivity, reduce lipolysis, and improve cow health. Researchers should also evaluate the efficacy of plasma ceramide subspecies as diagnostic predictors for metabolic disease risk relative to the commonly utilized biomarkers NEFA and BHBA.
Supplementary Material
Acknowledgments
This work was supported by the USDA Sustainable Agriculture Research and Education Program (#GNE13-067) and the USDA Agriculture and Food Research Initiative (AFRI) Competitive Grant (#WVA00902). The authors gratefully acknowledge Jackie Lovett (Johns Hopkins University School of Medicine, Baltimore, MD) for her technical assistance and the VanGilder family at DoVan Farms for their participation.
References
- Ali AKA, Shook GE. An optimum transformation for somatic cell concentration in milk. J Dairy Sci. 1980;63:487–490. [Google Scholar]
- AOAC. Official Methods of Analysis. 15th. Vol. 2. Assoc Off Anal Chem; Arlington, VA: 1990. [Google Scholar]
- AOAC International. Official Methods of Analysis. 16th. AOAC International; Arlington, VA: 1995. [Google Scholar]
- Bandaru VV, McArthur JC, Sacktor N, Cutler RG, Knapp EL, Mattson MP, Haughey NJ. Associative and predictive biomarkers of dementia in HIV-1-infected patients. Neurology. 2007;68:1481–1487. doi: 10.1212/01.wnl.0000260610.79853.47. [DOI] [PMC free article] [PubMed] [Google Scholar]
- Bandaru VV, Mielke MM, Sacktor N, McArthur JC, Grant I, Letendre S, Chang L, Wojna V, Pardo C, Calabresi P, Mun-saka S, Haughey NJ. A lipid storage-like disorder contributes to cognitive decline in HIV-infected subjects. Neurology. 2013;81:1492–1499. doi: 10.1212/WNL.0b013e3182a9565e. [DOI] [PMC free article] [PubMed] [Google Scholar]
- Bandaru VV, Patel N, Ewaleifoh O, Haughey NJ. A failure to normalize biochemical and metabolic insults during morphine withdrawal disrupts synaptic repair in mice transgenic for HIV-gp120. J Neuroimmune Pharmacol. 2011;6:640–649. doi: 10.1007/s11481-011-9289-0. [DOI] [PMC free article] [PubMed] [Google Scholar]
- Bell AW. Regulation of organic nutrient metabolism during transition from late pregnancy to early lactation. J Anim Sci. 1995;73:2804–2819. doi: 10.2527/1995.7392804x. [DOI] [PubMed] [Google Scholar]
- Bell AW, Bauman DE. Adaptations of glucose metabolism during pregnancy and lactation. J Mammary Gland Biol Neoplasia. 1997;2:265–278. doi: 10.1023/a:1026336505343. [DOI] [PubMed] [Google Scholar]
- Boden G. Role of fatty acids in the pathogenesis of insulin resistance and NIDDM. Diabetes. 1997;46:3–10. [PubMed] [Google Scholar]
- Boon J, Hoy AJ, Stark R, Brown RD, Meex RC, Henstridge DC, Schenk S, Meikle PJ, Horowitz JF, Kingwell BA, Bruce CR, Watt MJ. Ceramides contained in LDL are elevated in type 2 diabetes and promote inflammation and skeletal muscle insulin resistance. Diabetes. 2013;62:401–410. doi: 10.2337/db12-0686. [DOI] [PMC free article] [PubMed] [Google Scholar]
- Chavez JA, Siddique MM, Wang ST, Ching J, Shayman JA, Summers SA. Ceramides and glucosylceramides are independent antagonists of insulin signaling. J Biol Chem. 2014;289:723–734. doi: 10.1074/jbc.M113.522847. [DOI] [PMC free article] [PubMed] [Google Scholar]
- Chavez JA, Summers SA. A ceramide-centric view of insulin resistance. Cell Metab. 2012;15:585–594. doi: 10.1016/j.cmet.2012.04.002. [DOI] [PubMed] [Google Scholar]
- Cuschieri J, Bulger E, Billgrin J, Garcia I, Maier RV. Acid sphingomyelinase is required for lipid Raft TLR4 complex formation. Surg Infect (Larchmt) 2007;8:91–106. doi: 10.1089/sur.2006.050. [DOI] [PubMed] [Google Scholar]
- Drackley JK, Andersen JB. Splanchnic metabolism of long-chain fatty acids in ruminants. In: Sejrsen K, Hvelplund T, Nielsen MO, editors. Ruminant Physiology: Digestion, Metabolism and Impact of Nutrition on Gene Expression, Immunology and Stress. Wageningen Academic Publ.; Wageningen, the Netherlands: 2006. pp. 199–224. [Google Scholar]
- Drackley JK, Dann HM, Douglas GN, Janovick Guretzky NA, Litherland NB, Underwood JP, Loor JJ. Physiological and pathological adaptations in dairy cows that may increase susceptibility to periparturient diseases and disorders. Ital J Anim Sci. 2005;4:323–344. [Google Scholar]
- Dubé JJ, Amati F, Toledo FGS, Stefanovic-Racic M, Rossi A, Coen P, Goodpaster BH. Effects of weight loss and exercise on insulin resistance, and intramyocellular triacylglycerol, diacylglycerol and ceramide. Diabetologia. 2011;54:1147–1156. doi: 10.1007/s00125-011-2065-0. [DOI] [PMC free article] [PubMed] [Google Scholar]
- Funaki M. Saturated fatty acids and insulin resistance. J Med Invest. 2009;56:88–92. doi: 10.2152/jmi.56.88. [DOI] [PubMed] [Google Scholar]
- Hannun YA, Obeid LM. Principles of bioactive lipid signalling: Lessons from sphingolipids. Nat Rev Mol Cell Biol. 2008;9:139–150. doi: 10.1038/nrm2329. [DOI] [PubMed] [Google Scholar]
- Haughey NJ, Cutler RG, Tamara A, McArthur JC, Vargas DL, Pardo CA, Turchan J, Nath A, Mattson MP. Perturbation of sphingolipid metabolism and ceramide production in HIV-dementia. Ann Neurol. 2004;55:257–267. doi: 10.1002/ana.10828. [DOI] [PubMed] [Google Scholar]
- Haus JM, Kashyap SR, Kasumov T, Zhang R, Kelly KR, DeFronzo RA, Kirwan JP. Plasma ceramides are elevated in obese subjects with type 2 diabetes and correlate with the severity of insulin resistance. Diabetes. 2009;58:337–343. doi: 10.2337/db08-1228. [DOI] [PMC free article] [PubMed] [Google Scholar]
- Hirabayashi Y, Igarashi Y, Merrill AH., Jr . Sphingolipids synthesis, transport and cellular signaling. In: Hirabayashi Y, Igarashi Y, Merrill AH Jr, editors. Sphingolipid Biology. Springer; Tokyo, Japan: 2006. pp. 3–22. [Google Scholar]
- Holland WL, Bikman BT, Wang LP, Yuguang G, Sargent KM, Bulchand S, Knotts TA, Shui G, Clegg DJ, Wenk MR, Pagliassotti MJ, Scherer PE, Summers SA. Lipid-induced insulin resistance mediated by the proinflammatory receptor TLR4 requires saturated fatty acid-induced ceramide biosynthesis in mice. J Clin Invest. 2011;121:1858–1870. doi: 10.1172/JCI43378. [DOI] [PMC free article] [PubMed] [Google Scholar]
- Holland WL, Brozinick JT, Wang LP, Hawkins ED, Sargent KM, Liu Y, Narra K, Hoehn KL, Knotts TA, Siesky A, Nelson DH, Karathanasis SK, Fontenot GK, Birnbaum MJ, Summers SA. Inhibition of ceramide synthesis ameliorates glucocorticoid-, saturated-fat-, and obesity-induced insulin resistance. Cell Metab. 2007;5:167–179. doi: 10.1016/j.cmet.2007.01.002. [DOI] [PubMed] [Google Scholar]
- Holtenius K, Agenas S, Delavaud C, Chilliard Y. Effects of feeding intensity during the dry period. 2. Metabolic and hormonal responses. J Dairy Sci. 2003;86:883–891. doi: 10.3168/jds.S0022-0302(03)73671-6. [DOI] [PubMed] [Google Scholar]
- Holtenius P, Holtenius K. A model to estimate insulin sensitivity in dairy cows. Acta Vet Scand. 2007;49:29. doi: 10.1186/1751-0147-49-29. [DOI] [PMC free article] [PubMed] [Google Scholar]
- Ichi I, Nakahara K, Miyashita Y, Hidaka A, Kutsukake S, Inoue K, Maruyama T, Miwa Y, Harada-Shiba M, Tsushima M, Kojo S. Association of ceramides in human plasma with risk factors of atherosclerosis. Lipids. 2006;41:859–863. doi: 10.1007/s11745-006-5041-6. [DOI] [PubMed] [Google Scholar]
- Jaakson H, Ling K, Samarütel J, Ilves A, Kaart T, Kärt O. Bood glucose and insulin response of the glucose tolerance test in relation to dairy cow body condition and milk yield. Vet Med Zoot T. 2013;62:28–35. [Google Scholar]
- Lightle S, Tosheva R, Lee A, Queen-Baker J, Boyanovsky B, Shedlofsky S, Nikolova-Karakashian M. Elevation of ceramide in serum lipoproteins during acute phase response in humans and mice: Role of serine-palmitoyl transferase. Arch Biochem Biophys. 2003;419:120–128. doi: 10.1016/j.abb.2003.08.031. [DOI] [PubMed] [Google Scholar]
- McNamara JP. Regulation of adipose tissue metabolism in support of lactation. J Dairy Sci. 1991;74:706–719. doi: 10.3168/jds.S0022-0302(91)78217-9. [DOI] [PubMed] [Google Scholar]
- Mei J, Holst LS, Landstrom TR, Holm C, Brindley D, Manganiello V, Degerman E. C2-ceramide influences the expression and insulin-mediated regulation of cyclic nucleotide phosphodiesterase 3B and lipolysis in 3T3–L1 adipocytes. Diabetes. 2002;51:631–637. doi: 10.2337/diabetes.51.3.631. [DOI] [PubMed] [Google Scholar]
- Meikle PJ, Wong G, Barlow CK, Weir JM, Greeve MA, MacIntosh GL, Almasy L, Comuzzie AG, Mahaney MC, Kowalczyk A, Haviv I, Grantham N, Magliano DJ, Jowett JBM, Zimmet P, Curran JE, Blangero J, Shaw J. Plasma lipid profiling shows similar associations with prediabetes and type 2 diabetes. PLoS ONE. 2013;8:e74341. doi: 10.1371/journal.pone.0074341. [DOI] [PMC free article] [PubMed] [Google Scholar]
- Merrill AH, Jr, Stokes TH, Momin A, Park H, Portz BJ, Kelly S, Wang E, Sullards MC, Wang MD. Sphingolipidomics. A valuable tool for understanding the roles of phingolipids in biology and disease. 2009;50:S97–S102. doi: 10.1194/jlr.R800073-JLR200. [DOI] [PMC free article] [PubMed] [Google Scholar]
- Park JW, Pewzner-Jung Y. Ceramide synthases: Reexamining longevity. In: Gulbins E, Petrache I, editors. Sphingolipids: Basic Science and Drug Development. Vol. 215. Springer; Vienna, Italy: 2013. pp. 89–107. [DOI] [PubMed] [Google Scholar]
- Pires JA, Pescara JB, Grummer RR. Reduction of plasma NEFA concentration by nicotinic acid enhances the response to insulin in feed-restricted Holstein cows. J Dairy Sci. 2007b;90:4635–4642. doi: 10.3168/jds.2007-0146. [DOI] [PubMed] [Google Scholar]
- Pires JA, Souza AH, Grummer RR. Induction of hyperlipidemia by intravenous infusion of tallow emulsion causes insulin resistance in Holstein cows. J Dairy Sci. 2007a;90:2735–2744. doi: 10.3168/jds.2006-759. [DOI] [PubMed] [Google Scholar]
- Reaven GM, Hollenbeck C, Jeng CY, Wu MS, Chen YDI. Measurement of plasma glucose, free fatty acid, lactate, and insulin for 24 h in patients with NIDDM. Diabetes. 1988;37:1020–1024. doi: 10.2337/diab.37.8.1020. [DOI] [PubMed] [Google Scholar]
- Rukkwamsuk T, Kruip TAM, Wensing T. Relationship between overfeeding and overconditioning in the dry period and the problems of high-producing dairy cows during the postparturient period. Vet Q. 1999;21:71–77. doi: 10.1080/01652176.1999.9694997. [DOI] [PubMed] [Google Scholar]
- Spachmann SK, Schönhusen U, Kuhla B, Röntgen M, Hammon HM. Insulin signaling of glucose uptake in skeletal muscle of lactating dairy cows. In: Oltjen JW, Kebreab E, Lapierre Hélène, editors. Energy and Protein Metabolism and Nutrition in Sustainable Animal Production: 4th International Symposium on Energy and Protein Metabolism and Nutrition, Sacramento, CA. Vol. 134. Wageningen Academic Publ; Wageningen, the Netherlands: 2013. pp. 277–278. [Google Scholar]
- Thévenod F. Pathophysiology of diabetes mellitus type 2: Roles of obesity, insulin resistance and β-Cell dysfunction. Front Diabetes. In: Masur K, Thévenod F, SZänker K, editors. Diabetes and Cancer: Epidemiological Evidence and Molecular Links. Vol. 19. Karger; Basel, Switzerland: 2008. pp. 1–18. [Google Scholar]
- Ussher JR, Koves TR, Cadete VJJ, Zhang L, Jaswal JS, Swyrd SJ, Lopaschuk DG, Proctor SD, Keung W, Muoio DM. Inhibition of de novo ceramide synthesis reverses diet-induced insulin resistance and enhances whole-body oxygen consumption. Diabetes. 2010;59:2453–2464. doi: 10.2337/db09-1293. [DOI] [PMC free article] [PubMed] [Google Scholar]
- Watt MJ, Barnett AC, Bruce CR, Schenk S, Horowitz JF, Hoy AJ. Regulation of plasma ceramide levels with fatty acid oversupply: Evidence that the liver detects and secretes de novo synthesised ceramide. Diabetologia. 2012;55:2741–2746. doi: 10.1007/s00125-012-2649-3. [DOI] [PMC free article] [PubMed] [Google Scholar]
- Wildman EE, Jones GM, Wagner PE, Bowman RL. A dairy cow body condition scoring system and its relationship to selected production characteristics. J Dairy Sci. 1982;65:495–501. [Google Scholar]
- Xia J, Mandal R, Sinelnikov I, Broadhurst D, Wishart DS. MetaboAnalyst 2.0—A comprehensive server for metabolomic data analysis. Nucleic Acids Res. 2012;40:W127–W133. doi: 10.1093/nar/gks374. [DOI] [PMC free article] [PubMed] [Google Scholar]
Associated Data
This section collects any data citations, data availability statements, or supplementary materials included in this article.