

Abstract
Accurate detection and risk stratification are paramount to the clinical management of prostate cancer. Current diagnostic methods, including prostate specific antigen (PSA) screening, are unable to differentiate high-risk tumors from low-risk tumors, resulting in overdiagnosis and overtreatment. A peptide targeted contrast agent, ZD2-Gd(HP-DO3A), specific to an oncoprotein in tumor microenvironment, EDB-FN, was synthesized for non-invasive detection and characterization of aggressive prostate cancer. EDB-FN, one of the subtypes of oncofetal fibronectin, is involved in tumor epithelial-to-mesenchymal transition (EMT), which is implicated in drug resistance and metastasis. The EDB-FN mRNA level in the metastatic PC3 cells was at least three times higher than that in non-metastatic LNCaP cells. In tumors, EDB-FN protein was highly expressed in PC3 tumor xenografts, but not in LNCaP tumors, as revealed by western blot analysis. ZD2-Gd(HP-DO3A) produced over two times higher contrast-to-noise ratio in the PC3 tumors than in the LNCaP tumors in contrast-enhanced MRI during 30 min after injection. ZD2-Gd(HP-DO3A) possessed high chelate stability against transmetallation and minimal tissue accumulation. Our results demonstrate that molecular MRI of EDB-FN with ZD2-Gd(HP-DO3A) can potentially be used for non-invasive detection and risk stratification of human prostate cancer. Incorporation of this targeted contrast agent in the existing clinical contrast enhanced MRI procedures has the potential to improve diagnostic accuracy of prostate cancer.
Keywords: MRI, prostate cancer, detection, risk stratification, EDB fibronectin, contrast agent
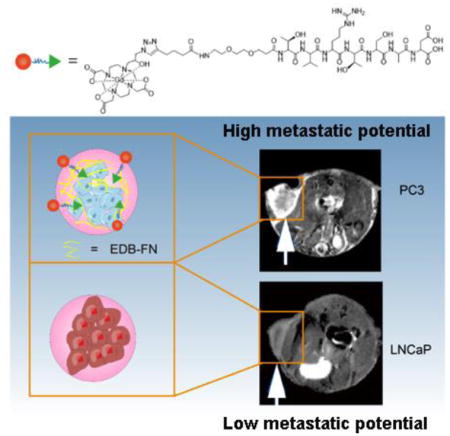
Graphical Abstract
Introduction
Prostate cancer is the most common noncutaneous malignancy and a highly heterogeneous disease with significant variations in natural history. Although one in seven men will be diagnosed with prostate cancer in their lifetime, only about one in five of the diagnosed patients may actually die from the disease 1. While most patients with low-risk cancer have an indolent disease course even without treatment, patients who are diagnosed with high-risk cancer have a substantial risk of prostate cancer-related death 2. The five-year survival rate of the patients with localized disease is nearly 100%, while it drops dramatically to only 28% for those with distant metastases. This makes prostate cancer the second most common cause of cancer death of men in the United States 3. Therefore, early accurate detection, localization, and risk-stratification of high-risk prostate cancer are critical for physicians to tailor efficacious interventions for early treatment at a treatable stage.
Because of the heterogeneity of prostate cancer, the cornerstone of its clinical management is to categorize prostate cancers into different risk groups based on the cancer grade and PSA level, followed by risk-stratified management, including active surveillance for low-risk cancers and treatment for intermediate- and high-risk diseases 4, 5. Unfortunately, the current diagnostic methods, including PSA screening and Gleason grading from the standard 12-core prostate needle-biopsy, cannot accurately determine prostate cancer risk, resulting in high rates of overdiagnoses and false positives 6, 7. Out of the concern that the risk of overdiagnosis and overtreatment may outweigh the benefit of the PSA screening, the US Preventive Services Task Force recommended against PSA screening in 2012 8.
MRI is a non-invasive imaging modality with no ionizing radiation and provides high resolution three-dimensional images of soft tissues. Multiparametric MRI has been tested in clinical trials and is proven useful in tumor localization 9, 10. However, the existing clinical MRI contrast agents are not tumor specific and unable to provide accurate detection and characterization of prostate cancer. The development of a safe and effective targeted MRI contrast agent specific to a biomarker that can reliably localize minute high-risk prostate tumors earlier and provide accurate risk stratification will have significant impact on the clinical management of the disease. MR molecular imaging with the targeted contrast agent can also be useful for non-invasive active surveillance of cancer progression, which is valuable in determining the critical timing of effective intervention.
Extradomain B fibronectin (EDB-FN) is an oncofetal isoform of fibronectin (FN), overexpressed in various human cancers, including prostate cancer, and absent in normal tissues. Moreover, its expression is inversely correlated with patient survival 11–13. It is one of the hallmarks of epithelial-to-mesenchymal transition (EMT) 14. EMT is a physiologic process that involves in the invasion, metastasis, and drug resistance of malignant human cancers, including prostate cancer 15–17. Clinical evidence demonstrates that EDB-FN is highly expressed in high-risk prostate cancer, low in benign lesions, including benign prostatic hyperplasia (BPH) 18–20. Therefore, EDB-FN is a promising target for early detection and differential localization of high-risk prostate tumor with molecular imaging 21. Recently, we have identified a small peptide ZD2 (Thr-Val-Arg-Thr-Ser-Ala-Asp) for specific targeting of EDB fragment using phage display 22. The peptide exhibited strong specific binding to high-grade human prostate tumor, low binding to low-grade tumor, and non-binding in non-cancerous tissue in correlation to EDB-FN expression levels. Although antibodies and targeted nanoparticles specific to EDB-FN have been developed for cancer imaging 23, 24, small peptide targeted MRI contrast agents are advantageous in rapid extravasation and target binding and low background noise due to the clearance of unbound agent from the circulation. Therefore, ZD2 peptide is a promising targeting agent for designing targeted MRI contrast agents or therapeutics specific to EDB-FN for cancer imaging and therapy.
In this study, we synthesized a targeted contrast agent ZD2-Gd(HP-DO3A) by conjugating linear ZD2 peptide to a macrocyclic clinical MRI contrast agent Gd(HP-DO3A) via click chemistry. MR molecular imaging of EDB-FN with the targeted MRI contrast agent was investigated for non-invasive detection and characterization of aggressive prostate cancer in animal models. Mice with subcutaneous PC3 prostate tumor xenografts of high metastatic potential and LNCaP prostate tumor xenografts of low metastatic potential were used to represent high-risk and low-risk prostate cancer models 25. The effectiveness of the MR molecular imaging with ZD2-Gd(HP-DO3A) was evaluated in the tumor models with contrast enhanced MRI and quantitative T1 mapping with a clinical agent ProHance® or Gd(HP-DO3A) as a control. Chelation stability, tumor targeting, and tissue clearance of the targeted contrast agent were also investigated in vitro and in animal models.
Results
Contrast agent synthesis and characterization
The small molecular targeted MRI contrast agent ZD2-Gd(HP-DO3A) was synthesized by conjugating EDB-FN-targeting peptide ZD2 22 to a clinical macrocyclic agent ProHance® [Gd(HP-DO3A)] (Fig. 1A). The final product was characterized by MALDI-TOF mass spectrometry (Fig. 1B) and HPLC (Fig. 1C). ZD2-Gd(HP-DO3A) exhibited a binding affinity of 1.7 μM (Fig. 1D and 1E) to EDB fragment, which is sufficient for reversible binding, so as to produce detectable signal enhancement of the molecular target in contrast enhanced MRI, as well as to facilitate rapid clearance from the body after imaging and minimize potential side-effects. ZD2-Gd(HP-DO3A) demonstrated high chelate stability, comparable to its clinical analog ProHance, with no evident transmetallation during 24 hours of incubation with endogenous metal ions Cu2+, Ca2+, and Zn2+ in PBS (pH = 7.4) (Fig. 2A). ZD2-Gd(HP-DO3A) had the same high stability as ProHance over both the linear agents MultiHance® and OmniScan® against transmetallation in blood plasma containing Cu2+, Ca2+, and Zn2+ ions (Fig. 2B). This superior chelate stability is critical to minimizing potential side effects of the targeted contrast agent for its clinical application.
Figure 1. Synthesis and characterization of ZD2-Gd(HP-DO3A).

A, synthesis route of ZD2-Gd(HP-DO3A). Briefly, ZD2 peptide was synthesized (yielding compound 1) and conjugated with Fmoc-NH-(CH2CH2O)2-CH2CH2COOH (yielding compound 2) and 5-hexynoic acid (yielding compound 3) in solid phase. Compounds 3 and 4 were reacted using click chemistry to produce ZD2-Gd(HP-DO3A). B, MALDI-TOF mass spectrum (detected molecular weight: 1600.2 Da; calculated molecular weight: 1601.79 Da) of ZD2-Gd(HP-DO3A). C, reversed-phase high performance liquid chromatography (RP-HPLC) analysis of ZD2-Gd(HP-DO3A). D, sensorgram measured by surface plasma resonance (SPR) analysis of varying concentrations of ZD2-Gd(DO3A). E, Plot of response/concentration versus response for the sensorgram shown in (c) yields the binding affinity of 1.7 μM for ZD2-Gd(HP-DO3A) to EDB protein (organ trend line). Data that represents a weak binding site was also shown (blue trend line). F, Plot of 1/T1 measured by T1 mapping in phantom containing increasing concentration of ZD2-Gd(HP-DO3A) (abbreviated as ZD2) in PC3 tumor lysates. G, Plot of 1/T1 measured by T1 mapping in phantom containing increasing concentration of ProHance (abbreviated as Pro.) in PC3 tumor lysates. Fitting of the data yielded r1 relaxivities of 4.12 mM−1s−1 for ZD2-Gd(HP-DO3A) and 3.17 mM−1s−1 for ProHance.
Figure 2. In vitro complexation stability and transmetallation analysis of ZD2-Gd(HP-DO3A).

A, relative Gd3+ content of ZD2-Gd(HP-DO3A) assayed during 200-min incubation of the agent in phosphate buffer saline (PBS) with and without Cu2+, Ca2+, or Zn2+ ions. No decrease in Gd3+ content was observed, demonstrating high chelate stability. B, In vitro transmetallation analysis of MultiHance, OmniScan, ProHance (abbreviated as Pro.), and ZD2-Gd(HP-DO3A) (abbreviated as ZD2) in mouse serum.
EDB-FN upregulation is associated with the metastatic phenotype of prostate cancers
Unlike LNCaP cells, PC3 cells exhibited typical characteristics of post epithelial-to-mesenchymal transition (EMT) phenotype, including loss of E-cadherin and upregulation of N-cadherin and vimentin (Fig. 3A) 14. This EMT signature is strongly associated with enhanced cancer cell migration, metastasis, and drug resistance 26. Importantly, EDB-FN expression was significantly upregulated in PC3 cells as compared to LNCaP cells (Fig. 3A and 3B), indicating that EDB-FN is a molecular marker of high-risk prostate cancer 20, 22, 27. It is interesting to note that the expression of epidermal growth factor receptor (EGFR) and prostate-specific membrane antigen (PSMA) did not correlate with the metastatic potential of the two cell lines. When cultured on top of a thick layer of matrigel, LNCaP and PC3 cells displayed distinctive spheroid-forming abilities (Figure C). Only PC3 cells were able to penetrate into the matrix and form 3D spheroids, resembling tumors cultured in a native microenvironment, while the LNCaP cells formed cell clusters that distributed primarily on the matrigel surface. Cy5.5-labeled ZD2 peptide (ZD2-Cy5.5) was able to bind EDB-FN secreted by the PC3 spheroids, highlighted by the dispersed red fluorescence signal from the spheroids, whereas no peptide binding was detected on the LNCaP cell clusters (Figure D). This specific targeting of ZD2 to aggressive prostate cancer was also validated by examining the Cy5.5 signal in the tumor and organs dissected from mice bearing PC3 and LNCaP prostate tumor xenografts, at 3 hours after intravenous injection of ZD2-Cy5.5. As expected, only the PC3, but not the LNCaP tumors, showed an enhanced fluorescence signal from ZD2-Cy5.5, when compared to the respective normal mouse organs (Fig. 3E). Microscopically, ZD2 was found to colocalize with the EDB-FN fibril network in the PC3 tumor sections, whereas EDB-FN and ZD2-Cy5.5 were undetectable in the LNCaP tumor sections (Fig. 3F). The difference in the expression and distribution of EDB-FN in these two tumors was also verified by immunohistochemical (IHC) staining (Fig. 3G), indicating that upregulated EDB-FN is a promising molecular target for differential diagnosis of aggressive prostate cancer and the ZD2 peptide is an effective targeting agent for this marker.
Figure 3. Upregulated EDB-FN is a promising biomarker for high-risk prostate cancer.

A, comparison of the relative mRNA expression of prostate cancer biomarkers, including EDB-FN (EDB), Vimentin, E-Cadherin (E-Cad), N-Cadherin (N-Cad), epidermal growth factor receptor (EGFR), and prostate-specific membrane antigen (PSMA) between PC3 and LNCaP cells (n = 3, unpaired two-tailed t-test, *: P<0.05, **: P<0.01, ***: P<0.001). All gene expression was normalized to β-actin mRNA levels. B, western blot analysis of EDB-FN expression in PC3 and LNCaP tumors. Actin expression was used as a loading control. C, representative phase contrast images of LNCaP and PC3 cells grown in 3D matrigel. Scale bar: 40 μm. D, representative fluorescence images of 3D cultures of LNCaP and PC3 cells incubated with 250 nM ZD2-Cy5.5, using confocal microscopy. Colors: green, GFP; red: ZD2-Cy5.5. Inset: enlarged image of the 3D spheres. E, ex vivo fluorescent Cy5.5 and bright field (BF) images of tumors and organs from PC3 and LNCaP mouse models, at 3 h post-injection of 10 nmol ZD2-Cy5.5. Numbers denote: 1, lung; 2, tumor; 3, spleen; 4, muscle; 5, brain; 6, heart; 7, kidney; 8, liver. F, confocal fluorescence microscopy images of PC3 and LNCaP tumor sections stained with ZD2-Cy5.5 and anti-EDB-FN antibody. Colors: blue, DAPI; red, ZD2-Cy5.5; yellow, EDB-FN. Overlay: addition of DAPI, ZD2-Cy5.5, and EDB-FN channels. Scale bar: 20 μm. G, immunohistochemical (IHC) staining for EDB-FN and H&E staining on PC3 and LNCaP tumor sections. The brown color in IHC staining indicates EDB-FN distribution only in PC3 but not in the LNCaP sections. Scale bar: 20 μm.
Differential imaging of prostate cancer with MRI and ZD2-Gd(HP-DO3A)
The effectiveness of contrast enhanced MRI with ZD2-Gd(HP-DO3A) in differential imaging of prostate cancer was determined in mice bearing subcutaneous PC3 and LNCaP prostate tumor xenografts. The T1 relaxivity of ZD2-Gd(HP-DO3A) was 3.7 mM−1s−1 at 7T, as calculated from the measured T1 values of a multi-compartment phantom containing different concentrations of ZD2-Gd(HP-DO3A) (Fig. 4A). T1-weighted MR images of the tumor models were obtained before and at different time points after intravenous administration of 0.1 mmol/kg ZD2-Gd(HP-DO3A). Strong signal enhancement was observed in the PC3 tumors with ZD2-Gd(HP-DO3A) and remained prominent for at least 30 min post-injection (Fig. 4B). In contrast, the LNCaP tumors showed a significantly lower signal enhancement with ZD2-Gd(HP-DO3A) (Fig. 4B). The non-targeted clinical control ProHance only resulted in modest contrast enhancement in both the PC3 and LNCaP tumors (Fig. 4B). As shown in Fig. 4C, the contrast-to-noise ratio (CNR) in the PC3 tumors showed an over two-fold increase at 10 min after ZD2-GD(HP-DO3A) injection and peaked at 30 min (CNR = 23.7±1.68; n=5; SEM), which is an over five-fold increase due to the contrast agent accumulation in the tumors and clearance in the normal tissues. The CNR in LNCaP tumors only increased about 10~60% during the first 30 min after ZD2-Gd(HP-DO3A) injection (CNR = 6~9), and was more than two times lower than that in the PC3 ones (CNR = 12~25) (P < 0.01 for 10 min and 20 min post-injection; P < 0.001 for 30 min post-injection). ProHance resulted in lower CNR in PC3 tumors (CNR = 7~11; P < 0.05 at all time points compared to the ZD2-Gd(HP-DO3A) group), which is not significantly different from that in LNCaP tumors (CNR= 7~10) (P > 0.05) (Fig. 4C). ZD2-Gd(HP-DO3A) did not produce significant contrast enhancement in other organs and normal tissues similar to the clinical control ProHance. In addition, co-injection of excess free ZD2 peptide (0.5 mmol/kg) significantly reduced signal enhancement and CNR in the PC3 tumors with ZD2-Gd(HP-DO3A) (0.1 mmol/kg), due to competitive binding of the free peptide to EDB-FN in the PC3 tumors (Fig. 4C). These results suggest that molecular MRI of EDB-FN with ZD2-Gd(HP-DO3A) can effectively and specifically differentiate high-risk prostate tumors from low-risk ones.
Figure 4. The EDB-FN targeting contrast agent, ZD2-Gd(HP-DO3A), is capable of differentiating between PC3 and LNCaP tumors in T1-weighted MRI.

A, plot of 1/T1 value versus concentration of ZD2-Gd(HP-DO3A) for calculating r1 relaxivity in PBS at 7T. Inset: T1 color-coded maps of phantoms containing ZD2-Gd(HP-DO3A) solution at different concentrations. Numbers close to each phantom denote: 1, 50 μM; 2, 25 μM; 3, 12.5 μM; 4, 6.25 μM; 5, 3.12 μM. B, Axial MRI images of PC3 and LNCaP tumor models at the indicated tumor positions acquired with a T1-weighted sequence. Images of mice at pre-contrast (abbreviated as pre) and at 10 min, 20 min, and 30 min post-injection are shown. The names of the contrast agents are abbreviated as: ZD2, ZD2-Gd(HP-DO3A); Pro., ProHance. Competitive: injection of 0.1 mmol/kg ZD2-Gd(HP-DO3A) mixed with 0.5 mmol/kg ZD2 peptide in mice with PC3 tumors. C, change in contrast-to-noise ratio of tumors in the experiments shown in B. Data represent the mean±s.e.m. of 5 mice in all experimental groups except for the competitive group (n = 3) (unpaired two-tailed t-test: P<0.05 for comparison of ZD2-PC3 vs. all other groups at 10 min, 20 min and 30 min). Legends: ZD2-PC3, PC3 tumor model injected with ZD2-Gd(HP-DO3A); ZD2-LNCaP, LNCaP tumor model injected with ZD2-Gd(HP-DO3A); Pro.-PC3, PC3 tumor model injected with ProHance; Pro.-LNCaP, LNCaP tumor model injected with ProHance.
Previous reports have shown signal enhancement of pentapeptide CREKA (Cys-Arg-Glu-Lys-Ala) targeted imaging agents specific to fibrin-FN clots in cancer imaging 24, 28, 29. CREKA-Gd(HP-DO3A) was synthesized by conjugating CREKA to Gd(HP-DO3A) to assess its potential in differential MRI of the prostate tumors and to validate the effectiveness of ZD2-Gd(HP-DO3A). Although CREKA-Gd(HP-DO3A) generated significant contrast enhancement in the periphery of both the tumors, no significant difference was observed in signal enhancement between the PC3 and LNCaP tumors (Fig. 5).
Figure 5. Contrast enhanced MRI with CREKA-Gd(HP-DO3A) in the PC3 and LNCaP tumors.

A, axial images of PC3 and LNCaP tumor locations. B, quantification of the change in CNR in the PC3 and LNCaP tumors up to 30 min after CREKA-Gd(HP-DO3A) injection. No significant difference was seen between the two groups.
T1-mapping
Quantitative T1 maps of the tumors were acquired before and at 30 min after the injection of ZD2-Gd(HP-DO3A) and ProHance. ZD2-Gd(HP-DO3A) resulted in the T1 decrease from 2.75±0.05 s to 1.81±0.07 s and from 3.21±0.12 s to 2.54±0.13 s for PC3 and LNCaP tumors, respectively (Fig. 6A). The maps of the changes in relaxation rate (ΔR1) before and after the contrast agent injection revealed the highest relaxation rate change in the PC3 tumors among all cases, indicating the highest accumulation of the targeted contrast agent only in the PC tumors (Fig. 6A and 6B). Based on the relaxivity of the contrast agents measured after incubation with tumor homogenates (Fig. 1F and 1G), the average calculated concentration was 46.7±6.2 and 20.2±2.2 μM for ZD2-Gd(HP-DO3A), and 28.5±4.9 and 32.5±6.4 μM for ProHance in the PC3 and LNCaP tumors, respectively. At the end of the T1 map acquisitions, the mice were sacrificed and the Gd3+ concentration in their tumors was measured by inductively coupled plasma optical emission spectrometry (ICP-OES). The measured Gd3+ concentration was slightly lower than (but still comparable to) the values obtained by the T1 mapping, possibly because of the concentration changes occurring during the time lag between T1 mapping and animal sacrificing. Nevertheless, ZD2-Gd(HP-DO3A) had significantly higher concentration in the PC3 tumors than in the LNCaP tumors and that of ProHance in both the tumors (Fig. 6C), further validating the targeting specificity of ZD2-Gd(HP-DO3A) to the metastatic PC3 tumors.
Figure 6. T1 maps and accumulation of ZD2-Gd(HP-DO3A) validate its specific binding in PC3 tumors.

A, T1 and ΔR1 maps showing the tumor T1 and ΔR1 values in PC3 or LNCaP tumor models injected with ZD2-Gd(HP-DO3A) (abbreviated as ZD2) or ProHance (abbreviated as Pro.) at pre-contrast (pre) or 30 min post-injection. Images are displayed as overlays of tumor color-coded maps and axial T1-weighted images. B, quantification of average ΔR1 after contrast injection in the groups shown in A (n = 4; *, P < 0.05, **, P < 0.01). C, comparison of contrast agent accumulation in the tumors, as measured by ICP-OES at 30 min after contrast agent injection (unpaired two-tailed t-test: n = 4; *, P < 0.05; NS: not significant).
In vivo chelation stability and biodistribution of the targeted contrast agent
Safety is the primary concern for clinical application of gadolinium-based MRI contrast agents. The release of free Gd3+ ions from contrast agents and long-term tissue retention may cause toxic side-effects 30, 31. Similar to ProHance, ZD2-Gd(HP-DO3A) underwent a rapid clearance through renal filtration with over 95% of the injected dose excreted in urine within 24 hours post-injection (Fig. 7A). ZD2-Gd(HP-DO3A) exhibited the same chelate stability as ProHance, without any significant increase in the urine concentration of these ions after injection, when compared to pre-injection ion concentrations (P > 0.05). The linear contrast agent Omniscan® resulted in a significant increase in Zn2+ concentration (P < 0.05). ZD2-Gd(HP-DO3A) exhibited the same low tissue retention as ProHance (Fig. 7B). The Gd3+ concentration was below the detection limit of ICP-OES in most of the organs, including the brain, heart, and skin. These results suggest that ZD2-Gd(HP-DO3A) has the same in vivo chelate stability and minimal tissue retention as well as the same safety profile compared to ProHance, one of the most stable MRI contrast agents.
Figure 7. In vivo transmetallation and biodistribution of MRI contrast agents after intravenous administration.

A, Gd3+ content in urine before and at 8 h and 24 h after ZD2-Gd(HP-DO3A), ProHance, MultiHance, or OmniScan injections. B, Gd biodistribution in mouse tissues at 1 week after injection of ZD2-Gd(HP-DO3A) (n = 4) or ProHance (n = 3). Gd3+ content is represented as the ratio of dose injected to the weight of the tissue. Inset: biodistribution data shown with a shorter-scale on the Y-axis. No significant difference was seen between the two groups.
Discussion
Molecular imaging of the protein markers associated with tumor aggressiveness has the potential to provide accurate and non-invasive detection and characterization of high-risk tumors. Oncofetal FN subtypes, including EDB-FN, are the well-documented markers for EMT, which involves in cancer invasion, metastasis, and drug resistance. Their expression levels are inversely correlated with the survival of cancer patients. These properties of oncofetal FN imply its potential for cancer differential diagnosis and characterization with imaging. EDB-FN is highly expressed by the aggressive and androgen insensitive PC3 prostate cancer cells, not by slow-growing and androgen sensitive LNCaP cells. The expression of EGFR and PSMA, the protein markers commonly investigated for prostate cancer imaging, did not show obvious correlation with the aggressiveness of the cell lines. EDB-FN seems to be a relevant and promising protein target for characterizing the aggressiveness of prostate cancer.
High-resolution MR molecular imaging has the ability to detect and characterize aggressive tumors in the entire prostate at an early stage. However, clinical application of MR molecular imaging is limited by its low sensitivity. We have shown that this limitation can be overcome by targeting the cancer-related protein markers abundant in the ECM of aggressive tumors 28. Previously, we showed that molecular MRI of fibrin-FN clots was able to detect tumors, including micrometastasis 28, 29, 32. However, the clots were mainly formed by plasma FN and fibrin in the angiogenic areas of the tumor and not a specific target for differentiating two tumor models as shown in Fig. 5. The dynamic contrast enhanced MRI revealed that a sufficient amount of ZD2-Gd(HP-DO3A) rapidly bound to abundant EDB-FN in aggressive PC3 tumors to produce strong signal enhancement within first 10 minutes post-injection, which was not evident in slow growing LNCaP tumors and normal tissues (Fig. 4). The clearance of the unbound targeted agent from the non-specific tissues gradually increased the CNR only in the PC3 tumors in the first 30 minutes of contrast administration. Differential characterization of the tumor models was also confirmed by quantitative T1 mapping and quantification of the contrast accumulation in the tumors. The use of an excess of free ZD2 peptide in competitive MRI blocked the binding of the targeted agent and reduced tumor enhancement in the PC3 tumors, which validated its specificity to the protein marker. These results demonstrated the effectiveness and specificity of MR molecular imaging with ZD2-Gd(HP-DO3A) in detection and characterization of high-risk prostate cancers of high expression of EDB-FN.
In this study, a Look-Locker sequence with spiral trajectory was adopted for fast T1 mapping 33. This sequence shortened the acquisition time to about 3 min 44 s using both Look-Locker sequence and M0 determination. With M0 determination done once in pre-contrast acquisition, a temporal resolution of 2 min 40 s with a voxel size of 0.23 × 0.23 × 1 mm3 was achieved for post-contrast acquisition. This method is inherently more tolerant to B1 inhomogeneity and sensitive to contrast agent induced T1 change. The concentration of the targeted contrast agent in the different tumors determined by the T1 mapping was comparable to the Gd3+ concentrations quantified by ICP-OES, which was also consistent to the protein expression levels revealed by the immunohistochemical staining (Fig. 3). Rapid T1 mapping could be a valuable imaging tool to provide a non-invasive quantitative measurement of the protein marker with the targeted contrast agent for quantitative characterization of prostate cancers.
Safety is a critical parameter for clinical application of any gadolinium based MRI contrast agent 34. Stability and complete excretion of the agents are essential to minimize potential toxic side effects 34, 35. The reported toxic side effects are generally associated with slow excretion and poor chelation stability against transmetallation of some of the gadolinium based contrast agents, mainly DTPA based linear chelates. Macrocyclic MRI contrast agents generally have high chelate stability and good safety profile. We selected one of the most stable macrocyclic clinical contrast agents, Gd(HP-DO3A), in the design of the small peptide targeted contrast agents 36. The targeted contrast agent possessed the same in vitro and in vivo chelate stability as the clinical agent and the same minimal tissue accumulation, Fig. 2 and Fig. 7. The results indicate that the targeted agent ZD2-Gd(HP-DO3A) could have the same safety profile as the clinical contrast agent.
Because the EDB fragment is completely conserved in all mammalian species 11, 27, MR molecular imaging of EDB-FN with ZD2-Gd(HP-DO3A) could be readily translated into clinical application in human patients and implemented in the existing clinical protocols of contrast enhanced MRI. Strong signal enhancement was observed in high-risk tumors in first 10 minutes post-injection before strong signal enhancement was observed in the bladder due to clearance of the unbound agent. This may minimize potential interference of the bladder signal enhancement on diagnostic imaging of the prostate. Nevertheless, the bladder enhancement in MRI may not be as a significant issue as in other molecular imaging modalities such as PET and SPECT, due to its high spatial resolution. This molecular imaging technology could be applied to detect, localize, and characterize high-risk tumors in the entire prostate after the initial PSA screening. Accurate detection, localization, and stratification of high-risk tumors would facilitate the earliest possible clinical interventions for the tumors, while sparing patients with indolent tumors from radical procedures. This strategy could also be used for non-invasive active surveillance of the indolent tumors. Further comprehensive preclinical and clinical assessment of the safety and effectiveness of the targeted agent contrast and MR molecular imaging is needed to warrant the clinical application of the imaging technology.
Conclusion
The peptide targeted contrast agent ZD2-Gd(HP-DO3A) specific to EDB-FN resulted in strong signal enhancement in aggressive PC3 prostate cancer and low enhancement in LNCaP prostate cancer in mouse models. The targeted contrast agent exhibits the same high in vitro and in vivo chelation stability and minimal body accumulation as a clinical contrast agent, which bodes well a good safety profile for clinical translation. MR molecular imaging with the targeted contrast agent has the promise to improve the accuracy of the detection and risk-stratification of high-risk prostate cancer and to minimize overdiagnosis and overtreatment in clinical management of the disease. In addition, EDB-FN is also highly expressed in other types of aggressive cancers, potentially opening up avenues for the use of the imaging technology in detection and differential diagnosis as well as image-guided therapy of a broad spectrum of cancers.
Materials and Methods
Materials and Cell culture
All reagents for chemical synthesis were purchased from Sigma Aldrich unless stated otherwise. PC3 and LNCaP cells were purchased from American Type Culture Collection (ATCC, Manassas, VA, USA) and grown in RPMI medium (Thermo Fisher Scientific, Waltham, MA, USA) supplemented with 10% Fetal Bovine Serum (FBS), 100 U/mL penicillin and 0.1 mg/mL streptomycin at 37°C in 5% CO2. To construct GFP-expressing cell lines, cells were transfected with lentivirus as previously reported 32. Matrigel 3D culture was formed following the 3D “on-top” protocol 37. Briefly, a glass-bottom plate was coated with a thick layer of freshly thawed matrigel (Corning Bioscience, Corning, NY, USA), followed by solidifying the matrigel at 37°C for 15–30 min. Cells were then plated onto the coated plate with medium containing 5% matrigel. The culture was maintained for at least 4–6 days and then ZD2-Cy5.5 (250 nM) was added to the culture medium. After 1 h, cells in the 3D matrigel were imaged with confocal laser fluorescence microscopy.
Animals
Male athymic nude mice were purchased from Case Comprehensive Cancer Center (Cleveland, OH, USA) and housed in the Animal Core Facility at Case Western Reserve University. All animal experiments were performed in accordance with the animal protocol approved by the CWRU Institutional Animal Care and Use Committee. Athymic nude male mice were subcutaneously injected with 100 μL cell suspension (4×10⁷ cells/mL) in matrigel matrix to initiate tumors. Mice with tumors of 5–8 mm in diameter were used for imaging studies.
MRI contrast agent synthesis
The ZD2 peptide sequence, TVRTSAD, was synthesized in solid phase using Fmoc chemistry. A short spacer, Fmoc-9-amino-4,7-dioxanonanoic acid (Fmoc-NH-(CH2CH2O)2-CH2CH2COOH), and 5-hexynoic acid, were also sequentially conjugated in solid phase followed by trifluoroacetic acid (TFA) treatment, which yielded ZD2-PEG-propargyl. Azido-Gd(HP-DO3A) was synthesized as reported previously38. Click chemistry reaction between ZD2-PEG-propargyl (1 Eq) and azido-Gd(HP-DO3A) (1.1 Eq) was performed in a 2:1 mixture of t-butanol and water under nitrogen following addition of [Cu(MeCN)4]PF6 (0.02 Eq) and TBTA (Tris[(1-benzyl-1H-1,2,3-triazol-4-yl)methyl]amine, 0.02 Eq). The final product, named ZD2-Gd(HP-DO3A), was purified by high performance liquid chromatography (HPLC) on an Agilent 1100 HPLC system equipped with a semi-preparative C18 column (Agilent Technologies, Santa Clara, CA, USA). The gradient of HPLC was 100% water for 10 min and 0–20% acetonitrile in water for another 20 min and 50–100% acetonitrile in water for 5 min. The Gd3+ content was measured by inductively coupled plasma optical emission spectroscopy (ICP-OES Optima 3100XL, Perkin-Elmer, Norwalk, CT, USA). ZD2-Gd(HP-DO3A) was characterized by matrix-assisted laser desorption/ionization time-of-flight (MALDI-TOF) mass spectrometry on a Voyager DE-STR spectrometer (PerSeptive BioSystems) in linear mode with R 2,5-dihydroxybenzoic acid as a matrix (M+1: 1600.2 Da; 1601.79 Da (calc.). HPLC was used to characterize the purity of the product using the same gradient for production. The fibrin-FN clot targeting contrast agent, CREKA-Gd(HP-DO3A), was synthesized with a similar approach. It was characterized by MALDI-TOF mass spectrometry (M+1: 1457.87 Da; 1459.56 Da (calc.)). The binding affinity of the contrast agent to EDB protein was measured using surface plasma resonance (SPR) according to a previous protocol 22. Briefly, different concentrations of the contrast agent were injected to a CM5 series S chip surface (GE Healthcare Life Science, Ohio, USA) coated with immobilized EDB proteins. Sensorgrams generated from the binding between contrast agents and EDB were recorded with Biacore T100 (GE healthcare, Waukesha, WI), and analyzed using the Scatchard plot. Affinity was calculated by fitting data into a linear line, with the slope of the line representing −1/Kd.
Fluorescence probe synthesis
Synthesis of the fluorescent probe, ZD2-PEG-Cy5.5 was achieved by conjugating ZD2-PEG on resin to Cy5.5 NHS ester (Lumiprobe, Hallandale Beach, FL, USA), followed by TFA treatment. The product was precipitated in cold ether and freeze dried and characterized by MALDI-TOF mass spectrometry (M=1: 1473.76 Da; 1472.78 Da (calc.)). Concentration of ZD2-PEG-Cy5.5 in PBS was quantified by measuring the absorbance at 450 nm.
Relaxivity measurement at 7T
To accurately capture T1 maps, a fast T1 mapping method was developed. This accelerated multi-slice T1-mapping method combines a saturation recovery look-locker sequence 33, 39 and spiral k-space sampling 40. The microcentrifuge tubes filled with 3.12 - 50 μM ZD2-Gd(HP-DO3A) were positioned in a mouse coil and scanned with a T1- weighted spin echo sequence and a spiral Look-Locker T1-mapping sequence. Axial images were acquired. CNR values from the T1-weighted sequence were calculated from signal from the samples subtracting surrounding water signal, and divided by noise. T1 values of the samples were reconstructed by fitting signal change during the acquisition time to the adapted T1-relaxation curve.
In vitro transmetallation
Aqueous solutions (0.1 mL, 2 mM-Gd) of ZD2-Gd(HP-DO3A) and ProHance were mixed with 0.9 mL human serum and incubated at room temperature for 2 h. The plasma mixtures were transferred to CF-10 centrifugal filters (molecular weight cut-off 10 KDa) and centrifuged at 4,000 rpm and 25°C for 150 min. During centrifugation, the solution in the upper reservoir was agitated using a pipette every 20 min for the plasma mixtures. The content of metal ions in both the upper reservoir and the filtrates was determined by ICP-OES after appropriate dilution. The degree of transmetallation of the contrast agents with Zn2+ or Cu2+ ions in the plasma was evaluated using the percentage of Zn2+ or Cu2+ ions filtered through the membrane, calculated as Zn2+(Cu2+)% = (concentration of Zn2+ or Cu2+ in the filtrates)/(total Zn2+ or Cu2+ concentration before centrifugal filtration) × 100. Human serum was used a control.
Quantitative PCR analysis of cancer cells
Total RNA were isolated from cells using RNeasy Plus Kit (Qiagen, Valencia, CA, USA) and reverse-transcribed into cDNA using high-capacity cDNA Transcription Kit (Applied Biosystems, Foster City, CA, USA). Semiquantitative real-time PCR was performed using a SYBR Green Master Mix (Life Technologies, Carlsbad, CA, USA). Primers used in this study were as follows: EDB: forward: 5′-CCTGGAGTACAATGTCAGTG-3′; reverse: 5′-GGTGGAGCCCAGGTGACA-3′. β-actin: forward, 5′-GTTGTCGACGACGAGCG-3′; reverse, 5′-AGCACAGAGCCTCGCCTTT-3′. PSMA: forward, 5′-AACTGGACCCCAGGTCTGGA-3′; reverse, 5′-GAGGATTTTATAAACCACCCGAA-3′; EGFR: forward, 5′-GGAGAACTGCCAGAAACTGACC-3′; reverse, 5′-GCCTGCAGCACACTGGTTG-3′; E-cadherin: forward, 5′-TGCCCAGAAAATGAAAAAGG-3′; reverse, 5′-GTGTATGTGGCAATGCGTTC-3′; N-cadherin: forward, 5′-ACAGTGGCCACCTACAAAGG-3′; reverse, 5′-CCGAGATGGGGTTGATAATG-3′; vimentin: forward, 5′-GAGAACTTTGCCGTTGAAGC-3′; reverse, 5′-GCTTCCTGTAGGTGGCAATC-3′; Real-time PCR were carried out on the Mastercycler realplex2 (Eppendorf, Hamburg, Germany). The relative mRNA expression levels were calculated using 2−ΔΔCT method, and normalized to the corresponding β-actin levels.
Western blotting
Tumors and normal murine tissues were homogenized in 200–500 μL T-PER buffer (Thermo Fisher Scientific, Rockford, IL, USA) mixed with protease inhibitor cocktail (Sigma-Aldrich, St. Louis, MO, USA) and the resulting lysates were centrifuged for 10 min at 10,000 g at 4°C. The supernatants were collected and protein content was determined by BCA assay (Bio-rad). Protein extracts (20 μg) were subjected to sodium dodecyl sulfate polyacrylamide gel electrophoresis (SDS-PAGE), followed by blotting onto a polyvinylidene difluoride (PVDF) membrane. The blots were washed and incubated with 1:1000 anti-EDB-FN BC-1 antibody (Abcam, Cambridge, MA, USA). Horseradish peroxidase (HRP)-conjugated anti-mouse IgG antibody was used as secondary antibody. Anti-β-actin antibody was used as loading control. The blots were developed using the ChemiDoc XRS System (Bio-rad).
Ex vivo fluorescence imaging
The targeted binding of ZD2-Cy5.5 to the prostate tumor was assessed ex vivo using Maestro FLEX In Vivo Imaging System (Caliper Life Sciences, Hopkinton, MA) using a red filter set (spectral range of 630–910 nm, 1000 ms exposure time). ZD2-Cy5.5 (10 nmol) was administered to study the in vivo distribution of ZD2-based probes. At 3 h post-injection, the mice were sacrificed to image the tumors and the organs.
Histological analysis
After fluorescence imaging of the organs, they were embedded in O.C.T and sectioned at 5 μm thickness, and mounted on to glass slides. The slides were fixed and permeabilized with cold acetone, followed by blocking with 1% BSA for 1 hour. DAPI or EDB-FN specific antibody, BC-1 (Abcam, Cambridge, MA), were applied subsequently for staining. Unbound antibodies were washed with TBS-T (0.1%). Alexa Fluor 594-conjugated goat anti-mouse IgG H&L (Abcam) was used as the secondary antibody. Prolong Gold anti-fade solution (Invitrogen, Grand Island, NY), was used to cover the slides. The stained tissue sections were imaged using confocal laser scanning microscopy.
Contrast enhanced MRI
All MRI experiments were performed on a horizontal 7T Bruker scanner (Bruker Biospin Co., Billerica, MA). Imaging experiments were performed when the tumor size reached 5–8 mm in diameter. ZD2-Gd(HP-DO3A) was administered intravenously at the dose of 0.1 mmol/kg after acquiring pre-contrast images. Post-contrast images were obtained at 10 min interval up to 30 min. The axial slices of mouse at the tumor location were acquired using T1-weighted spin echo sequence with the following parameters: field of view (FOV): 3 cm; slice thickness: 1.2 mm; interslice distance: 1.2 mm; TR: 500 ms, TE: 8.1 ms; flip angle: 90°; average: 2; matrix size: 128 × 128. Contrast-to-noise ratio (CNR) at each time point was calculated by subtraction of the average signal intensity in the tumor and muscle, divided by the standard deviation of image noise. ProHance® (gadoteridol) was used as a control in the imaging experiments.
T1 mapping
The following imaging parameters were used for T1 mapping methods: flip angle 10°; echo time 2.09 ms; slice thickness 1 mm; number of average 1; field of view 3 × 3 cm2; matrix size 128 × 128. For each slice, 50 images that covered 5 s of the saturation recovery curve were acquired within an interval of 100 ms. Proton density (M0) images were acquired with repetition time (TR) of 2s. Cartesian MRSLL images were also acquired as a validation of spiral MRSLL method. Center 64 k-space lines were acquired in Cartesian method as described previously 33. Other acquisition parameters were the same as spiral MRSLL.
In vivo transmetallation
Balb/c mice (Charles River Laboratories, Wilmington, MA, USA) were randomly divided into groups of ZD2-Gd(HP-DO3A) and ProHance (n = 5) and placed in the metabolism cages, 48 hours prior to injection. After acclimatization, the mice were injected with either ZD2-Gd(HP-DO3A) or ProHance at a dose of 0.1 mmol-Gd/kg via tail vein. Urine samples were collected at 12 h pre-injection, and then 8, 24, 48, and 72 h post-injection from the metabolic box. The collected urine samples were centrifuged at 4,000 rpm for 15 min. The concentration of Gd3+, Zn2+, Cu2+, and Ca2+ in the supernatant of the urine samples was determined by ICP-OES after appropriate dilutions.
Biodistribution
PC3 tumor-bearing athymic nude mice (sixteen mice) were randomly divided into 4 groups (four mice each group). Then two of the groups were injected with either ZD2-Gd(HP-DO3A) or ProHance at a dose of 0.1 mmol-Gd/kg via tail vein. The animals were sacrificed at 2 and 7 days after injection. The blood and tissue samples, including brain, femur, heart, lung, liver, muscle, spleen, and kidney, were collected and weighed. The tissue samples were then cut into small pieces and mixed with ultra-pure nitric acid (1.0 mL, 70%, EMD, Gibbstown, NJ). The tissue samples were liquefied within 2 weeks and the solution was transferred to a centrifuge tube and centrifuged at 14,000 rpm for 15 min. The supernatant (0.2 mL) was diluted with 9.8 mL deionized water and further centrifuged at 14,000 rpm for 15 min. The Gd3+ concentration in the final supernatant was measured by ICP-OES. The average Gd3+ content in each organ or tissue was calculated from the measured Gd3+. In addition, 8 LNCaP tumor-bearing mice were also tested with similar injections of ZD2-Gd(HP-DO3A) and ProHance (n = 4). The Gd3+ content in different organ/tissues was calculated as the percentage of injected dose per gram of organ/tissues (% Dose/g).
Acknowledgments
This research was supported in part by the National Institute of Health grants R01 EB00489 (ZRL) and R43 CA199826 (YL). We thank Dr. Amita M. Vaidya for editing and proofreading the manuscript.
Abbreviations
- BCA assay
bicinchoninic acid assay
- CNR
contrast-to-noise ratio
- EDB-FN
extradomain-B fibronectin
- EGFR
epidermal growth factor receptor
- EMT
epithelial-to-mesenchymal transition
- HPLC
high-performance liquid chromatography
- HRP
horseradish peroxidase
- IHC
immunohistochemistry
- MALDI-TOF
matrix-assisted laser desorption/ionization time-of-flight mass spectrometry
- MRI
magnetic resonance imaging
- PSA
prostate specific antigen
- PSMA
prostate-specific membrane antigen
- PVDF
polyvinylidene difluoride
- SDS-PAGE
sodium dodecyl sulfate polyacrylamide gel electrophoresis
- SPR
surface plasma resonance
References
- 1.Roobol M. Perspective: Enforce the clinical guidelines. Nature. 2015;528:S123. doi: 10.1038/528S123a. [DOI] [PubMed] [Google Scholar]
- 2.Qaseem A, Barry MJ, Denberg TD, Owens DK, Shekelle P Clinical Guidelines Committee of the American College of P. Screening for prostate cancer: a guidance statement from the Clinical Guidelines Committee of the American College of Physicians. Ann Intern Med. 2013;158:761–9. doi: 10.7326/0003-4819-158-10-201305210-00633. [DOI] [PubMed] [Google Scholar]
- 3.Siegel R, Naishadham D, Jemal A. Cancer statistics, 2012. CA Cancer J Clin. 2012;62:10–29. doi: 10.3322/caac.20138. [DOI] [PubMed] [Google Scholar]
- 4.Glass AS, Cary KC, Cooperberg MR. Risk-based prostate cancer screening: who and how? Curr Urol Rep. 2013;14:192–8. doi: 10.1007/s11934-013-0319-8. [DOI] [PubMed] [Google Scholar]
- 5.Wilt TJ, Ahmed HU. Prostate cancer screening and the management of clinically localized disease. BMJ. 2013;346:f325. doi: 10.1136/bmj.f325. [DOI] [PMC free article] [PubMed] [Google Scholar]
- 6.Shah RB. Current perspectives on the Gleason grading of prostate cancer. Arch Pathol Lab Med. 2009;133:1810–6. doi: 10.5858/133.11.1810. [DOI] [PubMed] [Google Scholar]
- 7.Heijnsdijk EA, der Kinderen A, Wever EM, Draisma G, Roobol MJ, de Koning HJ. Overdetection, overtreatment and costs in prostate-specific antigen screening for prostate cancer. Br J Cancer. 2009;101:1833–8. doi: 10.1038/sj.bjc.6605422. [DOI] [PMC free article] [PubMed] [Google Scholar]
- 8.Melnikow J, LeFevre M, Wilt TJ, Moyer VA. Counterpoint: Randomized trials provide the strongest evidence for clinical guidelines: The US Preventive Services Task Force and Prostate Cancer Screening. Med Care. 2013;51:301–3. doi: 10.1097/MLR.0b013e31828a67d3. [DOI] [PubMed] [Google Scholar]
- 9.Haffner J, Lemaitre L, Puech P, Haber GP, Leroy X, Jones JS, Villers A. Role of magnetic resonance imaging before initial biopsy: comparison of magnetic resonance imaging-targeted and systematic biopsy for significant prostate cancer detection. BJU international. 2011;108:E171–8. doi: 10.1111/j.1464-410X.2011.10112.x. [DOI] [PubMed] [Google Scholar]
- 10.Rosenkrantz AB, Taneja SS. Prostate MRI can reduce overdiagnosis and overtreatment of prostate cancer. Academic radiology. 2015;22:1000–6. doi: 10.1016/j.acra.2015.02.006. [DOI] [PubMed] [Google Scholar]
- 11.Kaspar M, Zardi L, Neri D. Fibronectin as target for tumor therapy. Int J Cancer. 2006;118:1331–9. doi: 10.1002/ijc.21677. [DOI] [PubMed] [Google Scholar]
- 12.Inufusa H, Nakamura M, Adachi T, Nakatani Y, Shindo K, Yasutomi M, Matsuura H. Localization of oncofetal and normal fibronectin in colorectal cancer. Correlation with histologic grade, liver metastasis, and prognosis. Cancer. 1995;75:2802–8. doi: 10.1002/1097-0142(19950615)75:12<2802::aid-cncr2820751204>3.0.co;2-o. [DOI] [PubMed] [Google Scholar]
- 13.Menzin AW, Loret de Mola JR, Bilker WB, Wheeler JE, Rubin SC, Feinberg RF. Identification of oncofetal fibronectin in patients with advanced epithelial ovarian cancer: detection in ascitic fluid and localization to primary sites and metastatic implants. Cancer. 1998;82:152–8. doi: 10.1002/(sici)1097-0142(19980101)82:1<152::aid-cncr19>3.0.co;2-1. [DOI] [PubMed] [Google Scholar]
- 14.Freire-de-Lima L, Gelfenbeyn K, Ding Y, Mandel U, Clausen H, Handa K, Hakomori SI. Involvement of O-glycosylation defining oncofetal fibronectin in epithelial-mesenchymal transition process. Proc Natl Acad Sci U S A. 2011;108:17690–5. doi: 10.1073/pnas.1115191108. [DOI] [PMC free article] [PubMed] [Google Scholar]
- 15.Gao D, Vahdat LT, Wong S, Chang JC, Mittal V. Microenvironmental regulation of epithelial-mesenchymal transitions in cancer. Cancer Res. 2012;72:4883–9. doi: 10.1158/0008-5472.CAN-12-1223. [DOI] [PMC free article] [PubMed] [Google Scholar]
- 16.Kong D, Banerjee S, Ahmad A, Li Y, Wang Z, Sethi S, Sarkar FH. Epithelial to mesenchymal transition is mechanistically linked with stem cell signatures in prostate cancer cells. Plos One. 2010;5:e12445. doi: 10.1371/journal.pone.0012445. [DOI] [PMC free article] [PubMed] [Google Scholar]
- 17.Nauseef JT, Henry MD. Epithelial-to-mesenchymal transition in prostate cancer: paradigm or puzzle? Nat Rev Urol. 2011;8:428–39. doi: 10.1038/nrurol.2011.85. [DOI] [PMC free article] [PubMed] [Google Scholar]
- 18.Sonmez H, Suer S, Karaarslan I, Baloglu H, Kokoglu E. Tissue fibronectin levels of human prostatic cancer, as a tumor marker. Cancer Biochem Biophys. 1995;15:107–10. [PubMed] [Google Scholar]
- 19.Jankovic MM, Kosanovic MM. Fibronectin pattern in benign hyperplasia and cancer of the prostate. Dis Markers. 2008;25:49–58. doi: 10.1155/2008/308420. [DOI] [PMC free article] [PubMed] [Google Scholar]
- 20.Albrecht M, Renneberg H, Wennemuth G, Moschler O, Janssen M, Aumuller G, Konrad L. Fibronectin in human prostatic cells in vivo and in vitro: expression, distribution, and pathological significance. Histochem Cell Biol. 1999;112:51–61. doi: 10.1007/s004180050391. [DOI] [PubMed] [Google Scholar]
- 21.Han Z, Lu Z-R. Targeting Fibronectin for Cancer Imaging and Therapy. J Mater Chem B. 2016 doi: 10.1039/C6TB02008A. [DOI] [PMC free article] [PubMed] [Google Scholar]
- 22.Han Z, Zhou Z, Shi X, Wang J, Wu X, Sun D, Chen Y, Zhu H, Magi-Galluzzi C, Lu ZR. EDB Fibronectin Specific Peptide for Prostate Cancer Targeting. Bioconjug Chem. 2015;26:830–8. doi: 10.1021/acs.bioconjchem.5b00178. [DOI] [PubMed] [Google Scholar]
- 23.Sun Y, Kim HS, Park J, Li M, Tian L, Choi Y, Choi BI, Jon S, Moon WK. MRI of breast tumor initiating cells using the extra domain-B of fibronectin targeting nanoparticles. Theranostics. 2014;4:845–57. doi: 10.7150/thno.8343. [DOI] [PMC free article] [PubMed] [Google Scholar]
- 24.Zhou Z, Wu X, Kresak A, Griswold M, Lu ZR. Peptide targeted tripod macrocyclic Gd(III) chelates for cancer molecular MRI. Biomaterials. 2013;34:7683–93. doi: 10.1016/j.biomaterials.2013.06.057. [DOI] [PMC free article] [PubMed] [Google Scholar]
- 25.Sobel RE, Sadar MD. Cell lines used in prostate cancer research: a compendium of old and new lines--part 1. The Journal of urology. 2005;173:342–59. doi: 10.1097/01.ju.0000141580.30910.57. [DOI] [PubMed] [Google Scholar]
- 26.Polyak K, Weinberg RA. Transitions between epithelial and mesenchymal states: acquisition of malignant and stem cell traits. Nat Rev Cancer. 2009;9:265–73. doi: 10.1038/nrc2620. [DOI] [PubMed] [Google Scholar]
- 27.Locher R, Erba PA, Hirsch B, Bombardieri E, Giovannoni L, Neri D, Durkop H, Menssen HD. Abundant in vitro expression of the oncofetal ED-B-containing fibronectin translates into selective pharmacodelivery of (131)I-L19SIP in a prostate cancer patient. Journal of cancer research and clinical oncology. 2014;140:35–43. doi: 10.1007/s00432-013-1538-6. [DOI] [PMC free article] [PubMed] [Google Scholar]
- 28.Zhou Z, Qutaish M, Han Z, Schur RM, Liu Y, Wilson DL, Lu ZR. MRI detection of breast cancer micrometastases with a fibronectin-targeting contrast agent. Nat Commun. 2015;6:7984. doi: 10.1038/ncomms8984. [DOI] [PMC free article] [PubMed] [Google Scholar]
- 29.Wu X, Yu G, Lindner D, Brady-Kalnay SM, Zhang Q, Lu ZR. Peptide targeted high-resolution molecular imaging of prostate cancer with MRI. American journal of nuclear medicine and molecular imaging. 2014;4:525–36. [PMC free article] [PubMed] [Google Scholar]
- 30.Zhou Z, Lu ZR. Gadolinium-based contrast agents for magnetic resonance cancer imaging. Wiley interdisciplinary reviews Nanomedicine and nanobiotechnology. 2013;5:1–18. doi: 10.1002/wnan.1198. [DOI] [PMC free article] [PubMed] [Google Scholar]
- 31.Runge VM. Safety of the Gadolinium-Based Contrast Agents for Magnetic Resonance Imaging, Focusing in Part on Their Accumulation in the Brain and Especially the Dentate Nucleus. Invest Radiol. 2016;51:273–9. doi: 10.1097/RLI.0000000000000273. [DOI] [PubMed] [Google Scholar]
- 32.Tan M, Burden-Gulley SM, Li W, Wu X, Lindner D, Brady-Kalnay SM, Gulani V, Lu ZR. MR molecular imaging of prostate cancer with a peptide-targeted contrast agent in a mouse orthotopic prostate cancer model. Pharm Res. 2012;29:953–60. doi: 10.1007/s11095-011-0635-y. [DOI] [PMC free article] [PubMed] [Google Scholar]
- 33.Jiang K, Li W, Li W, Jiao S, Castel L, Van Wagoner DR, Yu X. Rapid multislice T1 mapping of mouse myocardium: Application to quantification of manganese uptake in alpha-Dystrobrevin knockout mice. Magn Reson Med. 2015;74:1370–9. doi: 10.1002/mrm.25533. [DOI] [PMC free article] [PubMed] [Google Scholar]
- 34.Thomsen HS, Morcos SK. Contrast media and the kidney: European society of urogenital radiology (ESUR) guidelines. Brit J Radiol. 2003;76:513–518. doi: 10.1259/bjr/26964464. [DOI] [PubMed] [Google Scholar]
- 35.Kanda T, Fukusato T, Matsuda M, Toyoda K, Oba H, Kotoku J, Haruyama T, Kitajima K, Furui S. Gadolinium-based Contrast Agent Accumulates in the Brain Even in Subjects without Severe Renal Dysfunction: Evaluation of Autopsy Brain Specimens with Inductively Coupled Plasma Mass Spectroscopy. Radiology. 2015;276:228–232. doi: 10.1148/radiol.2015142690. [DOI] [PubMed] [Google Scholar]
- 36.Murata N, Gonzalez-Cuyar LF, Murata K, Fligner C, Dills R, Hippe D, Maravilla KR. Macrocyclic and Other Non–Group 1 Gadolinium Contrast Agents Deposit Low Levels of Gadolinium in Brain and Bone Tissue: Preliminary Results From 9 Patients With Normal Renal Function. Invest Radiol. 2016;51:447–453. doi: 10.1097/RLI.0000000000000252. [DOI] [PubMed] [Google Scholar]
- 37.Lee GY, Kenny PA, Lee EH, Bissell MJ. Three-dimensional culture models of normal and malignant breast epithelial cells. Nat Methods. 2007;4:359–65. doi: 10.1038/nmeth1015. [DOI] [PMC free article] [PubMed] [Google Scholar]
- 38.Mastarone DJ, Harrison VS, Eckermann AL, Parigi G, Luchinat C, Meade TJ. A modular system for the synthesis of multiplexed magnetic resonance probes. J Am Chem Soc. 2011;133:5329–37. doi: 10.1021/ja1099616. [DOI] [PMC free article] [PubMed] [Google Scholar]
- 39.Li W, Griswold M, Yu X. Rapid T1 mapping of mouse myocardium with saturation recovery Look-Locker method. Magnetic resonance in medicine: official journal of the Society of Magnetic Resonance in Medicine/Society of Magnetic Resonance in Medicine. 2010;64:1296–303. doi: 10.1002/mrm.22544. [DOI] [PMC free article] [PubMed] [Google Scholar]
- 40.Ahn CB, Kim JH, Cho ZH. High-speed spiral-scan echo planar NMR imaging-I. IEEE Trans Med Imaging. 1986;5:2–7. doi: 10.1109/TMI.1986.4307732. [DOI] [PubMed] [Google Scholar]