Abstract
Background:
The new simplified thumb ossification composite index (TOCI) based on ossification of the thumb epiphyses and adductor sesamoid has demonstrated simplicity, excellent reliability, and high accuracy for predicting skeletal maturity, comparable with the Sanders simplified skeletal maturity system (SSMS). It was our belief that, because the terminology of the SSMS system has been commonly used for skeletal maturity prediction in idiopathic scoliosis in publications over the past decade, the clinical applicability of the TOCI system would increase if the stages in the 2 systems were found to be interchangeable and highly correlated.
Methods:
Hand radiographs of 125 premenarchal girls with newly diagnosed adolescent idiopathic scoliosis who had been followed longitudinally until skeletal maturity were all scored with use of the Tanner-Whitehouse III (TW3) system (stages E through I), the TOCI, and the SSMS. The scores for the epiphyses of the ulnar 4 digits were compared with those for the thumb and correlated with the timing of peak height velocity. Correlations were analyzed with the chi-square test and Cramer V and Somers delta correlations.
Results:
Six hundred and forty-five hand radiographs (an average of 5 for each girl with idiopathic scoliosis) and 11,517 epiphyses were scored. The rate of concordance between TW3 stages F, G, and I for the thumb proximal phalangeal epiphysis and those for all of the epiphyses of the ulnar 4 digits were 72.5%, 72.5%, and 89.9%, respectively. The overall concordance rate (including all epiphyses) was 71.3%, with a very high Cramer V correlation and significance (p < 0.01). High interchangeability was demonstrated for the TOCI and SSMS stages, supported by a high Somers delta correlation (>0.8) with significance (p < 0.05).
Conclusions:
The TOCI is highly practical for clinical use, and its stages are highly interchangeable with those of the SSMS.
Clinical Relevance:
The TOCI could serve as a simplified “marker” of skeletal maturity on hand radiographs and minimize the learning-curve problems associated with the SSMS in a busy clinical practice.
An ideal skeletal maturity assessment system should be simple and easy to learn, with good reliability and validated accuracy when compared with the well-established systems for predicting skeletal maturity for important clinical decisions. Sanders et al. proposed the digital skeletal age (DSA) score1 and then the simplified skeletal maturity system (SSMS)2, derived from the original Tanner-Whitehouse III radius, ulna and short bone (RUS)—or TW3—method, and these systems were recognized widely as the gold standards for clinical management of idiopathic scoliosis. In a recent multicenter validation study, the SSMS was found to be associated with a steep learning curve for less experienced users3 and thus might have limitations for rapid clinical usage.
We have found the new simplified thumb ossification composite index (TOCI), based on ossification of the thumb epiphyses and adductor sesamoid, to be simple to use, with excellent reliability and accuracy in predicting skeletal maturity of patients with idiopathic scoliosis4.
In previous studies5,6, the radiographic appearances of the epiphyses of the distal and proximal phalanges of the thumb were shown to be similar to those of the ulnar 4 digits during the peripubertal period. However, the accuracy of using the ossification patterns of the thumb epiphyses by themselves to predict the epiphyseal changes in the remaining digits has not been systematically studied either qualitatively or quantitatively to our knowledge. It was our belief that the clinical applicability of the TOCI would increase substantially if the different stages of the system were shown to be interchangeable with those of established systems and found to correlate with them in a proper validation study.
The objectives of this study were (1) to compare TOCI and TW3 staging of the ossification pattern of the epiphyses of the distal and proximal phalanges and adductor sesamoid of the thumb with the TW3 descriptors of the ossification pattern of the epiphyses of all 4 ulnar digits and (2) to validate the stage-to-stage correlation of the TOCI with the established Sanders SSMS. Our hypotheses were that the TOCI (1) is highly reliable in predicting the TW3 stages of all digital epiphyses in the hand and (2) has high stage-to-stage correlation with the Sanders SSMS.
Materials and Methods
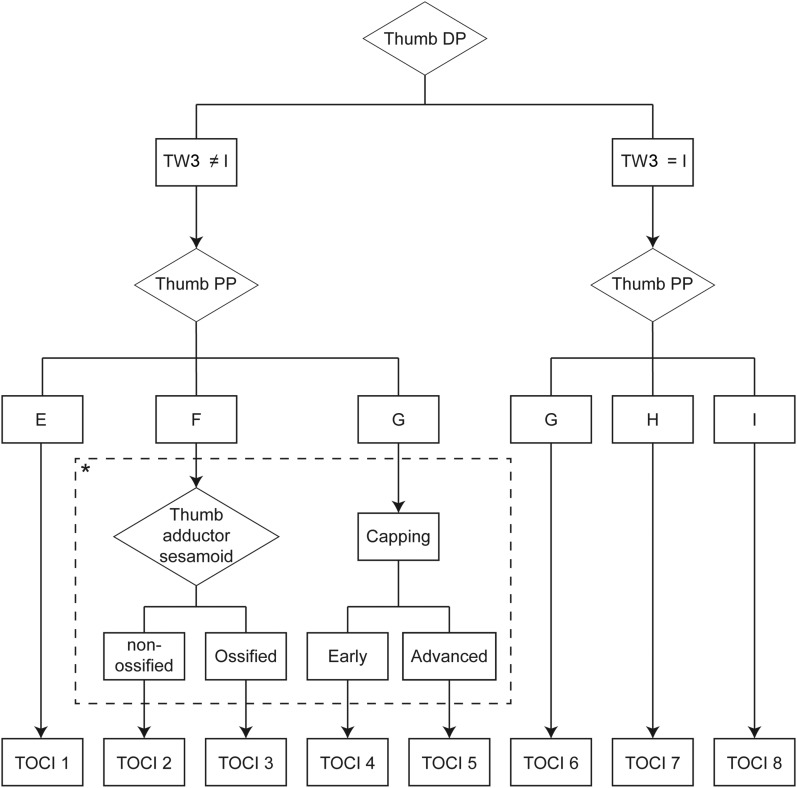
The present study included a previously reported cohort4 of 125 skeletally immature girls with idiopathic scoliosis who had been followed at a minimum of 5 intervals averaging 6 months each during the peripubertal growth period until skeletal maturity was confirmed by radiographic evidence of completed physeal closure of the distal radial epiphysis. At each visit, posteroanterior radiographs of the left hand were obtained with use of the original TW3 protocol. All epiphyses (distal phalangeal, middle phalangeal, proximal phalangeal, and metacarpal) of all 5 digits of each hand were scored with the TW3 system (stages E through I) on radiographs. Figure 1 shows the TW3 infrastructure in relation to the different components of the TOCI. The same set of hand radiographs was scored with the TOCI system by the principal author. In addition, another orthopaedic surgeon, with good experience with and published documentation of using the TW3 staging system, scored the same set of radiographs blindly with the SSMS method7.
Fig. 1.
TW3 stages of the distal and proximal phalangeal epiphyses of the thumb (Thumb DP and Thumb PP) in relation to the different TOCI stages. According to the TW3 system, stage E (uncovered) = width of the epiphysis not wider than that of the metaphysis, stage F (covered) = width of the epiphysis wider than that of the metaphysis but without capping, stage G (capping) = spread of the lower border of the epiphysis around the metaphysis, stage H (partial fusion) = partial fusion of the epiphysis with the presence of both whitish and dark bands on the physis, and stage I (fusion) = completed fusion of the epiphysis with elimination of the dark bands on the physis. The subsection enclosed within the dotted lines and marked by the asterisk represents expansion (refinement) of the TW3 staging system with use of the TOCI staging system.
Correlation analysis was conducted to (1) determine the probability of TOCI and TW3 staging of the thumb epiphyses predicting the TW3 status (stages E through I) of the epiphyses of the ulnar 4 digits and (2) carry out a stage-to-stage comparison of the TOCI and SSMS at different periods relative to the timing of peak height velocity (6 to 12 months before peak height velocity, at peak height velocity, and ≥12 months after peak height velocity) as determined from a previous study4.
Statistical Analysis
The percentages of hand radiographs with each TW3 stage (E through I) at the distal, middle, and proximal phalanges and the metacarpal bone of the ulnar 4 digits were tabulated against the corresponding TOCI stages. The chi-square test and Cramer V correlation were used to evaluate the association between the TW3 stages of the epiphyses of the thumb and those of the ulnar 4 digits.
Descriptive statistics, including the mean, median, standard deviation, and 95% confidence interval were calculated for both the TOCI and the SSMS. The percentages of hand radiographs on which the TOCI stage corresponded with the SSMS stage, and vice versa, and the variation of these stages across the entire peripubertal period according to the timing of the relative peak height velocity were tabulated to produce different charts. Somers delta correlation was conducted to determine the interchangeability of stages between the TOCI and SSMS.
Results
Overall, 11,517 small-hand-bone epiphyses viewed on a total of 645 hand radiographs (an average of 5 per girl) collected consecutively from 125 premenarchal girls with newly diagnosed idiopathic scoliosis were used for scoring after exclusion of a small number of epiphyses with unsatisfactory positioning or with other congenital anomalies.
Correlation of Staging of Thumb Epiphyses with Staging of Epiphyses of Ulnar 4 Digits
The chi-square test showed significant correlation between the staging of the thumb epiphyses and that of the ulnar 4 digits (p < 0.01). The Cramer V correlation also demonstrated moderately to very highly positive correlations (ranging from 0.480 to 0.766) between the stages of the thumb and those of the ulnar 4 digits (p < 0.01).
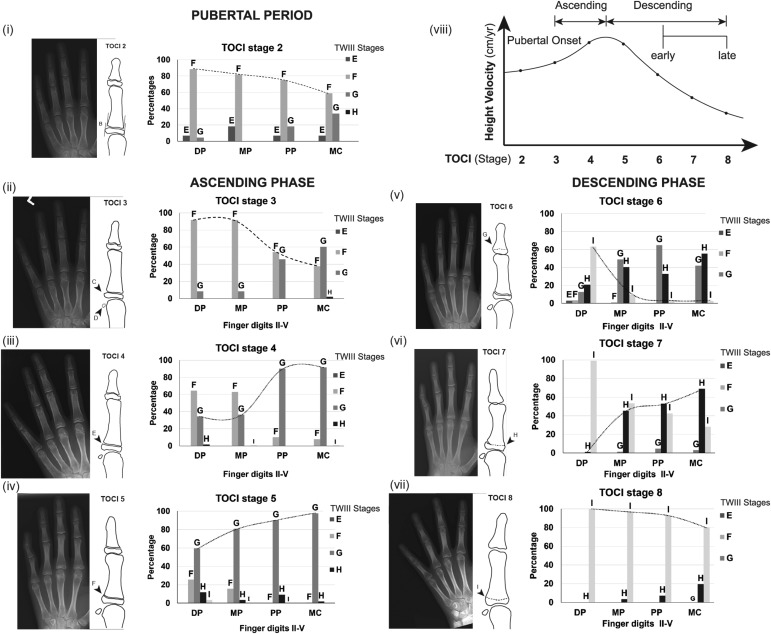
The results of the comparison of the TOCI staging of the thumb with the TW3 staging of the distal, middle, and proximal phalangeal and metacarpal epiphyses of the ulnar 4 digits are summarized in Table E-1 and Figures 2 and E-1 (see Appendix).
Fig. 2.
Percentages of the key TW3 stages of the ulnar 4 digital epiphyses corresponding with each TOCI stage. The hand radiographs illustrate the TW3 stage (linked by dotted lines) of the corresponding epiphyses shown in the respective bar charts. The letters B through I on the drawings of the thumb refer to the key radiographic features of maturity indicators represented by the different TOCI stages described in our previous article4.The diagram at the upper right (viii) is included for easier referencing to the corresponding growth phase at puberty. DP, MP, and PP = distal, middle, and proximal phalangeal, and MC = metacarpal.
The percentages of hand radiographs on which the TW3 stage for the thumb corresponded with the TW3 stage for the ulnar 4 digits are shown in Table I for the different stages of the 2 systems. An overall 71.3% concordance rate between the staging of the thumb epiphyses and that of the corresponding epiphyses of the ulnar 4 digits was observed (Table I).
TABLE I.
Percentages of Key TW3 Stages of Epiphyses of Ulnar 4 Digits Versus Stages Based on Thumb Epiphyses*
| Thumb | Ulnar 4 Digits: Percentages with Same TW3 Stage as Thumb† | |||||
| TOCI | TW3 | DP | MP | PP | MC | Mean |
| 2 | PP: F (sesamoid not ossified) | 88.6 | 81.8 | 75.0 | 59.1 | 76.1 |
| 3 | PP: F (sesamoid ossified) | 91.7 | 91.7 | 54.2 | 37.5 | 68.8 |
| 4 | PP: G (early) | 34.3 | 36.4 | 90.0 | 91.4 | 63.0 |
| 5 | PP: G (advanced) | 59.4 | 80.7 | 90.1 | 97.6 | 82.0 |
| 6 | DP: I | 63.3 | — | — | — | 63.3 |
| 7 | PP: H | — | 45.3 | 53.2 | 69.0 | 55.8 |
| 8 | PP: I | — | 96.6 | 92.9 | 80.2 | 89.9 |
| 71.3 (overall) | ||||||
DP = distal phalanx, MP = middle phalanx, PP = proximal phalanx, and MC = metacarpal bone.
All numerical values were rounded up to the nearest 0.1.
Stage-to-Stage Correlation of the TOCI and SSMS
Interchangeability of the SSMS and TOCI stages was shown in relation to the TW3 staging structure (Table II) at each of the essential pubertal stages, which were comparable between the 2 systems.
TABLE II.
Comparison of SSMS and TOCI Systems According to TW3 Stages Corresponding with Each at Different Pubertal Stages
| TW3 Stage* | |||||||
| Pubertal Stage | Skeletal Maturity Stage | DP | MP | PP | MC | AS | Radius |
| SSMS | |||||||
| Juvenile slow | SSMS 1 | E | E | E | E | Ignored | |
| Preadolescent slow | SSMS 2 (early) | F | F | F | F | Ignored | |
| Preadolescent slow | SSMS 2 (late†) | G | G | G | G | Ignored | |
| Adolescent rapid—early | SSMS 3 | G | G | G | G | Ignored | |
| Adolescent rapid—late | SSMS 4 | H | G | G | G | Ignored | |
| Adolescent steady—early | SSMS 5 | I | G | G | G | Ignored | |
| Adolescent steady—late | SSMS 6 | I | H | H | H | Ignored | |
| Early mature | SSMS 7 | I | I | I | I | Non-I | |
| Mature | SSMS 8 | I | I | I | I | I | |
| TOCI | |||||||
| Juvenile | TOCI 1 | Non-I | E | − | Ignored | ||
| Prepubertal | TOCI 2 | Non-I | F | + | Ignored | ||
| Pubertal onset | TOCI 3 | Non-I | F | + | Ignored | ||
| Ascending | TOCI 4 | Non-I | G (early) | + | Ignored | ||
| Peak height velocity | TOCI 5 | Non-I | G (advanced) | + | Ignored | ||
| Early descending | TOCI 6 | I | G (advanced) | + | Ignored | ||
| Mid-descending | TOCI 7 | I | H | + | Ignored | ||
| Late descending | TOCI 8 | I | I | + | Non-I | ||
| End | I | ||||||
Only the key main dominant TW3 stages (E through I) are shown. DP = epiphysis of the distal phalanx (all 5 digits for SSMS and thumb for TOCI), MP = epiphysis of the middle phalanx in the 2nd through 5th digits, PP = epiphysis of the proximal phalanx (all 5 digits for SSMS and thumb for TOCI), MC = metacarpal bone of all 5 digits, AS = adductor sesamoid of thumb, Non-I = any TW3 stage except stage I, − = non-ossified, and + = ossified.
TW3 stage G occurs in most but not all digital epiphyses.
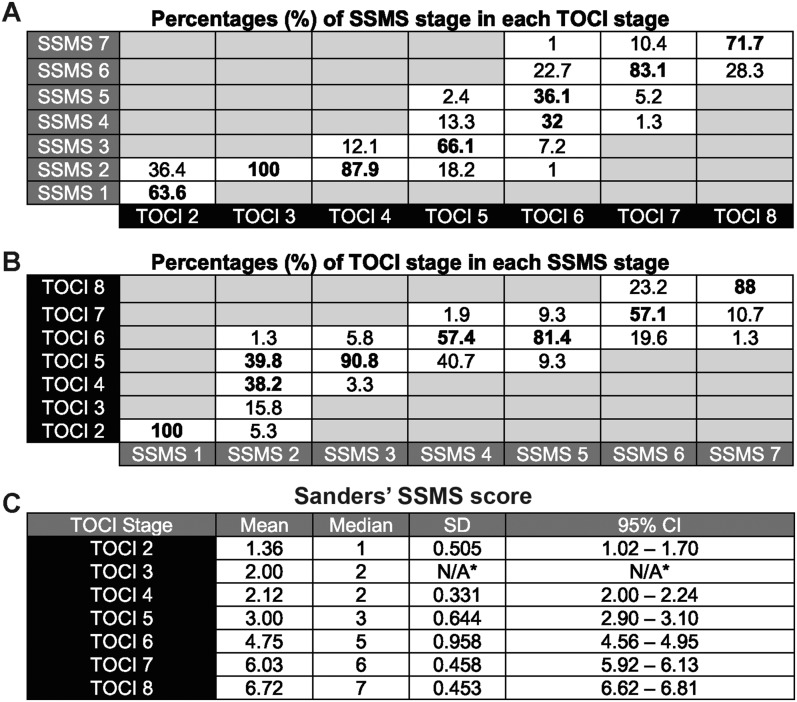
The exact distributions of the SSMS stages versus the TOCI stages and vice versa are summarized in Figure 3. The Somers delta correlation was shown to be 0.887 (p < 0.05) for the ability of the TOCI stages to predict the SSMS stages and 0.844 (p < 0.05) for the ability of the SSMS stages to predict the TOCI stages.
Fig. 3.
Percentages of SSMS-stage ratings matching with each TOCI stage (Fig. 3-A), percentages of TOCI-stage ratings matching with each SSMS stage (Fig. 3-B), and distribution of the SSMS scores in each TOCI-stage group (Fig. 3-C). The bolded values indicate the dominant stages. SD = standard deviation, and CI = confidence interval. *N/A = not applicable because SSMS stage 2 was consistently given to all hand radiographs rated as TOCI stage 3.
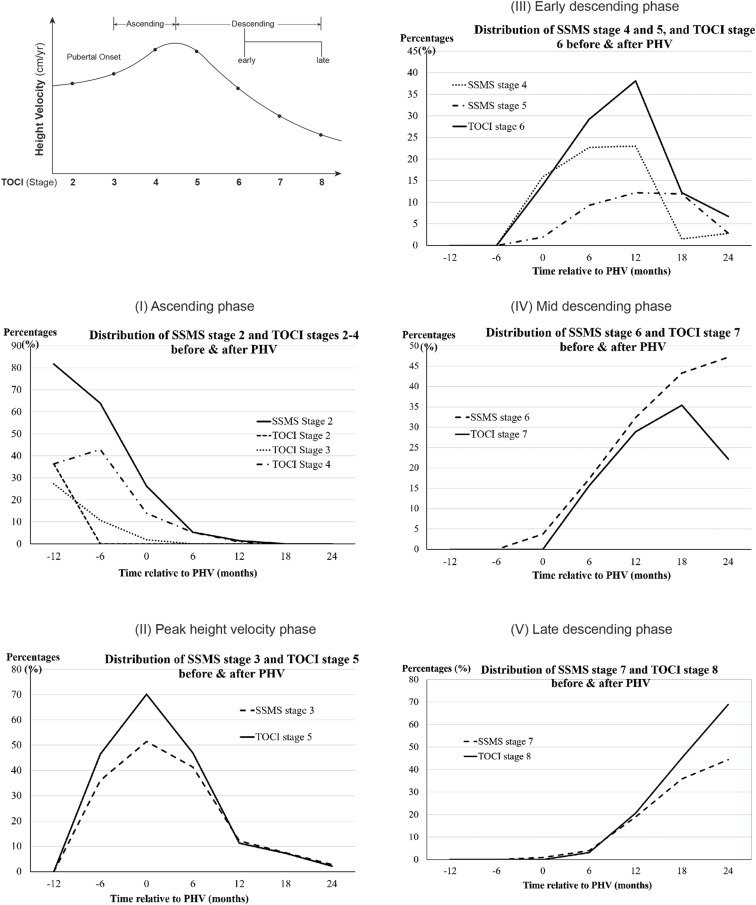
The results of the stage-to-stage comparison between the TOCI and SSMS at different peripubertal time points relative to the timing of peak height velocity are summarized in Figure 4.
Fig. 4.
Distributions of SSMS and TOCI stages at various pubertal phases relative to the timing of the peak height velocity (PHV).
Discussion
Our longitudinal study of 125 skeletally immature girls with idiopathic scoliosis who each had a minimum of 5 consecutive hand radiographs made at 6 monthly intervals demonstrated that the ossification and fusion patterns of the distal and proximal phalangeal epiphyses of the thumb have a highly significant correlation with those of the ulnar 4 digits as staged with the TW3 system (>70% concordance rate). These findings were in agreement with the classic studies of the TW3 method by Malina and Beunen6 and by Fishman5.
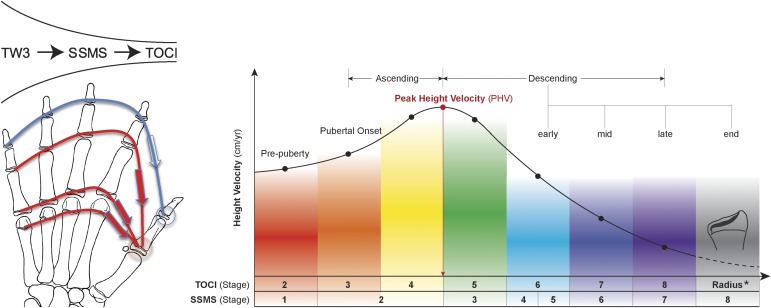
Using the same TW3 descriptors (stages E through I) to compare the TOCI system (thumb) and SSMS (all digits), we found that the TW3 staging structure associated with the TOCI corresponded well with that associated with the SSMS, as shown in Table II. The actual TOCI and SSMS stages are reasonably interchangeable across the different key pubertal stage (Figs. 3 and 4), as demonstrated by the strong Somers delta correlation and high stage-to-stage concordance rate. Thus, a new simplified guideline for interchangeable use of the SSMS and TOCI (Fig. 5; also see Video 1 in our previous study4) to assess and predict the state of skeletal maturity in the peripubertal period, including the timing of peak height velocity and growth remaining, can be formulated.
Fig. 5.
Summary of the relationships between the stages of the TOCI and SSMS systems with reference to the pubertal diagram.
Stage-to-Stage Matching of TOCI and SSMS
Pre-Peak Height Velocity Period
This period is best represented by the transition from TW3 stage E to F and then to G (the ossification process from uncovered to covered and then to capped epiphyses occurring in most of the epiphyses of all 5 digits2). This corresponds to SSMS stage 22 and TOCI stages 2, 3, and 4 and was evidenced by the high concordance between the key TW3 stages for the thumb proximal phalangeal epiphysis and the stages of the epiphyses of the ulnar 4 digits (76.1%, 68.8%, and 63.0%; Fig. 2 [i, ii, and iii] and Table I) in this period.
Stage-to-stage correlation indicated that SSMS stage 1 matched with TOCI stage 2 with a high concordance rate (63.6%) (Fig. 3-A), and TOCI stage 2 was able to predict 100% of the SSMS stage-1 ratings (Fig. 3-B). SSMS stage 2 can be represented through the use of TOCI stages 3 and 4, with high concordance rates of 100% and 87.9%, respectively. In contrast, a total of 54% of the TOCI stage-3 and 4 ratings could be matched with SSMS stage 2.
Our findings also suggest that the TOCI system can provide more precise staging than the SSMS (TOCI stages 3 and 4 versus SSMS stage 2) for predicting the growth potential in the ascending phase of puberty just before the peak height velocity, a period of critical importance for starting early bracing for appropriate cases of idiopathic scoliosis with a higher probability of success in preventing curve progression.
Peak Height Velocity Period
This period is best represented by TW3 stage G (dominant capping appearance in the majority of the epiphyses of all 5 digits2,3), corresponding to SSMS stage 32 and TOCI stage 5. Advanced capping (TW3 stage G) of the thumb proximal phalanx also matched with advanced capping (TW3 stage G) in all 4 ulnar digits, with a concordance rate of 82.0% (Fig. 2 [iv] and Table I. Stage-to-stage correlation confirmed a high rate of concordance (66.1%) between SSMS stage 3 and TOCI stage 5 (Fig. 3-A), and 90.8% of the TOCI stage-5 ratings matched with SSMS stage 3 (Fig. 3-B).
The percentages of both stages peaked at the time of peak height velocity (Fig. 4 [II]), with TOCI stage 5 demonstrating a higher association and sensitivity4. The lower sensitivity of SSMS stage 3 might be attributed to the fact that the criterion for differentiating SSMS stage 2 from SSMS stage 3 is more ambiguous (a preponderance of capping of most digital epiphyses2) and subjective (with disagreement in the judgement of whether ≥6 epiphyses were capped in the distal and middle phalanges in one study3). This may also be reflected by the observation that 39.8% of the TOCI stage-5 ratings were found to match with SSMS stage 2 in this study (Fig. 3-B). TOCI stage 5 allows easier identification of the timing of peak height velocity as the examiner only needs to observe advanced capping over the ulnar corner of the thumb proximal phalangeal epiphysis; in addition, the use of a reference line helps to define the advanced capping more objectively4.
Post-Peak Height Velocity Period
This period refers to the change of TW3 stage H to I (from partial fusion to completed fusion) in all of the digital epiphyses. This period can be subdivided into early, middle, and late descending phases.
The early descending phase refers to TW3 stage I (completed fusion) in the distal phalangeal epiphyses in all 5 digits. This corresponded to SSMS stage 4 or 52 as well as to TOCI stage 6 (Fig. 2 [v]). There was also a 63.3% rate of concordance between fusion of the distal phalangeal epiphysis of the thumb (TW3 stage I) and of the ulnar 4 digits (Table I). Stage-to-stage correlation showed both SSMS stage 4 and SSMS stage 5 to be consistent with TOCI stage 6 as supported by their high total concordance rate of 68.1% (Fig. 3-A); 57.4% and 81.4% of the TOCI stage-6 ratings matched with SSMS stages 4 and 5, respectively (Fig. 3-B). A previous study3 showed that SSMS stage 5 lasts for only a short duration and can be easily missed during clinic visits. On the basis of our study, we believe that TOCI stage 6 could better represent the maturation continuum of epiphyseal fusion, similar to a combination of SSMS stages 4 and 5. The percentages of all 3 stages peaked at 6 to 12 months after the time of peak height velocity (Fig. 4 [III]).
The middle descending phase refers to TW3 stage H (partial fusion) occurring in all digital epiphyses with the exception of those in the distal phalanges, which are already completely fused. This corresponded to SSMS stage 62 as well as to TOCI stage 7 (Fig. 2 [vi]). There was also a 55.8% rate of concordance between partial fusion (TW3 stage H) in the ulnar 4 digits and partial fusion (TW3 stage H) of the proximal phalangeal epiphysis of the thumb (Table I). Good consistency was found between SSMS stage 6 and TOCI stage 7, with 83.1% of the SSMS stage-6 ratings matching with TOCI stage 7 (Fig. 3-A) and 57.1% of the TOCI stage-7 ratings matching with SSMS stage 6 (Fig. 3-B). The percentage of TOCI stage-7 ratings was found to peak at 12 to 18 months after the peak height velocity period, and the percentage of SSMS stage-6 ratings peaked at 18 to 24 months after the peak height velocity (Fig. 4 [IV]).
The late descending phase refers to TW3 stage I (completed fusion of all epiphyses of all digits), which corresponded to SSMS 72 and to TOCI stage 8 (Fig. 2 [vii]). The rate of concordance between completed fusion (TW3 stage I) of the proximal phalangeal epiphysis of the thumb and completed fusion (TW3 stage I) of all remaining digital epiphyses was 89.9% (Table I). Good consistency was found between SSMS stage 7 and TOCI stage 8, with 71.7% of the SSMS stage-7 ratings matching with TOCI stage 8 (Fig. 3-A) and 88% of the TOCI stage-8 ratings matching with SSMS stage 7 (Fig. 3-B). The percentages of both stages peaked at 18 to 24 months after the time of peak height velocity, with TOCI stage 8 showing a higher correlation and better sensitivity than SSMS stage 7 (Fig. 4 [V]). With both systems, the end of remaining growth is signified by the fusion of the distal radial epiphysis (the change from TW3 stage H to I). The simplified stage-to-stage conversion and comparison of the SSMS and TOCI systems with respect to key pubertal stages are summarized in Figure 5.
Since the stages in both the SSMS and the TOCI system are based on the same natural skeletal maturation continuum process defined using the same TW3 staging descriptors during the peripubertal period, it is not surprising that we observed high stage interchangeability and correlation with overlapping time periods in the 2 systems. The accuracy of each consecutive stage in both systems in predicting skeletal maturity indicates that the systems could be complementary to each other. In general, thumb epiphyses mature a little earlier than the remaining digital epiphyses. From our analysis, it appeared that the TOCI has the advantages of the ability to predict skeletal maturity more precisely in the pre-peak height velocity period, easier identification of the timing of peak height velocity, and high sensitivity for detecting the late descending phase of growth remaining.
Theoretically, the clinical distinctions of a classification are determined by the number of categories (stages), with more categories increasing sensitivity but at the expense of decreased reliability and user friendliness. We believe that the TOCI system strikes a balance between sensitivity and reliability/user friendliness by providing a simpler skeletal maturity assessment tool that relies on the minimum essential representative epiphyses in the hand. The TOCI stages were validated by their strong correlation with the key indicators of peripubertal growth status.
To our knowledge, this is the first in-depth study on the relationship of the patterns of ossification among all digital epiphyses validated with a large number of longitudinal hand radiographs obtained at intervals averaging 6 months with a minimum of 5 follow-up visits in the peripubertal period. Our establishment of the interrelationship of the TOCI stages in the thumb with the TW3 stages in the digital epiphyses of the whole hand and with the SSMS provides a valuable bridge between a newly proposed simpler system and widely accepted, more complex established systems.
In conclusion, the newly proposed TOCI staging system, which involves assessment of 2 thumb epiphyses and the sesamoid bone—i.e., 3 instead of the 19 digital epiphyses used in the SSMS system—could effectively simplify skeletal maturity prediction for clinical decision-making in idiopathic scoliosis, with comparable validity and accuracy. In addition, the TOCI is highly practical to use clinically as confirmed by its high interchangeability and correlation with the SSMS system. The TOCI could serve as a simplified “marker” of skeletal maturity on hand radiographs and minimize the learning curve problems associated with the SSMS in a busy clinical practice.
Appendix
A table and a figure showing the percentages of TW3-stage ratings at each of the different TOCI stages are available with the online version of this article as a data supplement at jbjs.org (http://links.lww.com/JBJS/E782).
Footnotes
Investigation performed at the Prince of Wales Hospital, Shatin, Hong Kong
Disclosure: None of the authors received funding from any source. The Disclosure of Potential Conflicts of Interest forms are provided with the online version of the article (http://links.lww.com/JBJS/E781).
References
- 1.Sanders JO, Browne RH, McConnell SJ, Margraf SA, Cooney TE, Finegold DN. Maturity assessment and curve progression in girls with idiopathic scoliosis. J Bone Joint Surg Am. 2007. January;89(1):64-73. [DOI] [PubMed] [Google Scholar]
- 2.Sanders JO, Khoury JG, Kishan S, Browne RH, Mooney JF, 3rd, Arnold KD, McConnell SJ, Bauman JA, Finegold DN. Predicting scoliosis progression from skeletal maturity: a simplified classification during adolescence. J Bone Joint Surg Am. 2008. March;90(3):540-53. [DOI] [PubMed] [Google Scholar]
- 3.Verma K, Sitoula P, Gabos P, Loveland K, Sanders J, Verma S, Shah SA. Simplified skeletal maturity scoring system: learning curve and methods to improve reliability. Spine (Phila Pa 1976). 2014. December 15;39(26):E1592-8. [DOI] [PubMed] [Google Scholar]
- 4.Hung ALH, Chau WW, Shi B, Chow SK, Yu FYP, Lam TP, Ng BKW, Qiu Y, Cheng JCY. Thumb ossification composite index (TOCI) for predicting peripubertal skeletal maturity and peak height velocity in idiopathic scoliosis: a validation study of premenarchal girls with adolescent idiopathic scoliosis followed longitudinally until skeletal maturity. J Bone Joint Surg Am. 2017. September 6;99(17):1438-46. [DOI] [PMC free article] [PubMed] [Google Scholar]
- 5.Fishman LS. Radiographic evaluation of skeletal maturation. A clinically oriented method based on hand-wrist films. Angle Orthod. 1982. April;52(2):88-112. [DOI] [PubMed] [Google Scholar]
- 6.Malina RM, Beunen GP. Assessment of skeletal maturity and prediction of adult height (TW3 method). Am J Hum Biol. 2002. Nov-Dec;14(6):788-9. [Google Scholar]
- 7.Shi B, Mao S, Xu L, Sun X, Zhu Z, Qian B, Liu Z, Cheng JCY, Qiu Y. Integrated multidimensional maturity assessments predicting the high risk occurrence of peak angle velocity during puberty in progressive female idiopathic scoliosis. Clin Spine Surg. 2017. May;30(4):E491-6. [DOI] [PubMed] [Google Scholar]


