

Abstract
Objective:
To describe the relationship between the length of short-term disability (STD) and health care spending.
Methods:
Medical claims for insured US employees on STD were evaluated to describe the distribution of disability durations and health expenditures across major diagnostic categories and common medical conditions. Correlations between health expenditures and disability durations were examined.
Results:
The most expensive 10% of cases accounted for more than half of total health spending. The longest 10% of cases accounted for more than one-third of total disability time. Only one-third of the most expensive cases were also among the longest in duration. Disability durations were moderately correlated with medical spending and this relationship was modified by comorbid conditions and age.
Conclusion:
Psychosocial barriers, in addition to biomedical factors, should be considered to achieve optimal functional outcomes and well-being of patients.
Keywords: disability insurance, disability leave, employee health benefit plans, return to work, occupational health
Every year, more than two million people leave the United States (US) workforce due to illness or injury, at least temporarily.1 Work disability imposes a significant financial burden on employers and employees, with annual estimates approaching $260 billion in productivity losses alone.2 Employers provision health insurance for more than 151 million people, and the health care needs for employees experiencing disabling conditions is often substantial.3,4 For example, a recent study found that one-quarter of employees with a temporary disability-related work absence accounted for more than half of total employee medical spending.4 Prevalence of individuals living with a disability is expected to rise in the coming decades, warranting an examination of the burden of work absence and health care expenditures to evaluate strategies that reduce the negative consequences of work disability for both employees and employers.5–7
Despite the burden of temporary disability, few studies provide a comprehensive picture of the duration of disability-related work absence and health expenditures across multiple conditions. In a 2003 study, Goetzel et al8,9 linked employee absence and medical claims data and found that the costliest disease categories for employers were cardiovascular disease, musculoskeletal disorders, and arthritis. This study provided important information about the medical and productivity cost burden of certain health conditions, but short-term disability (STD) program data was unavailable for 27% of employees and the authors did not directly compare disability duration and medical expenditures.8 Additionally, the study used data from the late nineties, and the US health care system and health characteristics of the US workforce have changed substantially over the 18 years since this dataset was collected.5,10,11
In a more recent study, Pumkam et al12 used data from the Medical Expenditures Panel Survey (MEPS) to evaluate the relationship between disability duration and health expenditures in working-age adults. The authors found that individuals with persistent disabilities had higher total medical expenditures but lower out-of-pocket expenses than those with temporary disabilities. However, this analysis did not evaluate disability duration and health expenditures by medical condition, which is important given the heterogeneity in disability experience by condition.
The purpose of this study is to describe the relationship between health care spending and the length of disability absence among US employees on STD.
STUDY DATA AND METHODS
Data
This study analyzed data from Truven Health Analytics’ MarketScan® Commercial Claims and Encounters (CCAE) and Health and Productivity Management (HPM) Databases for the period spanning 2007 to 2014.13 These databases contain de-identified, person-level information on benefit plan enrollment, disability absence dates, and medical services (inpatient, outpatient, and pharmaceutical).
Disability Case Definition
All employees in this analysis utilized STD insurance and were continuously enrolled in an employer-sponsored health insurance plan in the month prior to the STD start date through 6 months after their return to work (RTW) date. The primary diagnosis for each STD was coded using the International Classification of Diseases, Ninth Revision, Clinical Modification (ICD-9-CM). To focus specifically on injury and illness, we excluded women with disability or health claims related to pregnancy. Claims with a concurrent workers’ compensation claim were excluded because medical care for job-related injury and illness is not captured in the CCAE database (n = 25,802). STD claims that transitioned to long-term disability (LTD) were included and the LTD start date was used as the STD end date (n = 7415). Cases for employees enrolled in a capitated health plan (n = 5376) or whose total costs during the disability episode resulted in an illogical value (zero or negative sums, n = 4501) were also excluded from analysis because we could not verify that complete and accurate claims data were available for these employees.
Demographic and Disability Characteristics
STD case durations were calculated as the number of calendar days between the STD start date and the return to work (RTW) date. STD cases with durations longer than 2 years were excluded as most STD benefit plans in the United States do not cover this length of disability.14 Medical expenditures were considered part of the disability if they occurred between 7 days before the STD start date and the RTW date. Expenditures were adjusted to 2016 dollars using the Medical Care Services Consumer Price Index (CPI) for medical care services and the Medical Care Commodities (drug) CPI for drug claims.15 Total medical expenditures represent the total gross, eligible payments after applying pricing guidelines, such as fee schedules or discounts negotiated by health plans, but before the total payment was allocated to the health plan or employee. All medical care costs during the disability episode were included.
Data Analysis
For our primary analysis, we summed medical expenditures during the disability episode (ie, inpatient, outpatient, and pharmaceutical costs), the number of calendar days of disability, and the number of days with an inpatient or outpatient service claim for each employee. We report summary statistics for expenditures and durations by major diagnostic category and top medical conditions, which we based on the Agency for Health Research and Quality's Clinical Classifications Software groupings.16 Spearman rank correlations were used to examine the strength of the relationship between disability duration and medical expenditures by major diagnostic category. As a measure of medical care intensity, we report the percent of total disability days with an inpatient or outpatient claim.
To compare medical expenditures during the disability episode with the overall medical expenditures, we compared expenditures during disability with those accrued during the 6 months prior to the STD start date and the 6 months following RTW. We excluded cases from this analysis if they did not have continuous health insurance during this timeframe.
To assess the effects of age and comorbidities on the association between disability duration and medical expenditures, we stratified cases by these factors and calculated Spearman rank correlations. Coexisting diagnoses were abstracted from the CCAE database during the 6 months prior to disability through RTW for cases with continuous health insurance during this timeframe. Comorbid conditions were defined using the ICD-9-CM diagnosis groupings in Quan et al.17 The sum of unique comorbid conditions, excluding comorbid conditions that overlapped with the primary diagnosis, was used to stratify cases.
RESULTS
Demographics
The sample included 790,910 STD cases among 553,970 unique employees (Table 1). Slightly more than half of claims were females (50.5%) and the average age at disability was 45. Employees enrolled in a preferred provider organization (PPO) comprised the majority (64.9%) of claims. The majority of employees only had one STD claim during the study period (74%) and did not transfer from STD to LTD (99.4%).
TABLE 1.
Description of the Study Sample
| Characteristic | N (%)* |
| Total STD cases | 790,910 (100.0%) |
| Sex | |
| Female | 399,043 (50.5%) |
| Male | 391,867 (49.5%) |
| Age (yrs) | |
| 18–24 | 16,676 (2.1%) |
| 25–34 | 134,134 (17.0%) |
| 35–44 | 209,161 (26.4%) |
| 45–54 | 257,970 (32.6%) |
| 55–64 | 172,969 (21.9%) |
| Region | |
| North Central | 214,850 (27.2%) |
| Northeast | 149,222 (18.9%) |
| South | 303,316 (38.4%) |
| West | 123,226 (15.6%) |
| Unknown | 296 (<0.01%) |
| Industry | |
| Construction | 436 (0.1%) |
| Finance, Insurance, Real Estate | 137,263 (17.4%) |
| Durable manufacturing | 239,002 (30.2%) |
| Non-durable manufacturing | 98,037 (12.4%) |
| Oil, Gas, Mining | 1,860 (0.2%) |
| Retail | 34,877 (4.4%) |
| Services | 40,058 (5.1%) |
| Transportation, communications, utilities | 239,324 (30.3%) |
| Wholesale | 33 (<0.01%) |
| Unknown | 20 (<0.01%) |
| Health plan | |
| Consumer driven health plan (CDHP) | 54,539 (6.9%) |
| Comprehensive | 22,982 (2.9%) |
| Exclusive provider organization (EPO) | 8,696 (1.1%) |
| High deductible health plan (HDHP) | 18,208 (2.3%) |
| Health maintenance organization (HMO) | 89,059 (11.3%) |
| Non-capitated point-of-service (POS) | 84,057 (10.6%) |
| Preferred provider organization (PPO) | 513,369 (64.9%) |
STD, short-term disability.
*Percentages may not add to 100 because of rounding.
Summary by Major Diagnostic Category
Claims for musculoskeletal disorders were the most common (23%), followed by injuries (17%), and mental health disorders (13%) (Table 2 and Fig. 1). Despite a comparatively low median expenditure per case during the disability episode ($7199), claims for musculoskeletal disorders comprised the largest percent of spending (22% of total) because of the high case volume. Back disorders, connective tissue disorders, and osteoarthritis were the most common musculoskeletal system conditions and comprised 9%, 5%, and 3% of all cases. Notably, disability claims related to osteoarthritis were among the longest durations (73 days) as well as the highest health expenses ($33,049). After musculoskeletal disorders, mental health disorders had the longest durations (48 days) but among the lowest median health expenditures ($2014) and highest median out-of-pocket percent of health expenditure (16%). For all diagnostic categories except mental health and respiratory disorders, median medical expenditures during the disability episode exceeded the combined medical expenditures 6 months before and after disability (Table S1). On average, the percent of expenditures incurred during disability varied by diagnostic category and comprised between 33% (mental health and respiratory disorders) and 79% (circulatory disorders) of the total costs incurred from 6 months prior through 6 months after disability.
TABLE 2.
Median Medical Expenditures and Disability Durations by Diagnostic Category and Medical Condition
| Diagnostic Category or Medical Condition* | Number of Cases | Disability Duration (Days) | Total Medical Expenditures ($) per Case | Out-of-Pocket Expenditures (%) of Total | |||||
| N | %† | 25th %ile | 50th %ile | 75th %ile | 25th %ile | 50th %ile | 75th %ile | 50th %ile | |
| Musculoskeletal | 184,254 | 23% | 28 | 54 | 93 | 2,096 | 7,199 | 20,956 | 11 |
| Back problems | 72,698 | 9% | 26 | 51 | 96 | 1,334 | 5,062 | 20,362 | 12 |
| Connective tissue disorders | 40,892 | 5% | 27 | 51 | 93 | 1,896 | 6,098 | 12,869 | 12 |
| Osteoarthritis | 20,507 | 3% | 46 | 73 | 104 | 12,756 | 33,049 | 48,805 | 5 |
| Non-traumatic joint disorders | 16,322 | 2% | 25 | 47 | 88 | 1,470 | 5,381 | 14,844 | 11 |
| Traumatic joint dislocations | 13,041 | 2% | 28 | 48 | 82 | 4,594 | 8,084 | 14,601 | 11 |
| Injury | 131,598 | 17% | 23 | 44 | 80 | 1,046 | 4,065 | 12,072 | 13 |
| Sprains and strains | 43,354 | 5% | 21 | 41 | 82 | 563 | 2,129 | 9,017 | 15 |
| Traumatic joint disorders | 18,995 | 2% | 27 | 44 | 73 | 3,960 | 6,985 | 11,444 | 11 |
| Lower limb fractures | 16,385 | 2% | 38 | 62 | 97 | 1,642 | 4,624 | 16,276 | 13 |
| Upper limb fracture | 13,453 | 2% | 36 | 57 | 87 | 1,963 | 5,719 | 16,445 | 13 |
| Mental | 99,483 | 13% | 28 | 48 | 88 | 631 | 2,014 | 7,458 | 16 |
| Mood disorders | 55,774 | 7% | 30 | 54 | 92 | 715 | 2,162 | 7,476 | 16 |
| Anxiety disorders | 25,955 | 3% | 24 | 41 | 79 | 416 | 1,124 | 3,454 | 18 |
| Digestive | 79,707 | 10% | 17 | 28 | 45 | 5,202 | 10,611 | 20,444 | 9 |
| Abdominal hernia | 22,315 | 3% | 23 | 34 | 49 | 5,308 | 8,422 | 14,014 | 10 |
| Biliary tract disease | 18,338 | 2% | 16 | 23 | 35 | 8,824 | 13,228 | 20,543 | 9 |
| Respiratory | 57,676 | 7% | 12 | 19 | 32 | 531 | 2,028 | 8,686 | 16 |
| Upper respiratory infections | 12,851 | 2% | 10 | 16 | 28 | 319 | 874 | 4,765 | 18 |
| Neoplasm | 46,768 | 6% | 28 | 47 | 84 | 11,135 | 22,537 | 53,415 | 5 |
| Uterine Fibroid | 11,355 | 1% | 33 | 44 | 55 | 10,495 | 15,172 | 21,898 | 9 |
| Breast cancer | 6,904 | 1% | 29 | 55 | 124 | 17,477 | 37,032 | 75,520 | 3 |
| Circulatory | 45,829 | 6% | 21 | 38 | 76 | 7,026 | 22,094 | 52,964 | 6 |
| Coronary heart disease | 7,429 | 1% | 23 | 44 | 83 | 18,181 | 40,172 | 75,579 | 3 |
| Essential hypertension | 5,100 | 1% | 17 | 30 | 57 | 733 | 2,734 | 9,528 | 15 |
| Acute myocardial infarction | 4,191 | 1% | 25 | 41 | 69 | 26,898 | 41,431 | 64,883 | 4 |
| Acute cerebrovascular disease | 3,523 | <1% | 37 | 75 | 168 | 15,958 | 32,309 | 76,272 | 6 |
| Genitourinary | 44,290 | 6% | 19 | 33 | 50 | 6,637 | 12,391 | 20,837 | 9 |
| Nervous | 43,126 | 5% | 20 | 38 | 75 | 1,898 | 5,236 | 11,296 | 12 |
| Metabolic | 21,921 | 3% | 20 | 30 | 48 | 5,309 | 18,338 | 31,661 | 8 |
| Infectious | 21,661 | 3% | 15 | 27 | 53 | 1,017 | 5,997 | 19,379 | 12 |
| Skin | 14,597 | 2% | 16 | 28 | 50 | 1,310 | 5,434 | 15,211 | 12 |
*Medical condition groups defined using Agency for Health Research and Quality's Clinical Classification Software Groupings.16
†Diagnostic category percentages may not add to 100 because of rounding.
FIGURE 1.
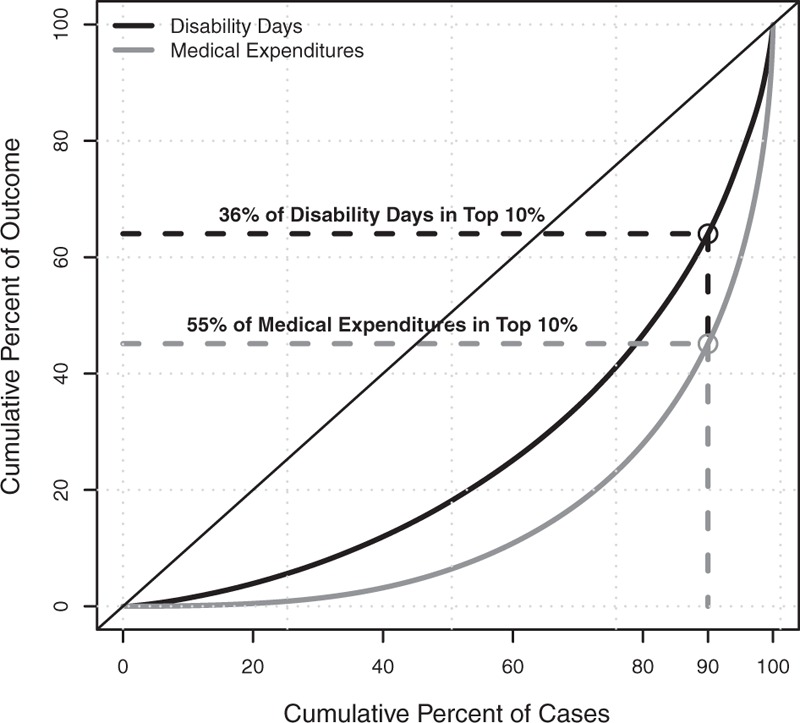
Cumulative distribution of medical expenditure and disability duration among short-term disability claims.
Correlation Between Medical Spending and Disability Duration
The costliest 10% of cases accounted for more than half of the total health spending (Fig. 2). The longest 10% of disability durations accounted for more than one-third of total disability time. Only one-third of cases in the top 10% by disability duration were also among the highest spenders. Long duration, high cost cases were most frequently related to musculoskeletal disorders (27%), neoplasms (24%), and circulatory system disorders (12%). As part of our sensitivity analysis, we evaluated whether variations in the maximum STD benefit duration affected our finding that only one-third of the longest cases were also among the costliest. Since more than two-thirds of STD plans are designed to cover up to 6 months (182 days) of disability,1 we compared the top deciles of cost and duration among cases 182 days or shorter. The overlap was 28%, indicating that STD plan design did not explain the low percentage of overlap between expensive and long cases. Medical expenditures and disability durations were moderately correlated (Spearman rho range: 0.23 to 0.63) (Fig. 3). The strongest relationship between spending and durations was observed for neoplasms (rho = 0.63) and infectious disease (rho = 0.54). The association between medical spending and disability duration strengthened as the number of comorbid conditions increased for all major diagnostic categories except mental health and metabolic conditions (Table S2). For example, the association between spending and duration for individuals with musculoskeletal disorders and no comorbidities was 0.42, but this association increased modestly for individuals with one comorbidity or multiple comorbidities (Spearman rho: 0.45, 0.49, respectively). Similarly, as age increased, the association between spending and duration tended to increase for all diagnostic categories, except nervous system disorders (Table S3).
FIGURE 2.

Median medical expenditure compared with median disability duration by major diagnostic category.
FIGURE 3.

General additive model regression lines for medical expenditure and disability duration by major diagnostic category. All Spearman rho correlation coefficients were significant at P < 0.05.
The intensity of medical care services declined as the length of disability increased. The shortest cases (less than 12 weeks) had a medical encounter on 36% of their disability days, whereas the longest duration (more than 4 months) received care on fewer than 20% of disability days.
DISCUSSION
Among 790,910 STD claims, we observed that disability time and medical expenditures were highly concentrated among a small proportion of claims. Ranked by expenditures, the top 10% of claims accounted for 55% of all health care spending. Ranked by length of disability, the top 10% of claims accounted for 36% of total disability days.
Our study shows that a small subset among individuals with work disability account for a majority of health spending, regardless of the duration of disability. Multiple studies have found that functional limitations are key predictors of high spend.18–20 Further, approximately 62% of the top 5% in medical spending are not within that group after 1 year.18 Given these trends, researchers have previously suggested that claims data include flags for temporary functional limitations. Currently, work disability may be the best available indicator of functional limitation.
We observed that two-thirds of the disabilities with the longest durations did not also have the highest health expenditures and the intensity of medical care decreased for disabilities with longer durations. Previous research indicates that between 60% and 80% of work disability is not medically necessary, and a substantial body of clinical research demonstrates that unnecessarily prolonged disability absence can have unintended, adverse consequences for the patient's mental, physical, family, and economic wellbeing.21–27 Using STD and medical claims data, this study supports two recent American College of Occupational and Environmental Medicine (ACOEM) Position Papers that emphasize the need for mainstream medical care to adopt a focus on functional recovery as well as keeping patients at work or helping them RTW as soon as safely possible.21,28 Widespread adoption of interventions that coordinate medical care with RTW strategies, including workplace modifications and therapy that targets psychosocial determinants of disability, is needed to minimize these unintended consequences.1,21–23,27–30
Musculoskeletal disorders were the dominant reason for STD absence and comprised the largest proportion of both medical expenditures and disability time. Given our results, which are corroborated by previous research,6,31 continued efforts should be directed at preventing and effectively managing these conditions to reduce the burden on both employees and payers.
This analysis has several limitations. First, only approximately 40% of the US workforce has access to paid disability insurance, so this population is not representative of the larger US workforce.32 Second, illness duration could be underrepresented since incidental sick days and unpaid Family Medical Leave Act (FMLA) days were not included. Third, only medical expenses for the time on disability and the week preceding were included in our analysis of the relationship between disability durations and medical expenditures. Fourth, medical expenditures included payments for all medical care, not care only related to the primary STD diagnosis. However, the inclusion of all payments more accurately represents the experience of employees on work disability since they are more likely to have complicated illness profiles compared with other employees,4 and disability duration and medical expenditures are both associated with coexisting and comorbid conditions.33,34 This study found the presence of comorbid conditions and age modified the relationship between medical expenditures and disability duration; however, future studies should explore additional factors that influence this relationship.
This study has several strengths, including the use of a large, nationwide sample of STD claims representing multiple industries and health plans. This analysis captured longitudinal information on health care expenditures, as well as diagnoses and treatments from multiple components of care, including inpatient, outpatient, and pharmaceuticals. This study provides realistic estimates for employers and benefits managers regarding the burden of disability absence and medical expenditures for employees with medical conditions affecting their ability to work.
CONCLUSION
For employees with disability, musculoskeletal conditions remain the key driver of both medical expenditures and disability durations. Medical spending was moderately correlated with duration of disability and prolonged disability durations are not necessarily related to protracted, intensive medical treatment. These findings indicate that medical care and RTW interventions should consider psychosocial and other barriers in addition to biomedical factors for optimal functional outcomes and well-being of patients.
Supplementary Material
Supplementary Material
Supplementary Material
Footnotes
Funding Sources: F.G. and C.Z. were funded by ReedGroup, Ltd. to perform the work in this manuscript. R.E. and M.B. received no funding for this research.
Conflicts of Interest: All authors declare no conflicts of interest.
REFERENCES
- 1.Hollenbeck K. Promoting Retention or Reemployment of Workers after a Significant Injury or Illness. Mathematica Center for Studying Disability Policy; 2015. Available at: https://www.dol.gov/odep/topics/pdf/SAW-RTW_Retention_FINAL_2015-10.pdf Accessed October 24, 2017. [Google Scholar]
- 2.Davis K, Collins SR, Doty MM, Ho A, Holmgren A. Health and productivity among U.S. workers. The Commonwealth Fund; 2005. Available at: http://www.commonwealthfund.org/usr_doc/856_Davis_hlt_productivity_USworkers.pdf Accessed November 25, 2017. [PubMed] [Google Scholar]
- 3.Kaiser Family Foundation. 2017 Employer Health Benefits Survey; 2017. Available at: http://kff.org/health-costs/report/2017-employer-health-benefits-survey/ Accessed November 25, 2017. [Google Scholar]
- 4.Gifford B. Temporarily disabled workers account for a disproportionate share of health care payments. Health Aff (Millwood) 2017; 36:245–249. [DOI] [PubMed] [Google Scholar]
- 5.Iezzoni LI, Kurtz SG, Rao SR. Trends in U.S. adult chronic disability rates over time. Disabil Health J 2014; 7:402–412. [DOI] [PMC free article] [PubMed] [Google Scholar]
- 6.Theis KA, Roblin D, Helmick CG, Luo R. Prevalence and causes of work disability among working-age U.S. adults, 2011-2013, NHIS. Disabil Health J 2018; 11:108–115. [DOI] [PMC free article] [PubMed] [Google Scholar]
- 7.Martin LG, Schoeni RF. Trends in disability and related chronic conditions among the forty-and-over population: 1997-2010. Disabil Health J 2014; 7 Suppl:S4–S14. [DOI] [PMC free article] [PubMed] [Google Scholar]
- 8.Goetzel RZ, Hawkins K, Ozminkowski RJ, Wang S. The health and productivity cost burden of the “top 10” physical and mental health conditions affecting six large U.S. employers in 1999. J Occup Environ Med 2003; 45:5–14. [DOI] [PubMed] [Google Scholar]
- 9.Goetzel RZ, Long SR, Ozminkowski RJ, Hawkins K, Wang S, Lynch W. Health, absence, disability, and presenteeism cost estimates of certain physical and mental health conditions affecting U.S. employers. J Occup Environ Med 2004; 46:398–412. [DOI] [PubMed] [Google Scholar]
- 10.Catlin A, Cowan C. History of Health Spending in the United States, 1960-2013. Centers for Medicare and Medicaid Services; 2015. Available at: https://www.cms.gov/Research-Statistics-Data-and-Systems/Statistics-Trends-and-Reports/NationalHealthExpendData/Downloads/HistoricalNHEPaper.pdf Accessed November 30, 2017. [Google Scholar]
- 11.Dieleman JL, Baral R, Birger M, et al. US spending on personal health care and public health, 1996-2013. JAMA 2016; 316:2627. [DOI] [PMC free article] [PubMed] [Google Scholar]
- 12.Pumkam C, Probst JC, Bennett KJ, Hardin J, Xirasagar S. Health care expenditures among working-age adults with physical disabilities: variations by disability spans. Disabil Health J 2013; 6:287–296. [DOI] [PubMed] [Google Scholar]
- 13.Truven Health MarketScan® Research Databases. Available at: http://truvenhealth.com/markets/life-sciences/products/data-tools/marketscan-databases Accessed July 14, 2016. [Google Scholar]
- 14.Parry T. Digging into Short-Term Disability Plan Design. Integrated Benefits Institute; 2008. Available at: https://www.ibiweb.org/?ACT=65&id=_zLQG1Y9gvlU-fm0ZkOHkT9x2NG8RKaLIOnGy7jnwE_sJvNBVa7MsM_CIHvUBexP0-Ej7qP_ZqDVrQ3DlVle4A Accessed June 8, 2017. [Google Scholar]
- 15.U.S. Bureau of Labor Statistics. Consumer Price Index. Available at: http://www.bls.gov/cpi Accessed June 14, 2017. [Google Scholar]
- 16.Agency for Healthcare Research and Quality. Healthcare Cost and Utilization Project (HCUP) CCS; 2017. Available at: https://www.hcup-us.ahrq.gov/toolssoftware/ccs/ccs.jsp Accessed August 2, 2017. [PubMed] [Google Scholar]
- 17.Quan H, Sundararajan V, Halfon P, Fong A. Coding algorithms for defining comorbidities in ICD-9-CM and ICD-10 administrative data. Med Care 2005; 43:1130–1139. [DOI] [PubMed] [Google Scholar]
- 18.Schoenman JA. The Concentration of Health Care Spending. National Institute for Health Care Management Research Educational Foundation (NIHCM) Foundation Data Brief; 2012. Available at: https://www.nihcm.org/pdf/DataBrief3 Final.pdf Accessed November 15, 2017. [Google Scholar]
- 19.Alecxih L, Shen S, Chan I, Taylor D, Drabek J. Individuals Living in the Community with Chronic Conditions and Functional Limitations: A Closer Look. US Department of Health and Human Services; 2010. Available at: https://aspe-hhs-gov.ezp.welch.jhmi.edu/sites/default/files/pdf/75961/closerlook.pdf Accessed November 17, 2017. [Google Scholar]
- 20.Mitra S, Findley PA, Sambamoorthi U. Health care expenditures of living with a disability: total expenditures, out-of-pocket expenses, and burden, 1996 to 2004. Arch Phys Med Rehabil 2009; 90:1532–1540. [DOI] [PubMed] [Google Scholar]
- 21.Jurisic M, Bean M, Harbaugh J, et al. The personal physician's role in helping patients with medical conditions stay at work or return to work. J Occup Environ Med 2017; 59:125–131. [DOI] [PubMed] [Google Scholar]
- 22.Christian J. Reducing disability days: healing more than the injury employers and physicians fail to communicate. J Work Compens 2000; 9:30–55. Available at: http://www.webility.md/jwc-w2000.htm. Accessed September 26, 2017. [Google Scholar]
- 23.Waddell G, Burton AK. Is Work Good for Your Health and Well-Being? London, UK:The Stationery Office; 2006. [Google Scholar]
- 24.Walsh FP, Tickle AC. Working towards recovery: the role of employment in recovery from serious mental health problems: a qualitative meta-synthesis. Int J Psychosoc Rehabil 2014; 17:35–49. [Google Scholar]
- 25.Denne J, Kettner G, Ben-Shalom Y. The Role of the Physician in the Return-to-Work Process Following Disability Onset. Mathematica Center for Studying Disability Policy; 2015. Available at: https://www.dol.gov/odep/topics/pdf/RTW_Role of Physician_2015-03.pdf Accessed October 24, 2017. [Google Scholar]
- 26.Saunders SL, Nedelec B. What work means to people with a work disability: a scoping review. J Occup Rehabil 2014; 24:100–110. [DOI] [PubMed] [Google Scholar]
- 27.Sullivan M, Hyman M. Return to work as a treatment objective for patients with chronic pain? J Pain Reli 2014; 3:130. [Google Scholar]
- 28.Mueller K, Konicki D, Larson P, Hudson TW, Yarborough C. Advancing value-based medicine. J Occup Environ Med 2017; 59:e57–e62. [DOI] [PubMed] [Google Scholar]
- 29.Heidkamp M, Christian J. The Aging Workforce: The Role of Medical Professionals in Helping Older Workers and Workers with Disabilities to Stay at Work or Return to Work and Remain Employed. US Department of Labor, Office of Disability Employment Policy; 2013. Available at: https://www.dol.gov/odep/pdf/NTAR-AgingMedicalProfessionals.pdf Accessed October 25, 2017. [Google Scholar]
- 30.Besen E, Young AE, Shaw WS. Returning to work following low back pain: towards a model of individual psychosocial factors. J Occup Rehabil 2015; 25:25–37. [DOI] [PMC free article] [PubMed] [Google Scholar]
- 31.Roehrig C. Mental disorders top the list of the most costly conditions in the United States: $201 Billion. Health Aff 2016; 35:1130–1135. [DOI] [PubMed] [Google Scholar]
- 32.Bureau of Labor Statistics. Employee Benefits Survey. Available at: https://www.bls.gov/ncs/ebs/benefits/2017/benefits_life.htm Accessed September 26, 2017. [Google Scholar]
- 33.Cancelliere C, Donovan J, Stochkendahl MJ, et al. Factors affecting return to work after injury or illness: best evidence synthesis of systematic reviews. Chiropr Man Therap 2016; 24:32. [DOI] [PMC free article] [PubMed] [Google Scholar]
- 34.Goetzel RZ, Pei X, Tabrizi MJ, et al. Ten modifiable health risk factors are linked to more than one-fifth of employer-employee health care spending. Health Aff 2012; 31:2474–2484. [DOI] [PubMed] [Google Scholar]
Associated Data
This section collects any data citations, data availability statements, or supplementary materials included in this article.