Supplemental Digital Content is available in the text
Keywords: meta-analysis, parity, urinary incontinence
Abstract
Urinary incontinence (UI) is a common complaint for adult female. Cross-sectional studies suggested parity may link with UI, but the association between them was not well-established. We conducted a meta-analysis to investigate the association between parity and UI.
Medline and Embase were searched for eligible case–control and cohort studies about parity and UI. Two authors screened the literature and extracted the data independently. Odds ratio (OR) was used as the measure of the effect of parity on UI. We pooled the ORs of different number of parity by a random-effect model. Subgroup analysis was conducted by a subtype of UI. Sensitivity analysis was conducted to see whether the results were stable.
Thirteen studies (8 cohorts and 5 case–controls) were included in our meta-analysis, with a total of 74,883 adult females. Our meta-analysis showed that compared with nulliparity, ORs of women with 1, 2, and ≥3 parity were 1.43 [95% confidence interval (95% CI): 0.90–2.28; I2 = 81.4%; n = 4], 1.50 (95% CI: 1.02–2.20; I2 = 82.5%; n = 4), and 1.58 (95% CI: 1.22–2.03; I2 = 70.1%; n = 7) compared with nulliparity. The OR for any multiparity to nulliparity was 1.68 (95% CI: 1.39–2.03; I2 = 0%; n = 4). Subgroup analysis showed that parity was associated with an increased risk of stress UI (OR = 2.32, 95% CI: 1.41–3.81; I2 = 0%; n = 2; 1 compared with null parity) but not urgent UI; However, the definition of parity varies across studies and studies defined parity as delivery times showed higher pooled OR than those not. Sensitivity analysis showed our results were stable.
Current evidence suggested that parity was associated with an increased risk of overall and stress UI but not urgency UI, though the definition of parity may differ. Higher parity may have a more significant effect on overall UI. Standardized definition of parity is needed.
1. Introduction
Urinary incontinence (UI) is a common complaint, particularly in postpartum and aging women.[1] The prevalence of UI in women varies across regions and populations, ranging from 10.8% to 79% among adults.[2] According to the International Continence Society, UI is defined as any involuntary leakage of urine.[3] There are 3 types of UI: stress UI, which is due to effort, physical exertion, or sneezing or coughing; urgency UI, which is associated with urgency; and mixed UI, which is a combination of both.[4]
Demographic characteristics (e.g., age), lifestyle habits (e.g., smoking), and baseline medical conditions (e.g., depression), obstetric characteristics (e.g., pregnancy) may be considered as important risk factors for UI.[5–8] Large cross-sectional surveys have suggested that multiparity was associated with a higher prevalence of UI.[5,9–12] Pregnancy and childbirth were also considered as risk factors for stress UI in some review articles.[4,13] However, due to the limitation of such type of studies (cross-sectional), current evidence can only support the potential association between parity and UI but not their causal relationship.[14] Moreover, the results of the cross-sectional study may be at risk for selective bias.[14] Whether parity causes UI or UI is an effect of parity is unclear.
On the basis of a literature search, we found no comprehensive evidence on the relationship between parity and UI. To establish the potential causation between parity and UI, a meta-analysis was conducted based on case–control and cohort studies of the adult population. Moreover, whether higher parity has significantly affected UI was validated.
2. Methods
This meta-analysis was conducted in accordance with the guidelines of the MOOSE Statement.[15] This study does not involve ethics, as it is based on the analysis of secondary evidence.
2.1. Eligibility criteria
In the present study, we included case–control and cohort studies that investigated the relationship between parity and the risk for UI. The population was limited to adult women. The exposure of interest was multiparity (compared with nulliparity or 1 parity), and the primary outcome was any type of UI. Cross-sectional studies were not included because they are descriptive and mainly used to describe prevalence. Moreover, they are not suitable for cause-and-effect analysis.[14] For cohort studies, only those that reported about the relationship between parity and risk of UI incidence were considered. Parity was defined as the number of offspring a female has borne, according to the MeSH term provided by PubMed. However, as the Child Health Epidemiology Reference Group (CHERG) Small-for-Gestational-Age-Preterm Birth Working Group of Johns Hopkins Bloomberg School of Public Health, parity was defined as number of live births.[6] Both of the terms were treated as parity in current meta-analysis.
2.2. Literature search and screening
We searched MEDLINE (1974 to February 12, 2018) and Embase (1946 to February 08, 2018) for potential publications without any language limitations. MeSH terms and free text words were combined to develop the search strategy. These mainly included “parity” [MeSH], “multiparty,” “urinary incontinence” [MeSH], and “incontinence.” The full search strategy is presented in the Supplementary file.
Two authors (Z.H-H and G.Y-L) searched for eligible studies by reviewing the title and abstract and then the full text. For title and abstract reviewing, studies that were obviously not related were excluded. Conference abstracts, gray literature, and letters to the editor were not considered. Any disagreements were solved via discussion. If consensus is not reached, a third author was asked for judgment (L.T-Z).
2.3. Data extraction
Data were extracted by one author (Z.H-H) and then reviewed by another author (B.S). The following information about each study was collected: author's first name, year of publication, region, type of study, follow-up year for cohorts, control information for case–control studies, sample size, population characteristics (e.g., mean age), type of UI, number of parity, effect sizes, and variables that were controlled in the statistical analysis. For the effect sizes, we extracted the one controlled for most confounding variables. Any disagreements were reviewed by the 2 authors. The corresponding authors of previous studies that did not report any relevant information were contacted for potential data.
2.4. Quality assessment
We assessed the quality of the selected studies using the Newcastle–Ottawa Scale (NOS), which was widely used for quality assessment in the meta-analysis of observational studies.[16] This scale contains 9 items for both case–control and cohort studies. One star was assigned to each item if it met the standards. Otherwise, no star was assigned to the items. A study with more stars indicates higher scientific quality. A study with ≥7 stars was a high-quality study, whereas a study with ≤4 stars was a low-quality study. Quality assessment was performed concurrently by 2 authors (Z.H-H and Y.Z-H).
2.5. Statistical analysis
There were 2 types of studies and some of them used odds ratio (OR). Meanwhile, the others used risk ratio (RR) to measure the effect. Then, we combined them as OR by treating all RRs as OR. This was reasonable because the incidence rate of UI is less than 10%, and the RR was approximately equal to OR.[17]
Most studies presented the results in a categorical manner in which each number of parity corresponds to an OR compared with reference parity. We combined these ORs by category, as it is inappropriate to combine all the ORs with different categories. In detail, we combined the ORs of 1 parity, 2 parity, and ≥3 parity on UI separately from the selected studies. This allows us to detect the different impacts of parity number on the risk for UI. For studies reporting results by the subtype of UI instead of the overall UI, we combined the ORs of each subtype using the fixed-effect model as the overall OR for UI. The random- or fixed-effect model was used in the meta-analysis according to the amount of heterogeneity. I2 that is higher than 30% indicated moderate to substantial heterogeneity. Thus, the random-effect model was used. Otherwise, the fixed-effect model was utilized.[18]
We also conducted a robust meta-regression analysis to assess the potential dose–response effect of parity on UI.[19] Sensitivity analysis was conducted by excluding low-quality studies and those that only included crude OR. Subgroup analysis was conducted according to the subtype of UI when the number of studies is sufficient. Considering the different definition of parity, subgroup analysis was also conducted according to the definition. Publication bias was identified using the funnel plot. All statistical analyses were performed using Stata version 12.0 (STATA, College Station, TX), and P value < .05 was considered statistically significant.
3. Results
We initially searched 2269 publications from the 2 databases, of which 341 were duplicates. Of the remaining publications, 1622 did not meet the criteria of the title and abstract. We further excluded 293 articles based on full-text reading. Finally, 13 eligible studies were included.[20–32]Figure 1 presents the screening details.
Figure 1.
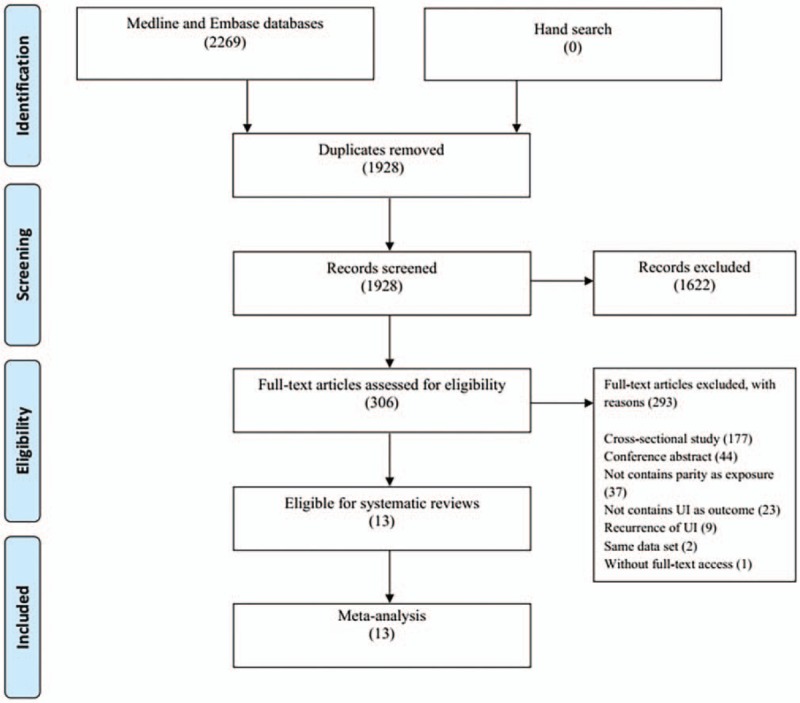
The flow chart.
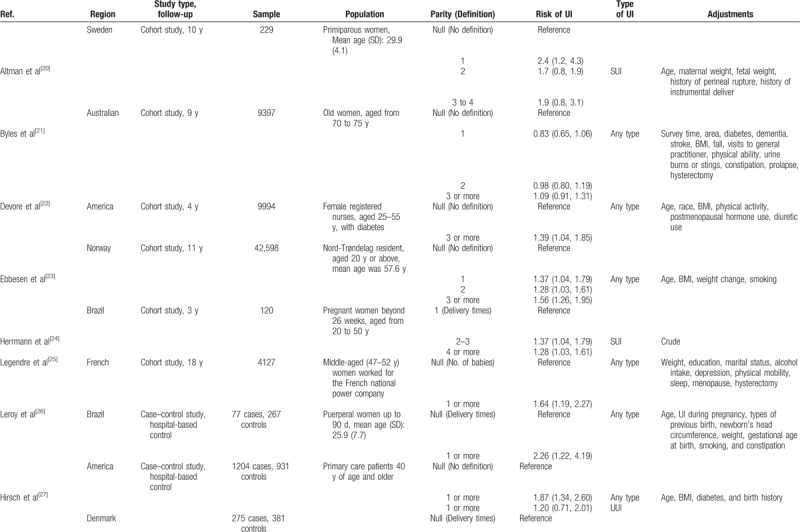
Among the 13 studies, 8 and 5 were cohort and case–control studies, respectively. For cohort studies, the follow-up period ranged from 3 to 18 years, and the median time was 9.5 (interquartile range: 4.75–11.25) years. For the 5 case–control studies, 4 used hospital-based control and 1 utilized community-based control. Seven studies were conducted in European countries, 3 in North America, 2 in South America, and 1 in Australia.
In total, 74,883 adult women were included in this meta-analysis. The mean age of the participants was 47.40 years, and the median age was 50 (interquartile range: 36.25–55.25) years. The total number of cases was not identified because some cohort studies did not report the information. The parity number ranged from 0 to ≥4. In terms of outcome, all types of UI, stress UI, and urgency UI were reported in 8, 5, and 2 studies, respectively. Table 1 depicts the basic characteristics of these studies.
Table 1.
Basic characteristics of included studies.
The total quality of the selected studies ranged from 3 to 8. Of these studies, 6 were identified as high quality, 6 as moderate quality, and 1 as low quality (Table 2). The corresponding authors of the 2 potential studies were contacted.[33,34] However, they did not provide any relevant data.
Table 1 (Continued).
Basic characteristics of included studies.
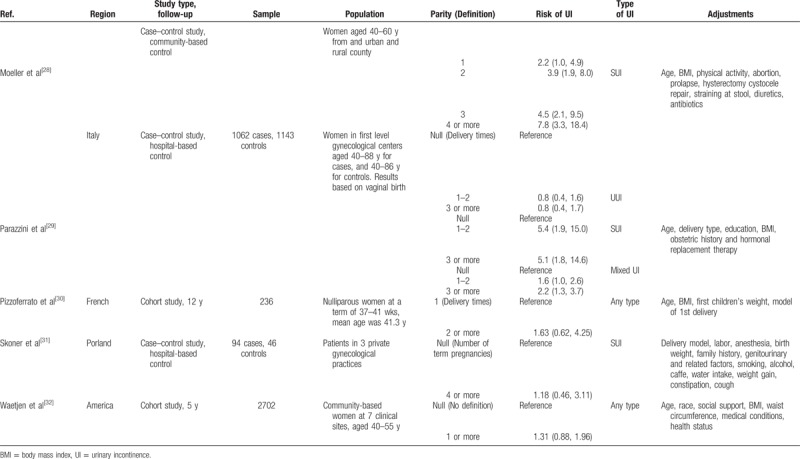
Table 2.
Risk of bias of included studies.

3.1. Multiparity versus nulliparity for the overall UI
Of the 13 studies, 11 reported nulliparity as the reference parity. Moreover, 4 studies have shown the ORs of 1 parity compared to nulliparity, 4 on 2 parity, 6 on ≥3 parity, and 4 on any multiparity.
Our meta-analysis showed that the ORs of women with 1, 2, and ≥3 parity were 1.43 [95% confidence interval (95% CI): 0.90–2.28; I2 = 81.4%; n = 4], 1.50 (95% CI: 1.02–2.20; I2 = 82.5%; n = 4), and 1.58 (95% CI: 1.22–2.03; I2 = 70.1%; n = 7) compared with nulliparity. The OR for any multiparity to nulliparity was 1.68 (95% CI: 1.39–2.03; I2 = 0%; n = 4). Our results suggested that ≥2 parity may increase the risk of the overall UI for women compared with nulliparity. Figure 2 presents the forest plot of the results.
Figure 2.
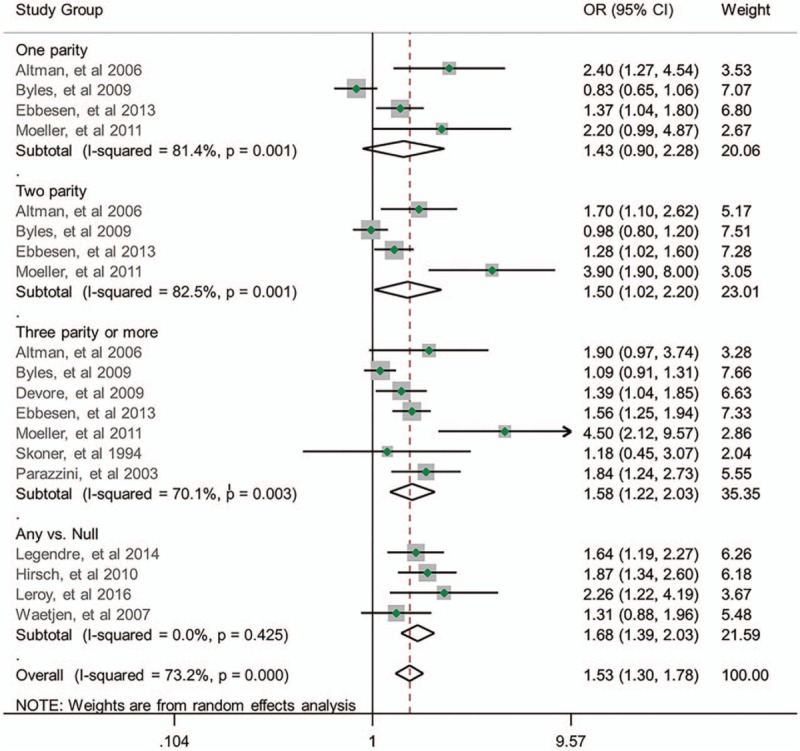
Relationship between parity number and risk of UI.
3.2. Meta-regression analysis
Thirteen studies can be used in the meta-regression analysis. These include another 2 studies with 1 parity as the reference. On the basis of the above-mentioned results, we centered all the reference parity to 0 to further explore the potential dose–response effect of parity on UI. Figure 3 presents the dose–response relationship. Our meta-regression analysis showed that, compared with nulliparity, each parity increase was associated with the increased risk of overall UI in women with ≥2 parity (OR = 1.13, 95% CI: 1.05–1.22).
Figure 3.
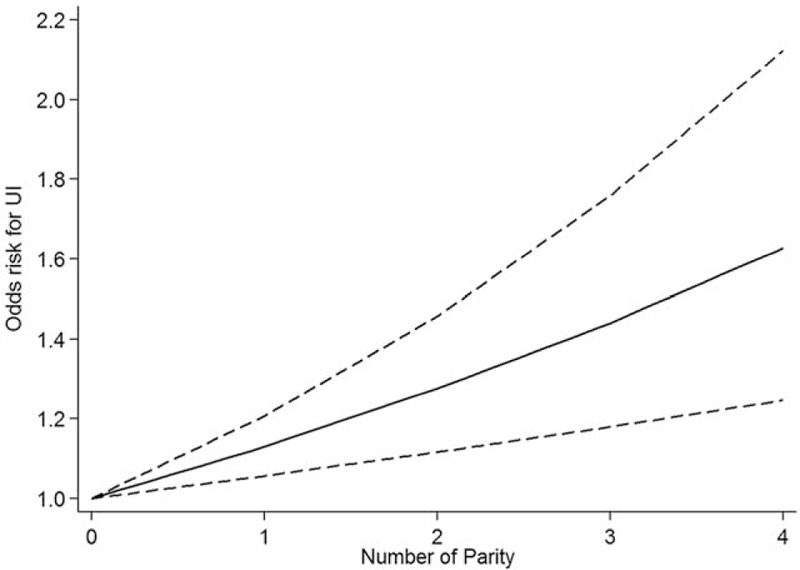
Dose–response relationship between parity and UI.
3.3. Sensitivity analysis, subgroup analysis, and publication bias
We excluded studies with low quality[21] and those that only provided crude OR.[24] Results showed significant decrease in heterogeneity, whereas the pooled ORs (random-effect) did not change (Figure S1). Compared with nulliparity, the ORs of women with 1, 2, and ≥3 parity were 1.68 (95% CI: 0.99–2.85; I2 = 60.42%; n = 2), 1.39 (95% CI: 1.08–1.78; I2 = 23.4%; n = 2), and 1.55 (95% CI: 1.33–1.81; I2 = 0%; n = 5), respectively.
A subgroup analysis was conducted considering the type of UI. There were 5 studies that focused on stress UI and 2 studies reported about urgency UI. We only combined the ORs of stress UI but not those of urgency UI because of the heterogeneous parity number. Our subgroup analysis showed that parity was significantly associated with the increased risk of stress UI, regardless of the parity numbers (OR = 2.32; 95% CI: 1.41–3.81; I2 = 0%; n = 2; 1 parity compared with null parity), as shown in Fig. 2. However, none of the 2 studies reported an association between urgency UI and parity (Fig. 4).
Figure 4.
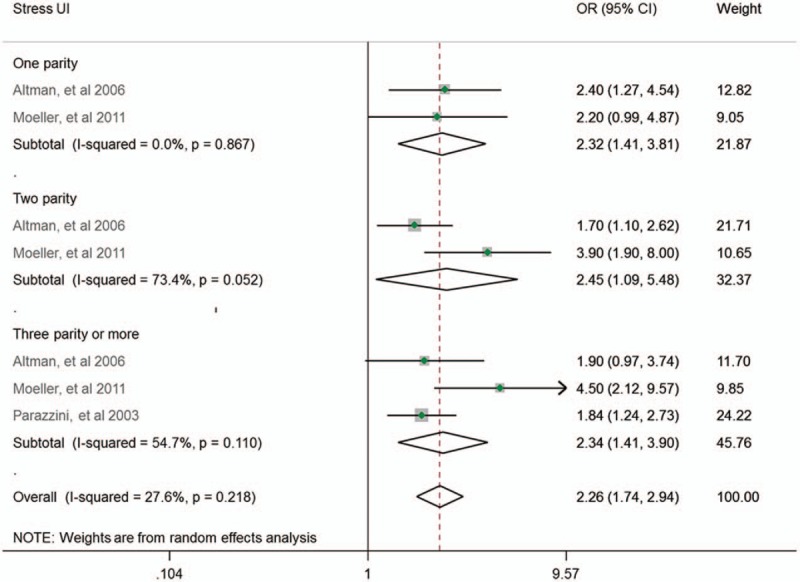
Subgroup analysis by type of UI.
Of the 13 studies, 6 did not clarify the definition of parity, 5 defined parity as delivery times, 1 defined parity as number of babies, and 1 defined parity as number of term pregnancies. Subgroup analysis showed that, for studies defined parity as deliver times, the ORs were larger than those without definition or with other definitions, but there were no substantial changes of the significance. The amount of heterogeneity was decreased (Figure S2).
We used the data of women with ≥3 parity for publication bias. Funnel plot suggested possible publication bias (Figure S3).
4. Discussion
To the best of our knowledge, this is the first meta-analysis that investigated the relationship between parity and the risk of UI. In this meta-analysis, we combined the effect sizes of the cohort and case–control studies for the assessment of a potential causation relationship between parity and UI. For overall UI, women with ≥2 parity had an increased risk for UI, and every increase in parity would increase the ORs for UI to approximately 12%. Meanwhile, for stress UI, women with ≥1 parity also had an increased risk for UI. However, we did not find any association between parity and urgency UI.
In our meta-analysis, 1 parity was associated with the increased risk of stress UI but not overall UI compared with nulliparity. This result may be partly attributed to the overall UI that includes both stress and urgency UI, and the later offsets the impact of parity on stress UI. Another possibility is the limited number of studies and sample size for overall UI with insufficient power to detect the difference.
UI is a disease associated with multiple mechanisms. Bladder overactivity, poor bladder control, and pelvic floor musculature impairment were all the direct causes of UI.[35] The results are attributed to pelvic floor musculature and connective tissue injury during the process of parturition that influences the normal urinary continence function.[4] However, this was also highly dependent on the type of delivery. In some studies, caesarean delivery was not associated with risk of UI.[29,36] In our meta-analysis, most of the studies did not report about the delivery type. As a result, the identification of the effects of delivery type becomes challenging.
In our meta-analysis on the overall UI, substantial heterogeneity was observed among the studies. Then, further sensitivity and subgroup analyses were conducted, and results showed a significant decrease in heterogeneity. Thus, it is reasonable to conclude that study quality, adjustment of confounding variables, the types of UI, and definition of parity are the main causes of heterogeneity. It is notable that, in subgroup analysis by definition of parity, we found studies defined parity as delivery times have larger ORs than those without definition or with other definitions. This indicates the definition of parity may influence the summarized results that delivery times have higher extent of harm for UI. Further original studies should pay attention with the definition.
Our meta-analysis has several key strengths. First, unlike previous cross-sectional study, case–control and cohort studies were included, and this allows us to detect the potential causation relationship between parity and UI. Second, we did not combine the ORs from different categories. Instead, we only combined the ORs with the same number of parity across studies. This ensures a statistically correct estimation of the confidence interval. More importantly, this method allows us to detect the impact of the different number of parity on UI. Third, we used a meta-regression analysis for dose–response effect estimation. Fourth, further analysis (sensitivity analysis) was conducted to ensure that the results were valid and clinically significant.
However, this study also has some limitations. In this meta-analysis, there were limited studies that reported about the relationship between parity and subtypes of UI, which makes it difficult to distinguish the difference in the effect of the 3 major types of UI. Furthermore, the categories differ across studies, and as a result, some information cannot be used in the current meta-analysis. For example, the study by Parazzini et al[29] considered 1 to 2 parity as one category, and such information cannot be combined in the 1 parity group or the 2 parity group. Moreover, publication bias was identified. Indeed, there were 2 other[33,34] potential studies. However, the corresponding authors of previous studies did not provide relevant data.
In conclusion, current evidence from case–control and cohort studies suggests that parity was associated with the increased risk of overall and stress UI but not urgency UI. Higher parity has a more significant effect on overall UI in a dose–response matter. However, these results should be interpreted with caution. Further high-quality cohort studies must be conducted to verify our results.
Author contributions
Z.H.H.: project development, search and screen literature, collect data, drafted the manuscript, revise manuscript; B.S: check the data, revise manuscript; G.Y-L: project development, screen literature, statistical analysis, and revise manuscript; Y.Z.H: quality assessment, revise manuscript; L.T.Z. and W.X.H. revise manuscript, provide professional guidance of UI.
Conceptualization: Hai-Hong Zhou.
Data curation: Hai-Hong Zhou, Bo Shu, Zhong-Hua Yang.
Formal analysis: Hai-Hong Zhou.
Methodology: Hai-Hong Zhou.
Project administration: Hai-Hong Zhou, Tong-Zu Liu, Yong-Lian Guo.
Software: Hai-Hong Zhou.
Supervision: Tong-Zu Liu, Xing-Huan Wang, Yong-Lian Guo.
Writing – original draft: Hai-Hong Zhou.
Writing – review & editing: Bo Shu, Tong-Zu Liu, Xing-Huan Wang, Zhong-Hua Yang, Yong-Lian Guo.
Supplementary Material
Footnotes
Abbreviations: CI = confidence interval, OR = odds ratio, UI = urinary incontinence.
The authors have no conflict of interest.
Supplemental Digital Content is available for this article.
References
- [1].Syan R, Brucker BM. Guideline of guidelines: urinary incontinence. BJU Int 2016;117:20–33. [DOI] [PubMed] [Google Scholar]
- [2].Almousa S, Bandin van Loon A. The prevalence of urinary incontinence in nulliparous adolescent and middle-aged women and the associated risk factors: a systematic review. Maturitas 2018;107:78–83. [DOI] [PubMed] [Google Scholar]
- [3].Abrams P, Cardozo L, Fall M, et al. The standardisation of terminology in lower urinary tract function: report from the standardisation sub-committee of the International Continence Society. Urology 2003;61:37–49. [DOI] [PubMed] [Google Scholar]
- [4].Wood LN, Anger JT. Urinary incontinence in women. BMJ 2014;349:g4531. [DOI] [PubMed] [Google Scholar]
- [5].Bortolotti A, Bernardini B, Colli E, et al. Prevalence and risk factors for urinary incontinence in Italy. Eur Urol 2000;37:30–5. [DOI] [PubMed] [Google Scholar]
- [6].Kozuki N, Lee AC, Silveira MF, et al. The associations of parity and maternal age with small-for-gestational-age, preterm, and neonatal and infant mortality: a meta-analysis. BMC Public Health 2013;13(suppl 3):S2. [DOI] [PMC free article] [PubMed] [Google Scholar]
- [7].Sampselle CM, Harlow SD, Skurnick J, et al. Urinary incontinence predictors and life impact in ethnically diverse perimenopausal women. Obstet Gynecol 2002;100:1230–8. [DOI] [PubMed] [Google Scholar]
- [8].Cheng CL, Li JR, Lin CH, et al. Positive association of female overactive bladder symptoms and estrogen deprivation: a nationwide population-based cohort study in Taiwan. Medicine (Baltimore) 2016;95:e4107. [DOI] [PMC free article] [PubMed] [Google Scholar]
- [9].Wang Y, Hu H, Xu K, et al. Prevalence, risk factors and the bother of lower urinary tract symptoms in China: a population-based survey. Int Urogynecol J 2015;26:911–9. [DOI] [PubMed] [Google Scholar]
- [10].Maral I, Ozkardeş H, Peşkircioğlu L, et al. Prevalence of stress urinary incontinence in both sexes at or after age 15 years: a cross-sectional study. J Urol 2001;165:408–12. [DOI] [PubMed] [Google Scholar]
- [11].Tseng LH, Liang CC, Lo HP, et al. The prevalence of urinary incontinence and associated risk factors in Taiwanese women with lower urinary tract symptoms. Chang Gung Med J 2006;29:596–602. [PubMed] [Google Scholar]
- [12].Lasserre A, Pelat C, Guéroult V, et al. Urinary incontinence in French women: prevalence, risk factors, and impact on quality of life. Eur Urol 2009;56:177–83. [DOI] [PubMed] [Google Scholar]
- [13].Peyrat L, Haillot O, Bruyere F, et al. Prevalence and risk factors of urinary incontinence in young and middle-aged women. BJU Int 2002;89:61–6. [DOI] [PubMed] [Google Scholar]
- [14].Sedgwick P. Cross sectional studies: advantages and disadvantages. BMJ 2014;348:g2276. [DOI] [PubMed] [Google Scholar]
- [15].Stroup DF, Berlin JA, Morton SC, et al. Meta-analysis of observational studies in epidemiology: a proposal for reporting. Meta-analysis Of Observational Studies in Epidemiology (MOOSE) group. JAMA 2000;283:2008–12. [DOI] [PubMed] [Google Scholar]
- [16].Lo CK, Mertz D, Loeb M. Newcastle-Ottawa Scale: comparing reviewers’ to authors’ assessments. BMC Med Res Methodol 2014;14:45. [DOI] [PMC free article] [PubMed] [Google Scholar]
- [17].Zhang J, Yu KF. What's the relative risk? A method of correcting the odds ratio in cohort studies of common outcomes. JAMA 1998;280:1690–1. [DOI] [PubMed] [Google Scholar]
- [18].Higgins JPT, Green S, editors. Cochrane Handbook for Systematic Reviews of Interventions Version 5.1.0 (updated March 2011). The Cochrane Collaboration; 2011. Available at: http://www.cochrane-handbook.org. Accessed March 14, 2018. [Google Scholar]
- [19].Xu C, Doi SAR. The robust error meta-regression method for dose-response meta-analysis. Int J Evid Based Healthc 2017;[Epub ahead of print]. [DOI] [PubMed] [Google Scholar]
- [20].Altman D, Ekström A, Gustafsson C, et al. Risk of urinary incontinence after childbirth: a 10-year prospective cohort study. Obstet Gynecol 2006;108:873–8. [DOI] [PubMed] [Google Scholar]
- [21].Byles J, Millar CJ, Sibbritt DW, et al. Living with urinary incontinence: a longitudinal study of older women. Age Ageing 2009;38:333–8. discussion 251. [DOI] [PubMed] [Google Scholar]
- [22].Devore EE, Townsend MK, Resnick NM, et al. The epidemiology of urinary incontinence in women with type 2 diabetes. J Urol 2012;188:1816–21. [DOI] [PMC free article] [PubMed] [Google Scholar]
- [23].Ebbesen MH, Hunskaar S, Rortveit G, et al. Prevalence, incidence and remission of urinary incontinence in women: longitudinal data from the Norwegian HUNT study (EPINCONT). BMC Urol 2013;13:27. [DOI] [PMC free article] [PubMed] [Google Scholar]
- [24].Herrmann V, Scarpa K, Palma PC, et al. Stress urinary incontinence 3 years after pregnancy: correlation to mode of delivery and parity. Int Urogynecol J Pelvic Floor Dysfunct 2009;20:281–8. [DOI] [PubMed] [Google Scholar]
- [25].Hirsch AG, Minassian VA, Dilley A, et al. Parity is not associated with urgency with or without urinary incontinence. Int Urogynecol J 2010;21:1095–102. [DOI] [PubMed] [Google Scholar]
- [26].Legendre G, Ringa V, Panjo H, et al. Incidence and remission of urinary incontinence at midlife: a cohort study. BJOG 2015;122:816–24. [DOI] [PubMed] [Google Scholar]
- [27].Leroy Lda S, Lúcio A, Lopes MH. Risk factors for postpartum urinary incontinence. Rev Esc Enferm USP 2016;50:200–7. [DOI] [PubMed] [Google Scholar]
- [28].Alling Møller L, Lose G, Jørgensen T. Risk factors for lower urinary tract symptoms in women 40 to 60 years of age. Obstet Gynecol 2000;96:446–51. [PubMed] [Google Scholar]
- [29].Parazzini F, Chiaffarino F, Lavezzari M, et al. Risk factors for stress, urge or mixed urinary incontinence in Italy. BJOG 2003;110:927–33. [PubMed] [Google Scholar]
- [30].Pizzoferrato AC, Fauconnier A, Quiboeuf E, et al. Urinary incontinence 4 and 12 years after first delivery: risk factors associated with prevalence, incidence, remission, and persistence in a cohort of 236 women. Neurourol Urodyn 2014;33:1229–34. [DOI] [PMC free article] [PubMed] [Google Scholar]
- [31].Skoner MM, Thompson WD, Caron VA. Factors associated with risk of stress urinary incontinence in women. Nurs Res 1994;43:301–6. [PubMed] [Google Scholar]
- [32].Waetjen LE, Liao S, Johnson WO, et al. Factors associated with prevalent and incident urinary incontinence in a cohort of midlife women: a longitudinal analysis of data: study of women's health across the nation. Am J Epidemiol 2007;165:309–18. [DOI] [PubMed] [Google Scholar]
- [33].Torkestani F, Zafarghandi N, Davati A, et al. Case-controlled study of the relationship between delivery method and incidence of post-partum urinary incontinence. J Int Med Res 2009;37:214–9. [DOI] [PubMed] [Google Scholar]
- [34].Otunctemur A, Danis E, Dursun M, et al. Coexistence of lower extremity varices and stress urinary incontinence in women. Eur Urol Suppl 2013;12:e1193. [Google Scholar]
- [35].Leach GE, Dmochowski RR, Appell RA, et al. Female Stress Urinary Incontinence Clinical Guidelines Panel summary report on surgical management of female stress urinary incontinence. The American Urological Association. J Urol 1997;158:875–80. [DOI] [PubMed] [Google Scholar]
- [36].Gyhagen M, Bullarbo M, Nielsen TF, et al. A comparison of the long-term consequences of vaginal delivery versus caesarean section on the prevalence, severity and bothersomeness of urinary incontinence subtypes: a national cohort study in primiparous women. BJOG 2013;120:1548–55. [DOI] [PubMed] [Google Scholar]
Associated Data
This section collects any data citations, data availability statements, or supplementary materials included in this article.


