

Abstract
We have developed the method for dynamic 320-row multidetector computed tomography (MDCT)-derived quantitative coronary flow reserve (CFRCT) and hyperemic myocardial blood flow (MBFCT). We evaluated diagnostic value of CFRCT and hyperemic MBFCT for detecting obstructive coronary artery disease (CAD) in per-patient and per-vessel analysis, and their relations with the severity of CAD burden.
Adenosine stressed and rest dynamic myocardial perfusion MDCT were prospectively performed in patients with known or suspected CAD. Per-patient and per-vessel MBFCT were estimated from dynamic perfusion images in rest and hyperemic phases, and per-patient and per-vessel CFRCT were calculated from the ratio of rest and hyperemic MBFCT. Degree of stenosis was evaluated by coronary CT angiography (CTA) and invasive coronary angiography (ICA). Obstructive stenosis was defined as ≥70% stenosis in ICA. CAD burden with MDCT was calculated by logarithm transformed coronary artery calcium (CAC) score and the CTA-adapted Leaman risk score (CT-LeSc). A logistic regression analysis was used to measure the receiver-operating characteristic curve and corresponding area under the curve (AUC) for the detection of obstructive CAD.
Twenty-seven patients and 81 vessels were eligible for this study. Sixteen patients had obstructive CAD, and 31 vessels had obstructive stenosis. Using an optimal cutoff, the CFRCT and hyperemic MBFCT had the moderate diagnostic values in per-patient (AUC = 0.89 and 0.86, respectively) and per-vessel (AUC = 0.79 and 0.76, respectively). Per-patient CFRCT and hyperemic MBFCT exhibited a moderate inverse correlation with CAC score and the CT-LeSc.
Per-patient and per-vessel CFRCT as well as hyperemic MBFCT had moderate diagnostic value for detecting obstructive CAD. These per-patient values exhibited a moderate inverse correlation with CAD burden. CFRCT and hyperemic MBFCT might add quantitative functional information for evaluating patients with CAD.
Keywords: coronary artery disease, coronary flow reserve, multidetector computed tomography, myocardial blood flow, myocardial perfusion imaging
1. Introduction
The detection of obstructive coronary stenosis is essential in assessments of coronary artery disease (CAD). A visual qualitative evaluation of single-phase computed tomography (CT) myocardial perfusion (CTP) combined with coronary CT angiography (CTA) could correctly identify patients with obstructive stenosis with ischemia.[1,2] However, single-phase CTP has a difficulty to select the optimal scan timing, and the qualitative evaluations were associated with more interobserver bias than the quantitative evaluation.[3]
Using low-dose dynamic CTP with 320-row multidetector CT (MDCT) and validated with 15O-water positron emission tomography (PET), we have developed a method to estimate myocardial blood flow (MBFCT) and coronary flow reserve (CFRCT) from CT.[4] However, the diagnostic values of per-patient and per-vessel CFRCT and MBFCT for detecting obstructive CAD have not been investigated.
We hypothesized that the coronary plaque burden as severity of CAD might inversely correlate with the per-patient MBFCT and CFRCT. To score the stenosis severity of entire coronary arteries, CTA-adapted Leaman score (CT-LeSc), which integrates the number of affected vessels, calcification, and the location of disease with obstructive stenosis, has been used.[5] Moreover, to score the coronary calcification severity, we calculated the coronary artery calcium (CAC) score.[6]
The aims of our study are as follows: to investigate the diagnostic performances of CFRCT and MBFCT for detecting obstructive CAD in per-patient and per-vessel analyses, and to evaluate their relationships with the CT-LeSc and the CAC score.
2. Methods
2.1. Patient population
This study was a prospective, single-center observational study performed from March 2013 to February 2017. It was approved by the regional ethics committee, and all patients provided written informed consent to participate. Patients with known or suspected CAD hospitalized visiting our hospital were included. The exclusion criteria included patients with suspected acute coronary syndrome, known allergy to iodinated contrast media, asthma, chronic kidney disease (estimated glomerular filtration rate < 30 mL/m2), 2nd- or 3rd-degree atrial-ventricular block, previous cardiac surgery, coronary intervention within the past 6 months, prior myocardial infarction and age <20 years.
Questionnaires were obtained from all patients, including coronary risk factors such as age, sex, body mass index, chest pain, hypertension, dyslipidemia, diabetes mellitus, smoking, and history of myocardial infarction and revascularization.
2.2. CT imaging acquisition
All images were acquired using a 2nd-generation 320-row MDCT system (Aquilion ViSION; Canon Medical Systems Corporation, Otawara, Japan). CTP dynamic scans were performed with a tube voltage of 80 kV and tube current of 120 mA at 70% to 80% of the R-R interval. The gantry rotation time was 275 milliseconds, and reconstruction was performed at 1-mm intervals using Adaptive Iterative Dose Reduction 3D (AIDR 3D) and beam-hardening correction. Coronary CTA images were obtained using a boost scan with the same tube voltage, but higher tube current (650–800 mA) and thin slice reconstruction (0.5 mm) at 75% of the R-R interval.
The protocols for coronary CTA and CTP have been previously published in detail.[4] Briefly, first, a noncontrast image was obtained to determine the CAC score.[7] Second, during a continuous 6-minute infusion of adenosine triphosphate (0.16 mg/kg/min), hyperemic dynamic CTP imaging was performed for 25 seconds with 50 mL of iodinated contrast (350 mg I/mL) and 30 mL saline chaser (5.0 mL/s). Third, resting CTP was performed after a 15-minute interval, similar to the method used for the hyperemic dynamic CTP protocol, with a boost scan for coronary CTA.
During the protocol, the blood pressure, heart rate, and electrocardiogram were monitored, and the rate pressure product was calculated.
2.3. Coronary CTA and invasive coronary angiography data analysis
Coronary CTA data were reconstructed, and the CAC score was automatically calculated at a dedicated workstation (Ziostation 2 Plus; Ziosoft, Tokyo, Japan). The image quality was assessed visually and scored using a 4-point scale (4 = no artifacts, 3 = good diagnostic quality with minor artifacts, 2 = acceptable diagnostic quality with moderate artifacts, and 1 = unacceptable diagnostic quality with severe artifacts). The Coronary Artery Disease Reporting and Data System (CAD-RADS) is a standardized classification system suggested by the Society of Cardiovascular Computed Tomography, which shows excellent interobserver agreement.[8] According to CAD-RADS, diameter stenosis grades (0%, 1–49%, 50–69%, and 70–100%) and the composition (calcified or noncalcified) were evaluated in the left anterior descending artery (LAD), left circumflex coronary artery (LCX), and right coronary artery (RCA).[9] If more than 1 stenosis was present in the same vessel, the most severe stenosis was used. Patients with ≥50% stenosis on coronary CTA were additionally performed invasive coronary angiography. Diameter stenosis grades on invasive coronary angiography were visually evaluated in the same way as coronary CTA. We defined ≥70% stenosis in invasive coronary angiography as obstructive stenosis. A patient with at least 1 vessel ≥70% stenosis was diagnosed as the obstructive CAD patient.
Per-patient CAD severity was evaluated using the CT-LeSc, which was calculated by scoring the stenosis severity (obstructive or not), the composition (calcified or noncalcified), and the localization differentiated by 18-segmental stenosis and coronary artery dominance in coronary CTA.[5]
2.4. CTP data analysis
Image registration (Canon Medical Systems Corporation) was applied for motion correction. Consequently, the CTP images were displayed as 1-mm slices in a short-axis orientation and visually assessed for image quality using an algorithm similar to that used for coronary CTA. The contours of the left ventricular (LV) myocardium and LV cavity were set by experienced physicians to obtain these regions of interest (ROIs). The LV myocardial ROI was automatically segmented and assigned to the appropriate vascular territories based on the American Heart Association model.[10]
Time attenuation curves (TACs) were generated for the myocardium of whole LV, of each vascular territory (LAD, LCX, and RCA), and the LV cavity. The TACs were converted to contrast concentration curves as previously validated in a phantom study. Resting and hyperemic MBFCT were calculated using a single-tissue compartment model with the Renkin–Crone equation validated by 15O-water PET. The MBFCT was expressed as a unit of mL/g/min. Per-patient MBFCT was derived from TAC of the LV myocardium, and per-vessel MBFCT was derived from TACs of each vascular territory. Finally, per-patient and per-vessel CFRCT were calculated as the ratios of hyperemic MBFCT to resting MBFCT.[4]
2.5. CT radiation dosage
Radiation doses were estimated using the dose-length product, which was multiplied by a constant (k = 0.014 mSv/mGy/cm) to convert to an effective dose based on the European guidelines on quality criteria for CT.
2.6. Statistical analysis
Continuous variables are presented as the mean ± standard deviation and were compared using Student t test without CAC score and CT-LeSc. Since the scores followed a marked skewed distribution, CAC score and CT-LeSc are presented as median (interquartile range), each CAC score was transformed to a logarithm (CAC score + 1) to approximate the normal distribution, and the CT-LeSc was compared using the nonparametric Wilcoxon rank-sum test. Categorical variables are presented as percentages and were compared by the Chi-squared test or Fisher exact test, as appropriate.
To describe the diagnostic performance, a logistic regression analysis was used to measure the receiver-operating characteristic (ROC) curve and corresponding area under the curve (AUC). Optimal cutoff value was calculated by Youden index from ROC curves. The Chi-squared test was used to compare AUCs. Pearson correlation coefficients were calculated for continuous variables. P-values <.05 were defined as significant. All of the statistical analyses were performed using the dedicated software packages JMP 12.0 (SAS Institute, Cary, NC) and PRISM 7.0 (GraphPad Software, San Diego, CA).
3. Results
3.1. Patient and vessel characteristics
Of the consecutive 41 patients performed dynamic CT perfusion, a total of 27 patients and 81 vessels were eligible for the analysis; the 14 excluded patients were as follows, 5 patients were by technical failure of the scanning protocol, 3 were refused invasive coronary angiography despite they had ≥50% stenosis on coronary CTA, 2 patients had severe artifacts by pacemaker, 2 patients had poor image quality by high BMI, 1 patient showed an incomplete adenosine triphosphate infusion, and 1 patient had coronary anomaly (Fig. 1).
Figure 1.
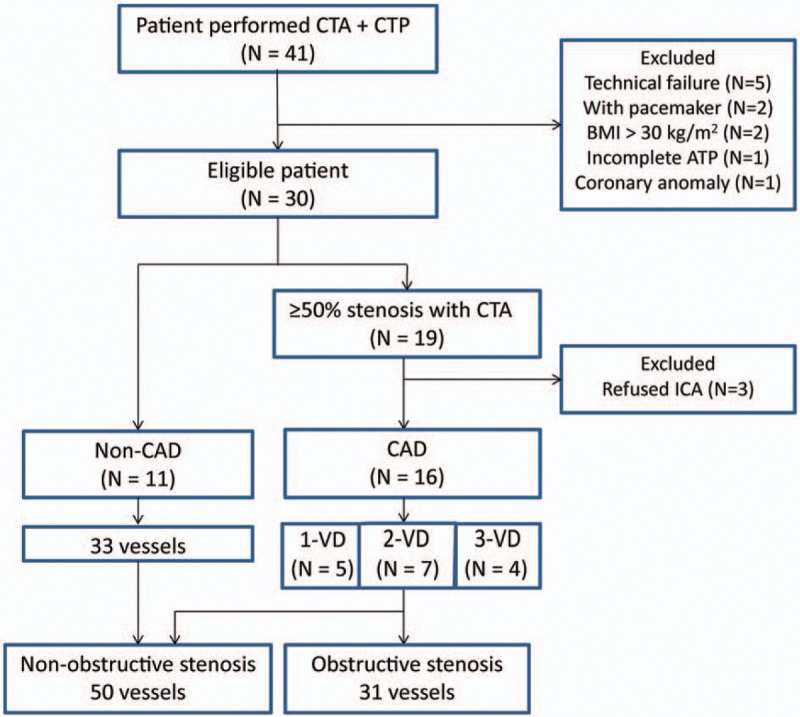
Patient flowchart. CAD = coronary artery disease, CT = computed tomography, CTA = CT angiography, CTP = CT perfusion, ICA = invasive coronary angiography.
Table 1 shows the characteristics of the patients and their vessels. Out of 27 patients, 16 underwent invasive coronary angiography and were diagnosed with obstructive CAD. Single-vessel disease, 2-vessel disease, and 3-vessel disease were seen in 5, 7, and 4 patients, respectively; a total of 31 vessels showed obstructive stenosis. Thirty percent of studied patients had severe calcification (CAC score ≥ 400). The CAD group had significantly higher CAC scores and significantly higher CT-LeSc values compared to the non-CAD group. Representative cases with CAD are shown in Figure 2.
Table 1.
Patient characteristics.
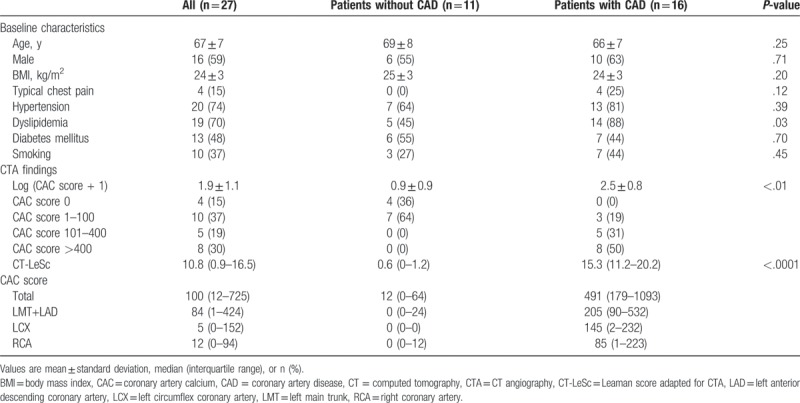
Figure 2.
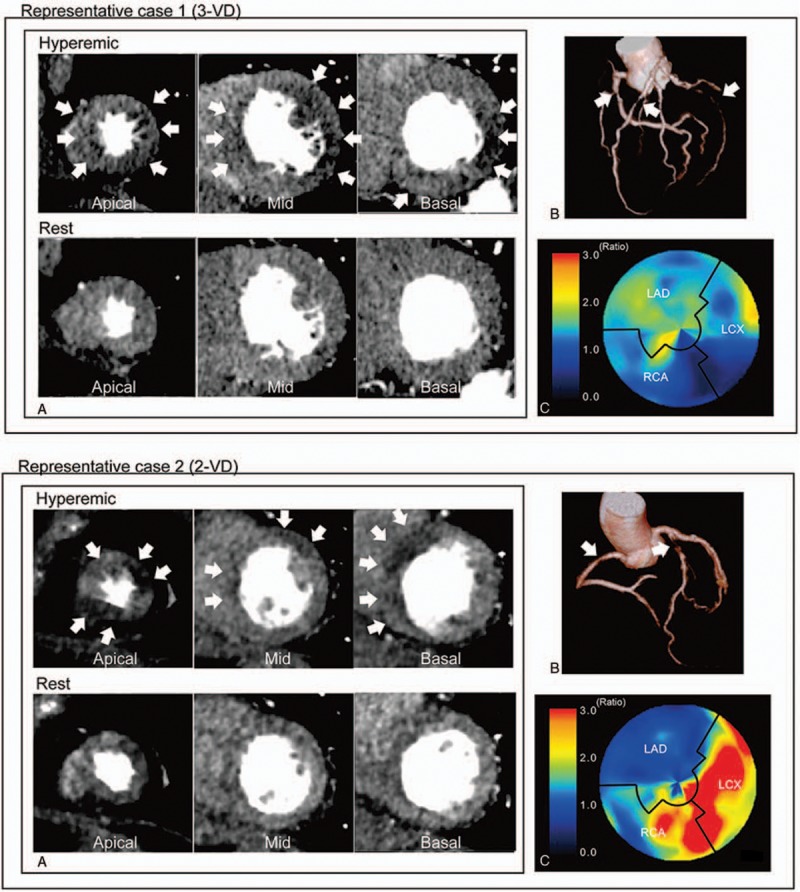
Representative cases’ (A) CTP images, (B) CTA image, and (C) polar map of CFRCT. Case 1 had 3-vessel disease (3-VD) in the LAD, LCX, and RCA, and CTP images represented severe ischemia in the whole left ventricular. The per-patient CFRCT was 1.14, and the per-vessel CFRCT of the LAD, LCX, and RCA regions were 1.25, 1.06, and 1.19, respectively. Case 2 had 2-vessel disease (2-VD) in the LAD and RCA, and CTP images showed severe ischemia in regions of the LAD and RCA. The per-patient CFRCT was 1.59 and the per-vessel CFRCT of the LAD, LCX, and RCA regions were 1.01, 3.02, and 1.70, respectively. CFRCT = coronary flow reserve derived by CT, CT = computed tomography, CTA = CT angiography, CTP = CT perfusion, LAD = left anterior descending artery, LCX = left circumflex artery, MBFCT = myocardial blood flow derived by CT, RCA = right coronary artery.
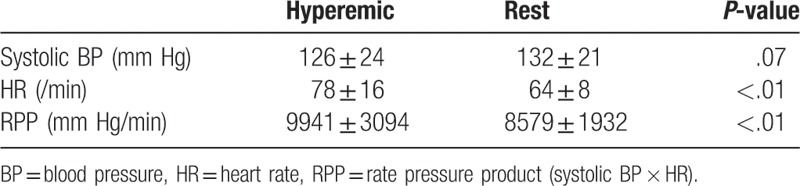
The radiation dose was 11.8 ± 2.4 mSv. As shown in Tables 2 and 3, the heart rate and rate pressure product in the hyperemic were significantly elevated compared to the rest. The per-vessel coronary CTA imaging quality score was 3.6 ± 0.7, and all coronary segments could be assessed for stenosis. The per-vessel CTP imaging quality score was 4.0 ± 0.2 at rest and 3.8 ± 0.4 in the hyperemic. All studied data were acceptable for the calculation of CFRCT and MBFCT.
Table 2.
Hemodynamics in hyperemic and rest phase (non-coronary artery disease).
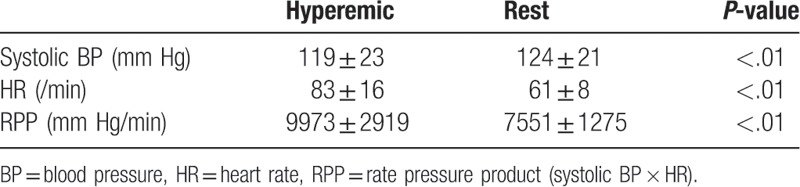
Table 3.
Hemodynamics in hyperemic and rest phase (coronary artery disease).
3.2. Per-patient analysis
Both CFRCT and hyperemic MBFCT in obstructive CAD group were significantly lower compared to the non-CAD group. The ROC curves of CFRCT and hyperemic MBFCT for the detection of obstructive CAD assessed by invasive coronary angiography are shown in Figure 3. The AUCs for CFRCT and hyperemic MBFCT were 0.89 (95% confidence interval [CI] 0.76–1.00, P = .0008) and 0.86 (95% CI 0.73–1.00, P = .002), respectively, which did not differ in the model comparisons of the ROC analysis (P = .59). With the use of an optimal cutoff value of CFRCT 2.0, the sensitivity, specificity, positive predictive value (PPV), and negative predictive value (NPV) were 88%, 82%, 88%, and 82%, respectively. With the use of the cutoff of hyperemic MBFCT 1.2 mL/g/min, the corresponding values were 69%, 100%, 100%, and 65%, respectively (Fig. 3).
Figure 3.
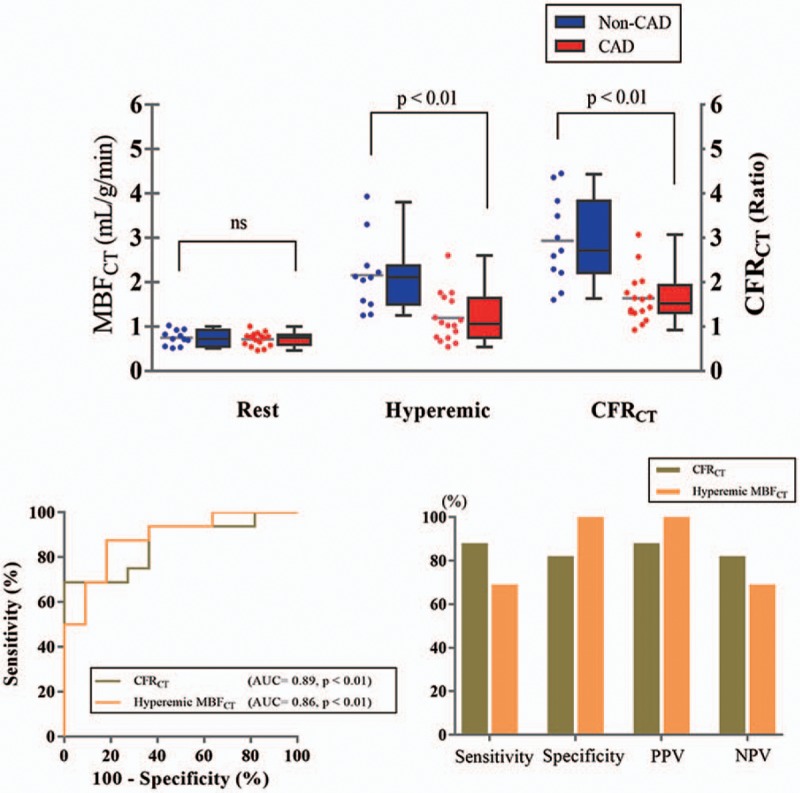
(A) Per-patient resting MBFCT, hyperemic MBFCT, and CFRCT of CAD group and non-CAD group. (B) The receiver-operating characteristic curve analysis of per-patient CFRCT and hyperemic MBFCT for the detection of CAD, and the sensitivity, specificity, PPV, and NPV with the use of optimal cutoff values (with a ratio of 2.0 of CFRCT and with 1.2 mL/g/min of hyperemic MBFCT). CAD = patient with more than 50% stenosis in the coronary arteries, CFRCT = coronary flow reserve derived by CT, CT = computed tomography, MBFCT = myocardial blood flow derived by CT, non-CAD = patient with <50% or no stenosis in the coronary arteries, NPV = negative predictive value, PPV = positive predictive value.
Per-patient analysis showed that CFRCT (r = −0.55, P < .01) and hyperemic MBFCT (r = −0.50, P < .01) exhibited moderate inverse correlations with CT-LeSc (Fig. 4). The logarithm-transformed CAC score showed moderate inverse correlations with CFRCT (r = −0.50, P < .01) and hyperemic MBFCT (r = −0.46, P = .01) (Fig. 5).
Figure 4.
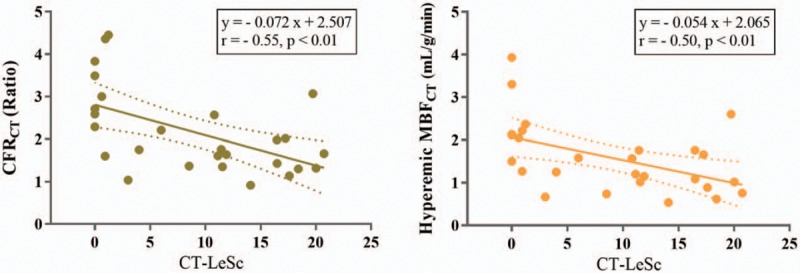
The relationships between CT-LeSc and per-patient CFRCT or hyperemic MBFCT. Dashed lines indicate the 95% mean confidence interval. CFRCT = coronary flow reserve derived by CT, CT = computed tomography, CT-LeSc = Leaman score adopted CT angiography, MBFCT = myocardial blood flow derived by CT.
Figure 5.
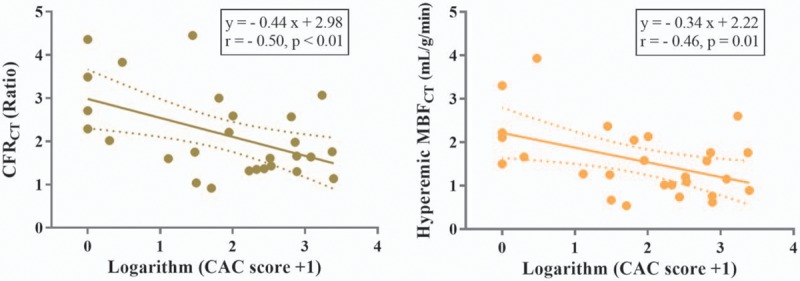
The relationship between logarithm-transformed CAC scores and per-patient CFRCT or hyperemic MBFCT. Dashed lines indicate the 95% mean confidence interval. CAC = coronary artery calcium, CFRCT = coronary flow reserve derived by CT, CT = computed tomography, MBFCT = myocardial blood flow derived by CT.
3.3. Per-vessel analysis
The CFRCT and hyperemic MBFCT in the regions with obstructive stenosis were significantly lower compared to the regions with nonobstructive stenosis (Fig. 6). The AUCs of CFRCT and hyperemic MBFCT were 0.79 (95% CI 0.67–0.87, P < .0001) and 0.76 (95% CI 0.64–0.86, P = .0002), respectively; no significant differences were observed (P = .51). The sensitivity, specificity, PPV, and NPV using a cutoff of CFRCT 1.6 were 61%, 82%, 68%, and 77%, respectively. Using the cutoff of hyperemic MBFCT 1.2 mL/g/min, the corresponding values were 68%, 80%, 68%, and 80%, respectively (Fig. 6).
Figure 6.
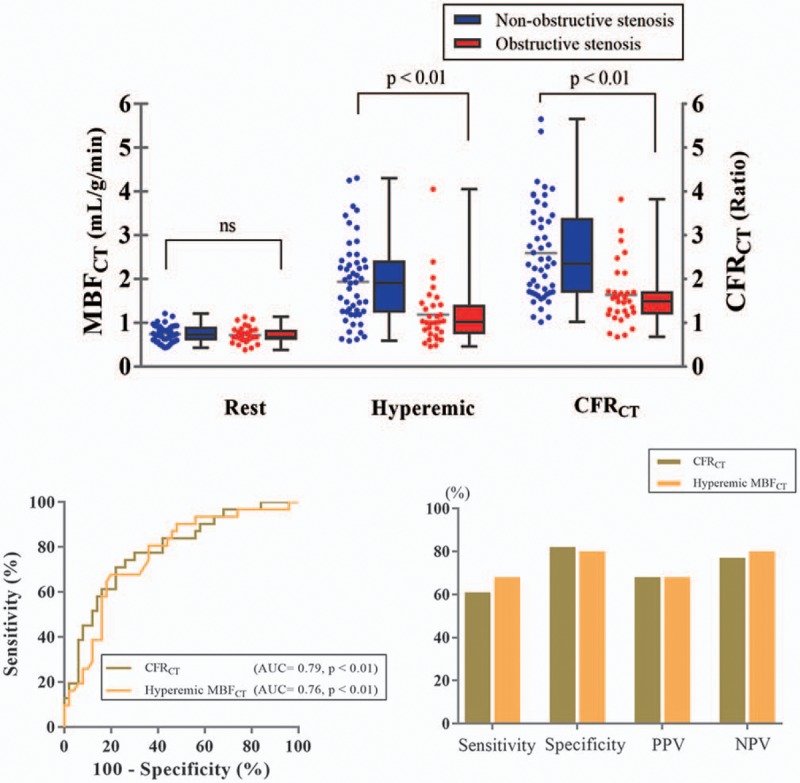
(A) Per-vessel resting MBFCT, hyperemic MBFCT, and CFRCT of vessels with obstructive stenosis and nonobstructive stenosis. (B) The receiver-operating characteristic curve analysis of per-vessel CFRCT and hyperemic MBFCT for the detection of obstructive stenosis, and the sensitivity, specificity, PPV, and NPV with the use of optimal cutoff values (with a ratio of 1.6 of CFRCT and with 1.2 mL/g/min of hyperemic MBFCT). CFRCT = coronary flow reserve derived by CT, CT = computed tomography, MBFCT = myocardial blood flow derived by CT, NPV = negative predictive value, PPV = positive predictive value.
Additionally, when stenosis of 50% diameter on ICA was considered as the criteria, the AUCs of CFRCT and hyperemic MBFCT were 0.82 (95% CI 0.73–0.91, P < .01) and 0.78 (95% CI 0.68–0.88, P < .01), respectively; no significant differences were observed (P = .13). The sensitivity, specificity, PPV, and NPV using a cutoff of CFRCT 1.7 were 71%, 86%, 86%, and 69%, respectively. Using a cutoff of hyperemic MBFCT 1.6 mL/g/min, the corresponding values were 80%, 67%, 75%, and 73%, respectively.
4. Discussion
This is the first study to investigate the diagnostic performance of CFRCT and hyperemic MBFCT using 320-row MDCT in patients with suspected or known CAD. CFRCT and hyperemic MBFCT had sufficient sensitivity, PPV, and NPV to detect obstructive CAD assessed by invasive coronary angiography both in per-patient and in per-vessel analyses. These data suggest that CFRCT and hyperemic MBFCT might add quantitative functional information to coronary CTA.
We observed that per-patient CFRCT and hyperemic MBFCT were correlated with the CT-LeSc and the CAC score as coronary plaque burden, which are known to correlate with cardiovascular events.[11–13] CFR determined by PET can be used to identify patients at high risk for cardiovascular events and to modify therapeutic strategies.[14] Thus, per-patient CFRCT and hyperemic MBFCT have the possibility of being useful for evaluating not only coronary functional stenosis but also microvascular dysfunction. A recent stress perfusion magnetic resonance imaging (MRI) study reported that when the myocardial perfusion reserve (stress MBF/rest MBF) becomes significantly impaired, it could be due to obstructive epicardial CAD or coronary microvascular dysfunction.[15] Among our 11 nonobstructive CAD patients, 2 patients showed significantly low CFR (<2.0). Both patients had diabetes mellitus and other risk factors (smoker, dyslipidemia, or hypertension) that might cause the microvascular dysfunction.[16] Further studies are needed for investigations of the relationships between coronary risk factors underlying microvascular dysfunction.
Tawfik et al reported that iodine content quantification with dual-source CT had higher accuracy than iodine enhancement measurements.[17] MBFCT has also been studied using dual-source CT, and a commercially available software package was developed for this purpose (Syngo 3D; MMW, Siemens, Erlangen, Germany).[18,19] The hyperemic MBFCT index was reported as a better tool to identify functionally obstructive coronary lesions (fractional flow reserve < 0.75) than visual coronary CTA alone.[20] CFRCT was significantly higher in low-risk controls compared to patients with CAD.[21] Meinel et al reported that patients with global MBF < 1.21 mL/mg/min were at increased risk for major adverse cardiac events, which was similar cutoff value of our global MBFCT for obstructive CAD.[22] We used low tube voltage at 80 kV using the Toshiba hybrid iterative reconstruction (AIDR 3D) for noise reduction, and validated with 15O-water PET, known as a gold standard for quantification of MBF.[4,23] Thus, the MBFCT measured by our method could be the best representative of quantitative MBF derived by 15O-water PET.
This study has several limitations. Our results represent a single-center analysis of small number patients. Dynamic CT imaging requires 25 seconds of breath holding, radiation exposure of 12 mSv, and 100 mL of iodinated contrast agent.[4] However, all patients in the present study (even mean age was 67 years old) could perform the breath hold. Further our study also suggests a hyperemic-only CTP protocol may be reduce radiation exposure and contrast agent in the future, since the diagnostic value of hyperemic MBFCT was similar to that of CFRCT. The second limitation of this study was that the definition of obstructive stenosis was not a fractional flow reserve, but ≥70% stenosis on invasive coronary angiography. It is possible that fractional flow reserve was not impaired even in ≥70% stenosis. However, myocardial ischemia was confirmed in most patients in the obstructive CAD group using single photon emission computed tomography, MRI, or PET, although 3 did not undergo any functional tests. The 3 patients who did not undergo functional tests showed severe stenosis (≥90%) in the proximal coronary artery and underwent percutaneous coronary intervention immediately after the CT perfusion study.
In conclusion, quantitative per-patient and per-vessel CFRCT as well as hyperemic MBFCT assessed with 320-row MDCT, showed a moderately good diagnostic performance for identifying patients with obstructive CAD in a clinical setting. CFRCT and MBFCT are clinically useful for evaluating CAD and may contribute to pathophysiologic investigations of CAD.
Author contributions
Project administration: Noriko Oyama-Manabe.
Resources: Masanao Naya, Tadao Aikawa, Tsukasa Sasaki, Yasuka Kikuchi.
Software: Yuuki Tomiyama, Chietsugu Katoh.
Supervision: Noriko Oyama-Manabe, Osamu Manabe, Nagara Tamaki, Hiroyuki Tsutsui.
Writing – original draft: Masahiko Obara.
Footnotes
Abbreviations: AUC = area under curve, CAC score = coronary artery calcium score, CAD = coronary artery disease, CAD-RADS = The Coronary Artery Disease Reporting and Data System, CFR = coronary flow reserve, CFRCT = coronary flow reserve derived from computed tomography, CTA = coronary computed tomography angiography, CT-LeSc = coronary computed tomography angiography-adapted Leaman score, CTP = computed tomography perfusion, ICA = invasive coronary angiography, LAD = left anterior descending artery, LCX = left circumflex coronary artery, LV = left ventricle, MBF = myocardial blood flow, MBFCT = myocardial blood flow derived from computed tomography, MDCT = multidetector computed tomography, NPV = negative predictive value, PET = positron emission tomography, PPV = positive predictive value, RCA = right coronary artery, ROI = region of interest, TAC = time attenuation curve.
The authors of this manuscript declare relationships with the following companies: Canon Medical Systems Corporation (MN, NO-M, OM, and MO). This work was supported in part by the Canon Medical Systems, Takeda Science Foundation (MN), and a JSPS KAKENHI grant (no: 26461780).
The authors have no conflicts of interest to disclose.
References
- [1].Rochitte CE, George RT, Chen MY, et al. Computed tomography angiography and perfusion to assess coronary artery stenosis causing perfusion defects by single photon emission computed tomography: the CORE320 study. Eur Heart J 2014;35:1120–30. [DOI] [PMC free article] [PubMed] [Google Scholar]
- [2].Magalhaes TA, Kishi S, George RT, et al. Combined coronary angiography and myocardial perfusion by computed tomography in the identification of flow-limiting stenosis - The CORE320 study: an integrated analysis of CT coronary angiography and myocardial perfusion. J Cardiovasc Comput Tomogr 2015;9:438–45. [DOI] [PMC free article] [PubMed] [Google Scholar]
- [3].Bischoff B, Bamberg F, Marcus R, et al. Optimal timing for first-pass stress CT myocardial perfusion imaging. Int J Cardiovasc Imaging 2013;29:435–42. [DOI] [PubMed] [Google Scholar]
- [4].Kikuchi Y, Oyama-Manabe N, Naya M, et al. Quantification of myocardial blood flow using dynamic 320-row multi-detector CT as compared with (1)(5)O-H(2)O PET. Eur Radiol 2014;24:1547–56. [DOI] [PubMed] [Google Scholar]
- [5].de Araujo Goncalves P, Garcia-Garcia HM, Dores H, et al. Coronary computed tomography angiography-adapted Leaman score as a tool to noninvasively quantify total coronary atherosclerotic burden. Int J Cardiovasc Imaging 2013;29:1575–84. [DOI] [PubMed] [Google Scholar]
- [6].Agatston AS, Janowitz WR, Hildner FJ, et al. Quantification of coronary artery calcium using ultrafast computed tomography. J Am Coll Cardiol 1990;15:827–32. [DOI] [PubMed] [Google Scholar]
- [7].Qian Z, Anderson H, Marvasty I, et al. Lesion- and vessel-specific coronary artery calcium scores are superior to whole-heart Agatston and volume scores in the diagnosis of obstructive coronary artery disease. J Cardiovasc Comput Tomogr 2010;4:391–9. [DOI] [PubMed] [Google Scholar]
- [8].Razek AAKA, Elrakhawy MM, Yossof MM, et al. Inter-observer agreement of the coronary artery disease reporting and data system (CAD-RADS™) in patients with stable chest pain. Pol J Radiol 2018;83:e151–9. [DOI] [PMC free article] [PubMed] [Google Scholar]
- [9].Abbara S, Arbab-Zadeh A, Callister TQ, et al. SCCT guidelines for performance of coronary computed tomographic angiography: a report of the Society of Cardiovascular Computed Tomography Guidelines Committee. J Cardiovasc Comput Tomogr 2009;3:190–204. [DOI] [PubMed] [Google Scholar]
- [10].Cerqueira MD, Weissman NJ, Dilsizian V, et al. Standardized myocardial segmentation and nomenclature for tomographic imaging of the heart. A statement for healthcare professionals from the Cardiac Imaging Committee of the Council on Clinical Cardiology of the American Heart Association. Int J Cardiovasc Imaging 2002;18:539–42. [PubMed] [Google Scholar]
- [11].Mushtaq S, De Araujo Goncalves P, Garcia-Garcia HM, et al. Long-term prognostic effect of coronary atherosclerotic burden: validation of the computed tomography-Leaman score. Circ Cardiovasc Imaging 2015;8:e002332doi: 10.1161/CIRCIMAGING.114.002332. [DOI] [PubMed] [Google Scholar]
- [12].Cho I, Chang HJ, Ó Hartaigh B, et al. Incremental prognostic utility of coronary CT angiography for asymptomatic patients based upon extent and severity of coronary artery calcium: results from the COronary CT Angiography EvaluatioN For Clinical Outcomes InteRnational Multicenter (CONFIRM) study. Eur Hear J 2015;36:501–8. [DOI] [PMC free article] [PubMed] [Google Scholar]
- [13].Budoff MJ, Mohlenkamp S, McClelland R, et al. A comparison of outcomes with coronary artery calcium scanning in unselected populations: the Multi-Ethnic Study of Atherosclerosis (MESA) and Heinz Nixdorf RECALL study (HNR). J Cardiovasc Comput Tomogr 2013;7:182–91. [DOI] [PMC free article] [PubMed] [Google Scholar]
- [14].Taqueti VR, Hachamovitch R, Murthy VL, et al. Global coronary flow reserve is associated with adverse cardiovascular events independently of luminal angiographic severity and modifies the effect of early revascularization. Circulation 2015;131:19–27. [DOI] [PMC free article] [PubMed] [Google Scholar]
- [15].Liu A, Wijesurendra RS, Liu JM, et al. Gadolinium-free cardiac MR stress T1-mapping to distinguish epicardial from microvascular coronary disease. J Am Coll Cardiol 2018;71:957–68. [DOI] [PMC free article] [PubMed] [Google Scholar] [Retracted]
- [16].Tsukamoto T, Morita K, Naya M, et al. Myocardial flow reserve is influenced by both coronary artery stenosis severity and coronary risk factors in patients with suspected coronary artery disease. Eur J Nucl Med Mol Imaging 2006;33:1150–6. [DOI] [PubMed] [Google Scholar]
- [17].Tawfik AM, Razek AA, Kerl JM, et al. Comparison of dual-energy CT-derived iodine content and iodine overlay of normal, inflammatory and metastatic squamous cell carcinoma cervical lymph nodes. Eur Radiol 2014;24:574–80. [DOI] [PubMed] [Google Scholar]
- [18].Vliegenthart R, De Cecco CN, Wichmann JL, et al. Dynamic CT myocardial perfusion imaging identifies early perfusion abnormalities in diabetes and hypertension: insights from a multicenter registry. J Cardiovasc Comput Tomogr 2016;10:301–8. [DOI] [PubMed] [Google Scholar]
- [19].Bamberg F, Klotz E, Flohr T, et al. Dynamic myocardial stress perfusion imaging using fast dual-source CT with alternating table positions: initial experience. Eur Radiol 2010;20:1168–73. [DOI] [PubMed] [Google Scholar]
- [20].Rossi A, Dharampal A, Wragg A, et al. Diagnostic performance of hyperaemic myocardial blood flow index obtained by dynamic computed tomography: does it predict functionally significant coronary lesions? Eur Heart J Cardiovasc Imaging 2014;15:85–94. [DOI] [PubMed] [Google Scholar]
- [21].Ho KT, Ong HY, Tan G, et al. Dynamic CT myocardial perfusion measurements of resting and hyperaemic blood flow in low-risk subjects with 128-slice dual-source CT. Eur Heart J Cardiovasc Imaging 2015;16:300–6. [DOI] [PubMed] [Google Scholar]
- [22].Meinel FG, Wichmann JL, Schoepf UJ, et al. Global quantification of left ventricular myocardial perfusion at dynamic CT imaging: Prognostic value. J Cardiovasc Comput Tomogr 2017;11:16–24. [DOI] [PubMed] [Google Scholar]
- [23].Gaemperli O, Kaufmann PA. PET and PET/CT in cardiovascular disease. Ann N Y Acad Sci 2011;1228:109–36. [DOI] [PubMed] [Google Scholar]