Diagnosing glaucoma remains a challenging task, as there is no single test that can reliably tell the clinician whether glaucomatous damage is present. Traditionally, the clinician depends upon the pattern of damage seen on both structural and functional tests to diagnose glaucoma. Worldwide, the most common functional test used is static automated perimetry, most typically with a grid of test points spaced 6° apart, such as in the 24-2 or 30-2 patterns of the Humphrey Visual Field Analyzer (Carl Zeiss Meditec, Inc). Structural damage is traditionally assessed via a fundus exam of the disc that is augmented in many clinics with fundus photographs. Currently, however, many patients around the world are being tested with optical coherence tomography (OCT), which typically includes a scan of the disc. We have called this combination of a disc exam, visual field test with a 6° grid (e.g., a 24-2 test) and an OCT scan of the disc, the common clinical paradigm (CCP) of tests.1 As part of this CCP, the evaluation of OCT and visual field tests are based in large part upon summary metrics [e.g., the pattern standard deviation (PSD) and glaucoma hemifield test (GHT) of the 24-2 visual field and the global or quadrant thickness of the circumpapillary retinal nerve fiber (cpRNFL) of the OCT disc scan]. We have argued elsewhere that recent evidence provides challenges to this CCP of tests.1,2 Here we pose four questions for clinicians diagnosing and monitoring glaucoma patients, and supply evidence to support our answers.
WHEN DO YOU PERFORM A 10-2 VISUAL FIELD TEST?
First, “When do you perform a 10-2 visual field test?” If your answer is, “Only in eyes with advanced damage”, then you are missing and/or underestimating early glaucomatous damage near fixation. Before we provide our answer to this question, let’s review the evidence for early damage near fixation. Roughly speaking this damage can be very local and/or widespread. Because the latter can be relatively subtle, as it involves a loss of only a few dB of sensitivity, its existence has been debated.3–5 However, more recent visual field 6 and OCT 7 studies have clearly documented the existence of widespread sensitivity loss in the macula, although these findings have had relatively little impact on clinical practice. Likewise, while there are examples of local defects near fixation in earlier studies,8–14 these studies have had no impact on clinical practice until recently. For example, Langerhorst et al.14 provided evidence in 1996 that the 6° grid of the 30-2 missed damage detected by a 10-2 test grid; this paper was referenced by only one group between 1996 and 2010, before it was referenced in 2010/11.15,16
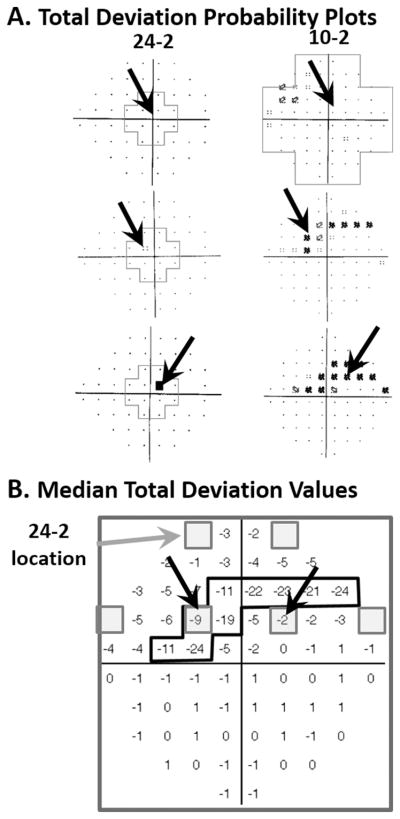
It is now clear that local arcuate damage near fixation can occur very early in the glaucomatous process.2,17 This damage is more common in the inferior macular region/superior visual field. Figure 1A shows three examples from our 2011 paper16 with arcuate defects near fixation. In all three cases, clear damage can be seen on the 10-2 visual field in eyes with 24-2 visual fields that totally miss (top panel in A) and/or underestimate (lower two panels in A) the damage near fixation. Figure 1B provides an explanation. Here the gray squares are the 6 central-most locations of the superior 24-2 pattern; the numbers are the median 10-2 total deviation (TD) values for 10 eyes with arcuate damage in ref 16. Notice that all 10-2 locations with losses worse than −9 dB fall between the 24-2 points (gray squares) and consequently are not detected by the 24-2 pattern. Thus, the extent to which the 24-2 contains abnormal points associated with early, local glaucomatous damage close to fixation will depend upon the location and width of the defect. This is illustrated by the black arrows in Fig. 1B. These arrows point to the two points [(−3°,+3°) and (+3°, +3°)] that are common to both the 10-2 and 24-2 pattern. Abnormal 10-2 visual fields are found in many eyes with 24-2 mean deviation (MD) values better than −6 dB, a common definition of early glaucoma.14–23
Figure 1.
A. 24-2 and 10-2 total deviation (TD) probability plots for three eyes with arcuate damage near fixation as seen on the 10-2 plot, but with only one (second and third panels or no (upper panel) abnormal point on the 24-2 TD plot. The black arrows are points common to both 24-2 and 10-2 test patterns. B. The median TD values for 10 eyes with arcuate defects near fixation. The six gray squares indicate 24-2 test locations in the upper visual field. The points within the black contour have TD values ≤ −9 dB. Modified from ref. 16.
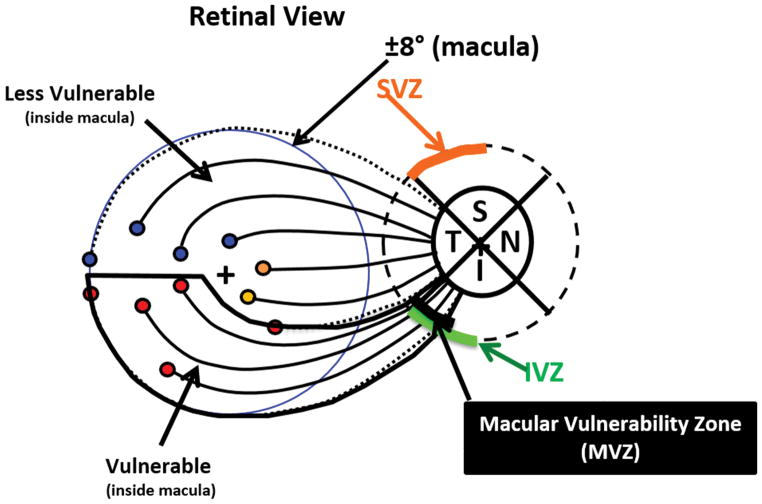
Clinicians are slowly becoming aware of the evidence that the earliest damage due to glaucoma often includes the macula. This increased awareness is in part due to the accumulation of visual field and OCT data documenting this damage and, in part, due to our demonstration of a clear anatomical basis for this damage.2,16,17 Figure 2 illustrates this explanation. The axons from the retinal ganglion cells (RGC) in the inferior region of the macula (red circles) enter the disc in its most vulnerable region, the temporal portion of the inferior quadrant. In general, the temporal half of the superior and inferior quadrants are the locations of the largest loss in circumpapillary retinal nerve fiber layer (cpRNFL); we call these regions the inferior (IVZ) and superior vulnerability zones (SVZ).2 The portion of the IVZ associated with the macula in Fig. 2, what we called the macular vulnerability zone (MVZ), is the region associated with the arcuate defects near fixation seen in Fig. 1.2,16,17
Figure 2.
A schematic model indicating that the axons from the ganglion cells in the superior macula (±8° from the fovea) and maculo-papillary region of the retina (i.e., the upper gray region) enter the temporal quadrant of the disc, while the axons in the rest of the inferior macular region enter in the temporal portion of the inferior quadrant. That is, the latter enter the temporal part of the inferior vulnerability zone (IVZ), that we have called the macular vulnerability zone (MVZ).
Recent OCT evidence supports the model in Fig. 2, and documents that early damage includes the macula.2,17–23 For example, we2 recently analyzed the location of the cpRNFL damage of the 57 eyes with glaucoma, as previously diagnosed by two glaucoma experts.24 Nearly all of these eyes had damage in the IVZ and/or SVZ, even though they all had a 24-2 MD better than −6 dB. Moreover, about 75% of these eyes had damage in the MVZ region of the IVZ. Further, almost 90% of these eyes had damage in the region of the disc associated with the macula, the MVZ and/or the temporal quadrant. These percentages will vary depending upon patient populations. For example, samples with more normal tension glaucoma may have a higher percentage of macular damage. In any case, early macular damage due to glaucoma is very common and the 24-2 test is a poor method for detecting this damage.
Therefore, when should you perform a 10-2 visual field? Arguably, based upon the evidence above, the best answer is anyone for whom you would do, or have done, a 24-2 visual field. This should certainly include anyone with any of the following: 1. an abnormal region on the RGC analysis of an OCT scan of the macula; 2. an abnormal region in the temporal quadrant or MVZ of the cpRNFL analysis of the OCT scan of the disc; 3. one or more of the central four 24-2 points that are abnormal at <5% level on TD or pattern deviation (PD) plots; 4. a visual acuity that cannot be corrected to 20/20; or 5. complaints about glare or trouble reading that cannot be attributed to other causes. Note that we are not advocating performing a 10-2 test instead of a 24-2 test, but rather in addition to. For example, patients could be tested with one at the first visit and the other at the second visit, and then a decision made as to which test to use for following the patient. Another approach to testing the macular region is to modify the 6° grid so as to test for macular and perimacular damage. The G program in the Octopus perimeter (Haag Streit, GmBH) does this.25 Carl Zeiss has developed a 24-2 (called the 24-2C) augmented with additional points from the 10-2 test as suggested by Erlich et al.26 However, when we last checked Carl Zeiss planned to make it available only on their new HFA3 machine.
Finally, clinicians should perform 10-2 exams or their equivalent even in eyes in which the 24-2 indicates a central abnormality. The finer 2-degree grid is invaluable to more accurately define the extent of damage and to track changes over time, and it is essential for comparisons to OCT abnormalities as discussed below as part of question 3.
WHEN DO YOU PERFORM AN OCT SCAN OF THE MACULA?
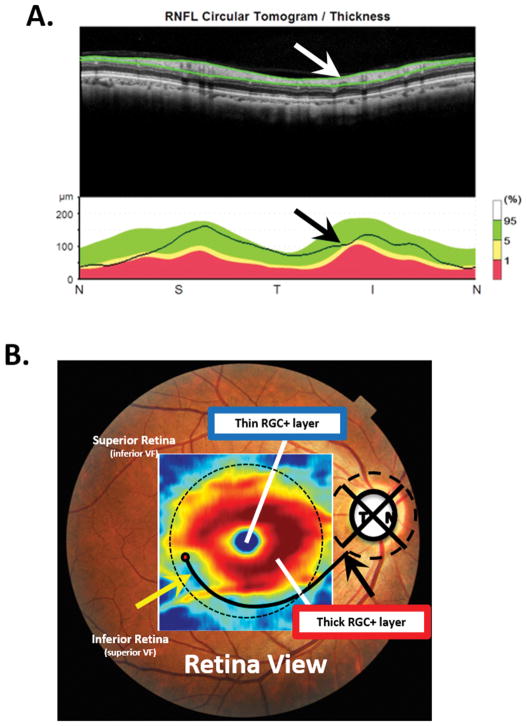
Our answer to the second question, “When do you perform an OCT scan of the macula"?” is: Everyone should have a scan that includes the macula - or, at least everyone tested with OCT. However, while it is common clinical practice to obtain an OCT scan of the disc, many clinicians do not obtain a scan of the macular region for patients with glaucoma or suspected glaucoma. This is a mistake since the OCT disc scan, as typically performed, can miss damage seen on a cube scan of the macula.27 Figure 3 illustrates this point. Panel A shows a cpRNFL report for a circle scan, while panel B displays the RGC+ (RGC plus inner plexiform layer) thickness map from a macular scan of the same eye. The thinner region (yellow arrow) of the RGC+ thickness map in panel B is obvious, while the cpRNFL plot in panel A appears normal. The abnormal region of macular RGCs is often easier to see on a RGC+ probability map as in Fig. 4A, which will be discussed below.
Figure 3.
A. Upper panel: The image from a circle scan of the disc displayed with the temporal quadrant in the center (NSTIN plot). Lower panel: The circumpapillary retinal nerve fiber layer (cpRNFL) thickness plot (black line) for the scan image in the upper panel. B. A fundus photo with the retinal ganglion cell plus inner plexiform (RGC+) thickness map superimposed. The yellow arrow points to a region with a thinned RGC+ layer. The black and white arrows in panels A and B indicate the MVZ and are in the same locations in both panels.
Figure 4.
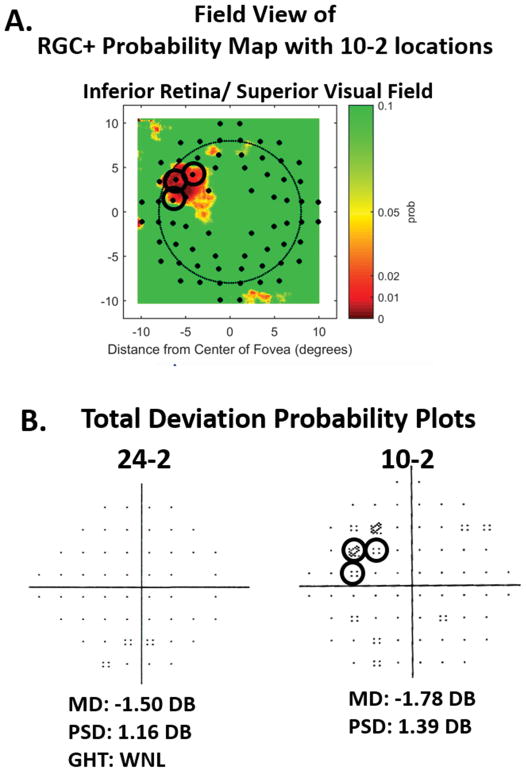
A. The RGC+ probability map associated with the RGC+ thickness map in Fig. 3B. The color-coding is a continuous scale of probability, where dark red, red, yellow and green represent 0.1%, 1%, 5%, and ≥10% levels of significance. The small filled black dots are the regions corresponding to the 10-2 test locations.16 B. The total deviation (TD) probability plots from 24-2 and 10-2 visual field tests for this same eye. The black circles in both panels indicate the abnormal 10-2 points that fall within abnormal regions on the RGC+ probability plot in panel A.
It is also important to obtain macular scans to avoid missing non-glaucomatous macular damage, which may contribute to the patient’s complaints and/or visual field abnormalities. Some of the most common conditions missed are epiretinal membranes, macular edema or holes, and age-related macular degeneration. Macular scans are not only important from the perspective of delivering the best eye care, but they are essential for confirming 10-2 visual field damage in patients with glaucoma or suspected glaucoma, which will be discussed next. Moreover, the speed of acquisition of disc and macular scans is so fast today that there is no excuse for not performing both disc and macular scans. In any case, some manufacturers now have scan protocols that include both the macula and disc.
HOW DO YOU KNOW IF THE VISUAL FIELD AND OCT TESTS AGREE?
Given you have both a visual field and an OCT scans of the macula and disc, as we suggest, the third question is: “How do you know if the visual field and OCT tests agree?” Some clinicians use OCT summary metrics, such as cpRNFL global or quadrant thickness or RGC macular thickness, and visual field summary metrics such as abnormal GHT and PSD. However, summary metrics often miss glaucomatous damage.2,28 The best answer to the question is: topographically compare abnormal regions on the OCT to abnormal regions on the visual field.2,17,29,30
Figure 4 illustrates this approach. Panel A is the RGC+ probability map associated with the RGC+ thickness map in Fig. 3B. Most OCT instruments provide a similar map, which is obtained by comparing the patient’s RGC+ thickness to a normative database. The color coding is a continuous scale of probability of significance from 0.1% (dark red) to ≥10% (green). To make comparisons to 10-2 visual fields easier, the map in Fig. 4A is shown in field view (inferior retina on top), and the small black circles are the regions corresponding to the 10-2 test locations, corrected for RGC displacement.16
In an analysis presented at the 2018 meeting of the Association for Research in Vision and Ophthalmology (ARVO), we found that the OCT and visual field showed agreement, with excellent sensitivity and specificity, if 3 or more 10-2 or 24-2 TD points at ≤5%, or 2 TD points at 1%, fell within regions of abnormality (red, ≤1%) on RGC+ and/or RNFL probability maps. In Fig. 4, the abnormal 10-2 points falling within the red, ≤1% region on the RGC+ map are circled in both panels. Note that the 3 significant points on the 10-2 visual field fall within the regions (red) significant at ≤1% on the OCT probability map. Using the data from a previous study,24 we compared this topographical method of agreement to methods based upon the best combination of OCT and visual field summary metrics. There were 101 eyes in the study, 57 of which had early glaucoma and 44 who were suspects due to their optic disc appearance, but were deemed healthy, based upon all available clinical information.24 The topographical method made 4 mistakes (combination of false positives and false negatives), while the best combination of summary metrics made 15 mistakes. Note that in Fig. 4B, the 24-2 and 10-2 summary metrics (MD, PSD, and GHT) are all within normal limits, illustrating how summary metrics can fail to capture glaucomatous damage.
We are aware that this finding contradicts the generally held belief that structural damage precedes functional damage. In fact, this generalization, which is often quoted in papers and talks, is misleading as discussed in refs 31 and 32. The extent to which structural and functional measures agree depends upon a number of factors including: the structural and functional tests used; the measures used to define an abnormal test; and the relative levels of the baseline values when the eye was healthy. For best agreement between structure and function, a 10-2 test, as well as a 24-2 test, is needed; TD, as well as PD, plots must be analyzed; and typical summary metrics, such as PSD and the average thickness of the OCT cpRNFL should be ignored. If these rules are followed, then, in most eyes, structural (meaning RGC+ and RNFL probability maps) and functional (meaning TD and PD probability maps from reliable or repeatable 24-2 AND 10-2 visual fields) tests will agree when the abnormal locations are topographically compared. In a relatively few eyes, damage can appear first on OCT probability maps (so-called pre-perimetric damage) and occasionally even first on visual field probability maps.
WHEN DO YOU LOOK AT OCT IMAGES?
Finally, unlike many retina experts, glaucoma experts often do not look at the actual images. So, our last question is, “When do you look at OCT images?” If the reader’s answer is, “I don’t”; that is a mistake. A circumpapillary image should at least be quickly examined in all eyes on which OCT imaging is performed. The circumpapillary image can come from a high-resolution circle scan or an image derived from a cube scan. Some OCT instruments include this image as part of one of their glaucoma reports. However, the OCT glaucoma reports often have images that are too small to be of use or, in some cases, do not show an OCT image at all. In any case, one can find an image of the cpRNFL on all OCT instruments, although it may take some searching.
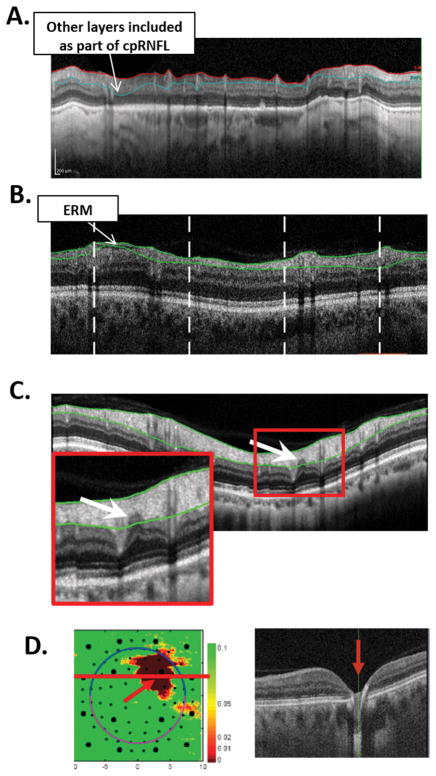
There are three reasons to look carefully at the circumpapillary image. First, you can assess the quality of the scan and the accuracy of the segmentation lines marking the boundaries of the RNFL. All segmentation algorithms make mistakes. Figure 5A,B shows two examples. In panel A, poor scan contrast caused a segmentation error, and the RGC+ layer was included as part of the cpRNFL. In panel B, an epiretinal membrane causes the algorithm to underestimate the cpRNFL thickness. Second, you can often see the location and nature of the damage in greater detail. Figure 5C shows an enlarged image of the cpRNFL scan in Fig. 3A. As indicated by the arrow, there is a local defect that was missed by the segmentation algorithm.
Figure 5.
A. A circumpapillary optical coherence tomography (OCT) image illustrating a retinal nerve fiber layer (RNFL) segmentation error due to poor scan contrast. B. A circumpapillary OCT image illustrating a RNFL segmentation error due to an epiretinal membrane. C. A circumpapillary OCT image showing a local defect in the RNFL (arrow). D. Left panel: A RGC+ probability map with a local defect (red arrow). Right panel: a portion of a horizontal b-scan through the abnormal region demonstrating that a local retinal defect, not glaucoma, was the cause.
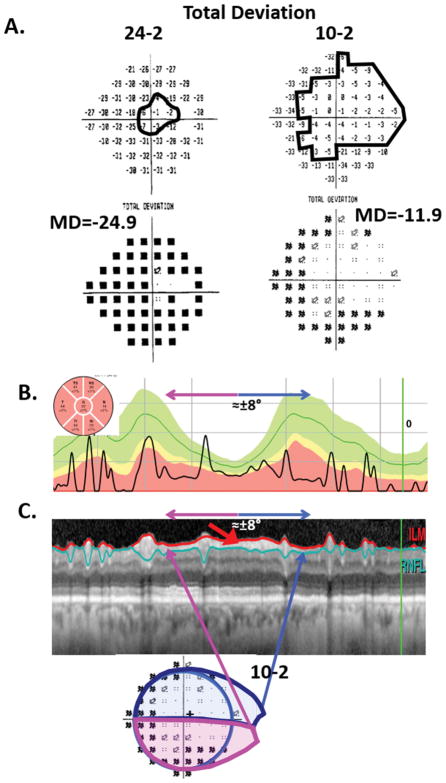
Third, you can assess and follow damage in eyes with severe damage. Yet another myth about the OCT is that it cannot be used for advanced glaucoma. Across individuals, the global average cpRNFL thickness becomes asymptotic for 24-2 MD worse than about −15 dB31,33 Thus, the global cpRNFL thickness may not be useful in advanced cases. However, we suggest that there will be a detectable preserved cpRNFL region in any eye in which the 24-2 or 10-2 TD plots have one or more points with a TD value equal to or better than −8 dB, even if these eyes have MD values worse than −15 dB. Figure 6 supplies an example of an eye with a 24-2 MD of −24.9 dB (panel A, left) and a global average cpRNFL of only 32um (panel B). Both the 24-2 and 10-2 TD plots show regions equal to or better than −8 dB (within black contours). Panel C illustrates the agreement between the preserved regions on the 10-2 and the remaining cpRNFL seen on a circle scan of the disc. (The figure caption contains more details.) Further, progressive changes can be better detected by following a region of interest (ROI) than by using summary metrics from OCT printouts, such as average global cpRNFL thickness.2,34,35
Figure 6.
Visual fields and OCT cpRNFL for an eye with advanced glaucoma. A. The 24-2 (left) and 10-2 (right) TD (upper panels) and probability (lower panels) plots. B. The cpRNFL thickness plot shown as a NSTIN plot (i.e., with the temporal quadrant in the middle). C. Upper panel: The circumpapillary image with the segmentation lines for the RNFL shown. The red arrow points to regions of preserved cpRFNL. The lower panel is the 10-2 probability map from panel A (lower right). The magenta and blue lines indicate the regions of cpRNFL and 10-2 that correspond with each other.
Finally, in addition to circumpapillary scans, it is important to examine macular scans, so as to avoid missing non-glaucomatous macular damage due to retinal conditions. The best way to identify these retinal conditions is to examine a horizontal b-scan image. While some clinicians may prefer to obtain a high resolution averaged line scan, typically the b-scan from the macular cube scan that passes through the fovea will serve the purpose. The cube scan also has the advantage of allowing the clinician to differentiate between RGC+ abnormalities due to glaucomatous damage versus due to retinal problems. Figure 5D illustrates this point. Here the red region on the RGC+ probability map (left panel) was initially thought to be due to glaucoma. However, an examination of the b-scan through the abnormal regions (right panel) confirmed it was due to a local retinal defect (red arrow).
A COMPARISON TO AN INTERPRETATION OF MRI SCANS OF THE BRAIN
Most clinical testing currently being performed to diagnose glaucoma inadequately answers one or more of these four questions. For example, what we have called the common clinical paradigm (CCP) of tests,1 includes of a 24-2 visual field; an OCT disc scan; and a comparison of 24-2 and OCT tests based on summary metrics. The combination of the 24-2 visual field and OCT disc scan does not adequately address any of our four questions. To put this in perspective, consider the following comparison to how radiologists and neurologists would interpret magnetic resonance imaging (MRI) of the brain.
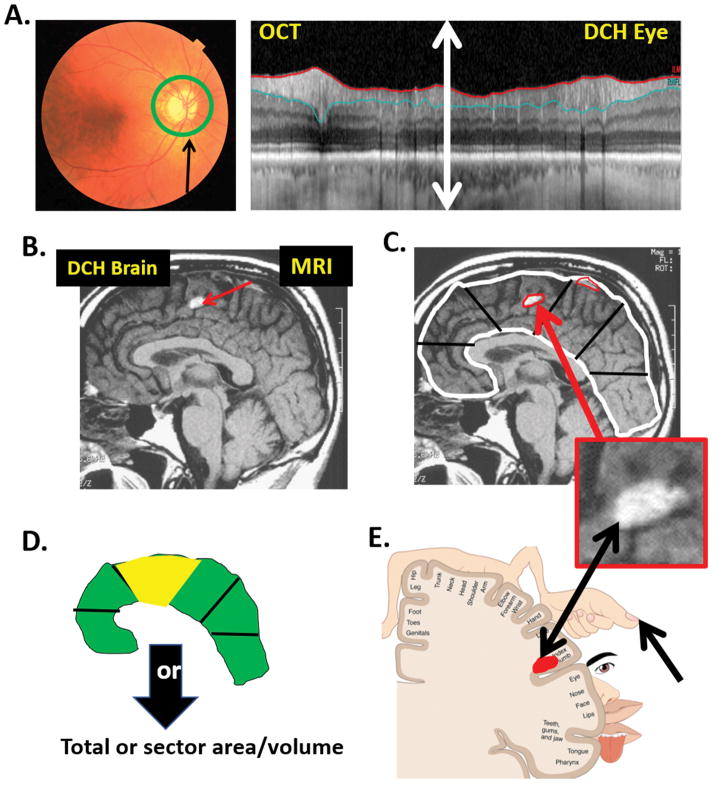
Figure 7 shows an OCT circle scan (panel A, right), around author DCH’s disc (panel A, left), as well as a midsagittal MRI scan of his brain (panel B). The current OCT scans, in general, have 100 times the spatial resolution of MRI scans. In fact, the entire extent of the retinal region (double headed white arrow in panel A, right) would fall within a single pixel on the MRI image in B, and all details would be lost. Thus, the circle scan in panel A (right) has far better resolution than the MRI scan.
Figure 7.
A. Left panel: A fundus photo of author DCH’s right eye showing the location of the OCT circumpapillary scan. Right panel: DCH’s circumpapillary scan. B. A midsagittal magnetic resonance imaging (MRI) scan of DCH’s brain. C. White and red contours are hypothetical segmentation lines. The lower inset is an enlarged image of the area with the white abnormal region. D. A hypothetical probability map of the segmented regions in panel C. E. The somatosensory homunculus illustrating the topographical association of structure and function. See text for details.
Now suppose DCH had glaucoma and his OCT scan looked like the one in Fig. 6C, instead of like the one in Fig. 7A (right). How would many, if not most, clinicians interpret this scan? First, they would depend on cpRNFL analysis. In particular, all OCT instruments use a computer algorithm to segment (delineate) the borders of the retinal nerve fiber layer, as shown by the blue and red lines in Fig. 6C. Based upon this algorithm, the cpRNFL thickness, which is the distance between the blue and red lines, is determined, and plotted as the black curve in Fig. 6B. While this plot is typically shown from temporal (T) to superior (S) to nasal (N) to temporal (T), thus the name TSNIT plot, we show it here as an NSTIN plot so that the ±8° macular region is in the center of the plot, which makes it easier to compare to visual field abnormalities, as can be seen in Fig. 6C.2,30 Second, when assessing glaucomatous damage, many clinicians focus on pie charts showing the average cpRNFL thickness of 4 to 12 regions. The inset in the upper left corner of Fig. 6B shows the average cpRNFL thickness of 6 regions. These pie charts are color coded so that red, yellow and green correspond to 1%, 5%, and 95% confidence limits. Moreover, many specialists depend upon a single number, the average overall cpRNFL, which is the center value in the pie chart in Fig. 6B. Finally, to decide if the damage to this eye is progressing, many specialists would use these global or regional thickness values and/or the significance (color) of the sectors of the pie chart.
Now consider how a radiologist might approach a local tumor in the brain. In Fig. 7C, notice the white region (red arrow) in DCH’s MRI scan. This is a benign patch of fat in the fornix. However, assume for the sake of this example that it is a tumor pressing against the posterior central gyrus. How would the radiologist approach this? Would they use something similar to the OCT pie chart analysis in Fig. 6B, often referred to by glaucoma specialists? That is, would they use a computer algorithm to delineate (segment) the outer limits of the brain (white contour in Fig. 7C), as well as the hyper-intense regions on the MRI scan that might be abnormal (red contours in Fig. 7C)? And then, would they divide the brain into sections (black lines in Fig. 7C) and compare the area or volume in those segments to normal controls? Would they subsequently color code the sections depending upon statistical significance of being abnormal, to produce a summary such as in Fig. 7D, that is analogous to the pie chart in Fig. 6B? And, would they then take the average of the whole brain to get a single number, as is often done in glaucoma? - - Of course not. Instead they would look closely at the tumor, as in Fig. 7C (lower inset), and decide if it were real or an artifact.
Further, to assess whether this tumor is growing, a radiologist would probably follow the edges of the tumor over time to see if they were expanding. We should be doing something similar in the case of glaucoma, when we look for changes suggestive of progression. In fact, we can still make use of the segmentation algorithms to define a ROI, but we should follow this region both quantitatively and qualitatively.34.35 This ROI can be a small abnormal region in cases of early glaucoma and small regions of preserved cpRNFL in the case of advanced glaucoma (Fig. 6C).
Returning to the MRI example, suppose the neurologists and/or neurosurgeons treating this patient wanted to compare this structural abnormality to behavioral changes. They would notice that the tumor was pressing on the posterior central gyrus, which is the somatosensory region of the brain in the region associated with the thumb. To see if functional changes correlated with the structural change, they would ask if the abnormal region on the MRI corresponded to the abnormal region of loss of sensitivity (e.g., thumb). If they used software, it would show the abnormal region in red, as in Fig. 7E; that location could then be compared using a map (the somatosensory homunculus) to see if the behavioral change corresponded. This is analogous to what we are suggesting should be done with glaucoma when comparing structural and functional loss, as illustrated in Figs. 4C and 6C. Instead, in the case of glaucoma, clinicians often ask if the MD or PSD of the 24-2 is abnormal. Turning to our MRI analogy again, it is as if the neurologist took the average sensitivity of a large part of the body and used a summary metric to see if it was abnormal, which is not what should happen.
SUMMARY
In summary, we recommend that all patients with glaucoma, or suspected glaucoma, should undergo visual field testing that includes more points in the macula, such as the 10-2 pattern, the G-program, or a 24-2 hybrid, as well as OCT testing that includes scans of the macula. The actual OCT b-scan images should be evaluated in detail before looking at any other post-processing analyses provided in the OCT reports. Further, because the likelihood of glaucoma increases when structure and function agree, the clinician should assess the topographical agreement between the abnormal regions of the OCT (disc AND macula) and visual field probability maps (24-2 AND 10-2); they should not rely on conventional summary metrics such as PSD or global cpRNFL thickness. In closing, it should be noted that we are not arguing that the clinician should forgo the fundus exam, although the value of fundus photographs could be debated. Finally, while we have tested our approach against the tests included in the CCP,36 we encourage others to do the same. For more details see lectures available at http://hoodvisualscience.psych.columbia.edu/.
Acknowledgments
Supported by: NIH/ NEI grant: EY002115 (DCH) and EY025253 (CGDM)
Footnotes
Financial disclosures: DCH receives lecture fees, research support and equipment from Topcon, Inc. and Heidelberg Engineering. CGDM has no financial disclosures relevant to content.
References
- 1.Hood DC, De Moraes CG. Challenges to the common clinical paradigm for diagnosis of glaucomatous damage with OCT and visual fields. Invest Ophthalmol Vis Sci. 2018;1(59):788–791. doi: 10.1167/iovs.17-23713. [DOI] [PMC free article] [PubMed] [Google Scholar]
- 2.Hood DC. Improving our understanding, and detection, of glaucomatous damage: An approach based upon optical coherence tomography (OCT) Prog Retin Eye Res. 2017;57:46–75. doi: 10.1016/j.preteyeres.2016.12.002. [DOI] [PMC free article] [PubMed] [Google Scholar]
- 3.Heijl A. Lack of diffuse loss of differential light sensitivity in early glaucoma. Acta Ophthalmol. 1989;67:353–360. doi: 10.1111/j.1755-3768.1989.tb01614.x. [DOI] [PubMed] [Google Scholar]
- 4.Asman P, Heijl A. Diffuse visual field loss and glaucoma. Acta Ophthalmol. 1994;72:303–308. doi: 10.1111/j.1755-3768.1994.tb02763.x. [DOI] [PubMed] [Google Scholar]
- 5.Drance SM. Diffuse visual field loss in open-angle glaucoma. Ophthalmol. 1991;98:1533–1538. doi: 10.1016/s0161-6420(91)32092-x. [DOI] [PubMed] [Google Scholar]
- 6.Artes PH, Chauhan BC, Keltner JL, et al. Ocular Hypertension Treatment Study Group. Longitudinal and cross-sectional analyses of visual field progression in participants of the Ocular Hypertension Treatment Study. Arch Ophthalmol. 2010;128:1528–1532. doi: 10.1001/archophthalmol.2010.292. [DOI] [PMC free article] [PubMed] [Google Scholar]
- 7.Hood DC, Slobodnick A, Raza AS, De Moraes CG, Teng CC, Ritch R. Early glaucoma involves both deep local, and shallow widespread, retinal nerve fiber damage of the macular region. Invest Ophthalmol Vis Sci. 2014;55:632–648. doi: 10.1167/iovs.13-13130. [DOI] [PMC free article] [PubMed] [Google Scholar]
- 8.Aulhorn E, Harms M. Early visual field defects in glaucoma. In: Leydhecker W, editor. Glaucoma, Tutzing Symposium. Basel: Karger; 1967. pp. 151–156. [Google Scholar]
- 9.Drance SM. The early field defects in glaucoma. Invest Ophthalmol. 1969;8:84–91. [PubMed] [Google Scholar]
- 10.Aulhorn E, Karmeyer H. Frequency distribution in early glaucomatous visual field defects. Doc Ophthalmol Proc Ser. 1977;14:75–83. [Google Scholar]
- 11.Nicholas SP, Werner EB. Location of early glaucomatous visual field defects. Can J Ophthalmol. 1980;15:131–133. [PubMed] [Google Scholar]
- 12.Anctil JL, Anderson DR. Early foveal involvement and generalized depression of the visual field in glaucoma. Arch Ophthalmol. 1984;102:363–370. doi: 10.1001/archopht.1984.01040030281019. [DOI] [PubMed] [Google Scholar]
- 13.Heijl A, Lundqvist L. The frequency distribution of earliest glaucomatous visual field defects documented by automatic perimetry. Acta Ophthalmol (Copenh) 1984;62:658–664. doi: 10.1111/j.1755-3768.1984.tb03979.x. [DOI] [PubMed] [Google Scholar]
- 14.Langerhorst CT, Carenini LL, Bakker D, De Bie-Raakman MAC. Measurements for description of very early glaucomatous field defects. In: Wall M, Heijl A, editors. Perimetry Update 1996/1997. New York: Kugler Publications; 1997. pp. 67–73. [Google Scholar]
- 15.Schiefer U, Papageorgiou E, Sample PA, et al. Spatial pattern of glaucomatous visual field loss obtained with regionally condensed stimulus arrangements. Invest Ophthalmol Vis Sci. 2010;51:5685–5689. doi: 10.1167/iovs.09-5067. [DOI] [PMC free article] [PubMed] [Google Scholar]
- 16.Hood DC, Raza AS, de Moraes CG, et al. Initial arcuate defects within the central 10 degrees in glaucoma. Invest Ophthalmol Vis Sci. 2011;52:940–946. doi: 10.1167/iovs.10-5803. [DOI] [PMC free article] [PubMed] [Google Scholar]
- 17.Hood DC, Raza AS, de Moraes CG, Liebmann JM, Ritch R. Glaucomatous damage of the macula. Prog Retin Eye Res. 2013;32:1–21. doi: 10.1016/j.preteyeres.2012.08.003. [DOI] [PMC free article] [PubMed] [Google Scholar]
- 18.Traynis I, de Moraes CG, Raza AS, Liebmann JM, Ritch R, Hood DC. The prevalence and nature of early glaucomatous defects in the central 108 of the visual field. JAMA Ophthalmol. 2014;132:291–7. doi: 10.1001/jamaophthalmol.2013.7656. [DOI] [PMC free article] [PubMed] [Google Scholar]
- 19.Park HY, Hwang BE, Shin HY, Park CK. Clinical cues to predict the presence of parafoveal scotoma on Humphrey 10-2 visual field using a Humphrey Visual Field. Am J Ophthalmol. 2016;161:150–59. doi: 10.1016/j.ajo.2015.10.007. [DOI] [PubMed] [Google Scholar]
- 20.Sullivan-Mee M, Karin Tran MT, Pensyl D, et al. Prevalence, features, and severity of glaucomatous visual field loss measured with the 10-2 achromatic threshold visual field test. Am J Ophthalmol. 2016;168:40–51. doi: 10.1016/j.ajo.2016.05.003. [DOI] [PubMed] [Google Scholar]
- 21.Jung KI, Park CK. Detection of functional change in preperimetric and perimetric glaucoma using 10-2 matrix perimetry. Am J Ophthalmol. 2017;182:35–44. doi: 10.1016/j.ajo.2017.07.007. [DOI] [PubMed] [Google Scholar]
- 22.De Moraes CG, Hood DC, Thenappan A, et al. 24-2 visual fields miss central defects shown on 10-2 tests in glaucoma suspects, ocular hypertensives, and early glaucoma. Ophthalmology. 2017;124:1449–56. doi: 10.1016/j.ophtha.2017.04.021. [DOI] [PMC free article] [PubMed] [Google Scholar]
- 23.Zhang C, Tatham AJ, Abe RY, Hammel N, Belghith A, Weinreb RN, Medeiros FA, Liebmann JM, Girkin CA, Zangwill LM. Macular ganglion cell inner plexiform layer thickness in glaucomatous eyes with localized retinal nerve fiber layer defects. PLoS One. 2016;11:e0160549. doi: 10.1371/journal.pone.0160549. [DOI] [PMC free article] [PubMed] [Google Scholar]
- 24.Hood DC, De Cuir N, Blumberg DM, Liebmann JM, Jarukasetphon R, Ritch R, De Moraes CG. A single wide-field OCT protocol can provide compelling information for the diagnosis of early glaucoma. Trans Vis Sci Tech. 2016;5:4. doi: 10.1167/tvst.5.6.4. [DOI] [PMC free article] [PubMed] [Google Scholar]
- 25.Roberti G, Manni G, Riva I, Holló G, Quaranta L, Agnifili L, Figus M, Giammaria S, Rastelli D, Oddone F. Detection of central visual field defects in early glaucomatous eyes: Comparison of Humphrey and Octopus perimetry. PLoS One. 2017;12:e0186793. doi: 10.1371/journal.pone.0186793. [DOI] [PMC free article] [PubMed] [Google Scholar]
- 26.Ehrlich AC, Raza AS, Ritch R, Hood DC. Modifying the conventional visual field test pattern to improve the detection of early glaucomatous defects in the central 10°. Trans Vis Sci Tech. 2014;3:6. doi: 10.1167/tvst.3.6.6. eCollection. [DOI] [PMC free article] [PubMed] [Google Scholar]
- 27.Wang DL, Raza AS, de Moraes CG, Chen M, Alhadeff P, Jarukatsetphorn R, Ritch R, Hood DC. Central glaucomatous damage of the macula can be overlooked by conventional OCT retinal nerve fiber layer thickness analyses. Trans Vis Sci Tech. 2015;4:4. doi: 10.1167/tvst.4.6.4. eCollection. [DOI] [PMC free article] [PubMed] [Google Scholar]
- 28.Muhammad H, Fuchs TJ, De Cuir N, De Moraes CG, Blumberg DM, Liebmann JM, Ritch R, Hood DC. Hybrid deep learning on single wide-field optical coherence tomography scans accurately classifies glaucoma suspects. J Glau. 2017;26:1086–94. doi: 10.1097/IJG.0000000000000765. [DOI] [PMC free article] [PubMed] [Google Scholar]
- 29.Hood DC, Raza AS. Method for comparing visual field defects to local RNFL and RGC damage seen on frequency domain OCT in patients with glaucoma. Biomed Opt Exp. 2011;2:1097–1105. doi: 10.1364/BOE.2.001097. [DOI] [PMC free article] [PubMed] [Google Scholar]
- 30.Hood DC, Raza AS. On improving the use of OCT imaging for detecting glaucomatous damage. Br J Ophthalmol. 2014;98(Suppl 2):ii1–9. doi: 10.1136/bjophthalmol-2014-305156. [DOI] [PMC free article] [PubMed] [Google Scholar]
- 31.Hood DC, Kardon RH. A framework for comparing structural and functional measures of glaucomatous damage. Prog Ret Eye Res. 2007;26:688–710. doi: 10.1016/j.preteyeres.2007.08.001. [DOI] [PMC free article] [PubMed] [Google Scholar]
- 32.Malik R, Swanson WH, Garway-Heath DH. The ‘structure-function’ relationship in glaucoma: past thinking and current concepts. Clin Experiment Ophthalmol. 2012;40:369–80. doi: 10.1111/j.1442-9071.2012.02770.x. [DOI] [PMC free article] [PubMed] [Google Scholar]
- 33.Medeiros FA, Lisboa R, Weinreb RN, Girkin, et al. A combined index of structure and function for staging glaucomatous damage. Arch Ophthalmol. 2012;130(5):E1–10. [PubMed] [Google Scholar]
- 34.Hood DC, Xin D, Wang D, et al. A region-of-interest approach for detecting progression of glaucomatous damage with optical coherence tomography. JAMA Ophthalmol. 2015:1–7. doi: 10.1001/jamaophthalmol.2015.3871. [DOI] [PMC free article] [PubMed] [Google Scholar]
- 35.Wu Z, Weng DSD, Thenappan A, Ritch R, Hood DC. Evaluation of a region-of-interest approach for detecting progressive glaucomatous macular damage on optical coherence tomography. Transl Vis Sci Technol. 2018;7:14. doi: 10.1167/tvst.7.2.14. eCollection 2018. [DOI] [PMC free article] [PubMed] [Google Scholar]
- 36.Hood DC, Raza AS, De Moraes CG, Alhadeff PA, Idiga J, Blumberg DM, Liebmann JM, Ritch R. Evaluation of a one-page report to aid in detecting glaucomatous damage. Transl Vis Sci Technol. 2014;3(6):8. doi: 10.1167/tvst.3.6.8. eCollection 2014. [DOI] [PMC free article] [PubMed] [Google Scholar]


