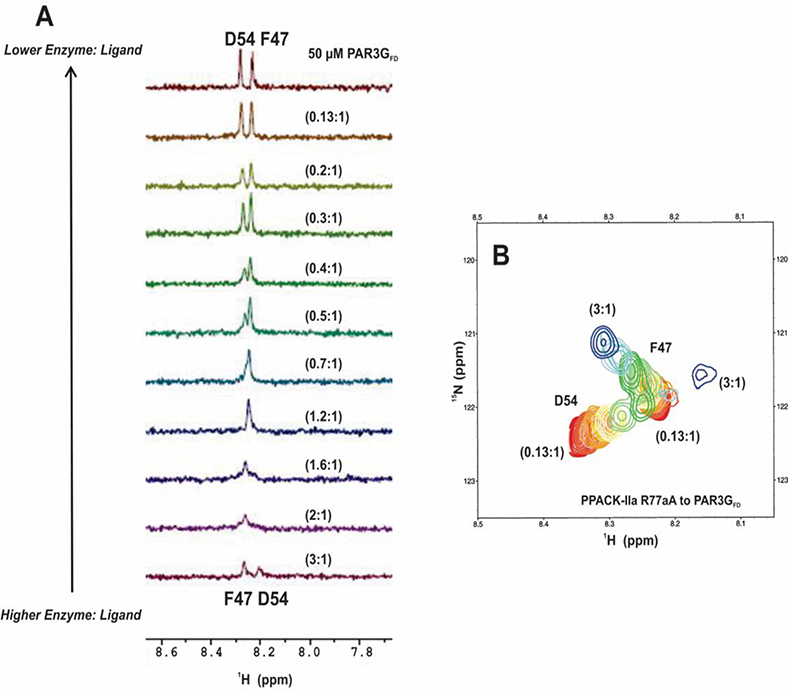
Figure 7:

1D and 2D 1H-15N HSQC NMR titrations of PAR3GFD (44–56) in the presence of PPACK-R77aA. All NMR samples were in 25mM H3PO4, 150 mM NaCl, 0.2 mM EDTA and 10 % D2O (pH 6.5). (A) For the 1D HSQC NMR titrations, the starting complexes included 50 μΜ PAR3GFD (44– 56, 15N-F47, 15N-D54) in 150 μM PPACK-R77aA. The serial dilutions resulted in PPACK-R77aA to PAR3GFD ratios tliat spanned from 3:1 to 0.1:1. Note that at the start of titration (3:1 protein to peptide) the amide proton for PAR3G F47 was at 8.3 ppm and for PAR3G D54 at 8.2 ppm. By a ratio of (0.7 to 1), the two peaks overlapped into a single peak. As the PPACK-R77aA thrombin was further diluted, the F47 and D54 peaks contained to change resonance positions and eventually matched those of the free PAR3GFD peptide. Representative data sets are shown. (B) For the 2D 1H-15N HSQC titrations, starting complexes included 50 μM PAR3GFD (44–56,15N-F47,15N-D54) in 150 μΜ PPACK-R77aA. The serial dilutions resulted in PPACK-thrombin to PAR3GFD ratios that spanned from 3:1 to 0.1:1. Representative data sets are shown. Colors for the 2D ‘Η-^Ν HSQC crosspeaks span from blue (highest protein-peptide ratio) to red (free peptide).
