

Abstract
ARID1A (the AT-rich interaction domain 1A, also known as BAF250a) is one of the most commonly mutated genes in cancer1,2. The majority of ARID1A mutations are inactivating mutations and lead to loss of ARID1A expression3, which makes ARID1A a poor therapeutic target. Therefore, it is of clinical importance to identify molecular consequences of ARID1A deficiency that create therapeutic vulnerabilities in ARIDIA-mutant tumors. In a proteomic screen, we found that ARID1A interacts with mismatch repair (MMR) protein MSH2. ARID1A recruited MSH2 to chromatin during DNA replication and promoted MMR. Conversely, ARID1A inactivation compromised MMR and increased mutagenesis. ARID1A deficiency correlated with microsatellite instability genomic signature and a predominant C>T mutation pattern and increased mutation load across multiple human cancer types. Tumors formed by an ARID1A-deficient ovarian cancer cell line in syngeneic mice displayed increased mutation load, elevated numbers of tumor-infiltrating lymphocytes, and PD-L1 expression. Notably, treatment with anti-PD-L1 antibody reduced tumor burden and prolonged survival of mice bearing ARIDIA-deficient but not ARID1A-wild-type ovarian tumors. Together, these results suggest ARID1A deficiency contributes to impaired MMR and mutator phenotype in cancer, and may cooperate with immune checkpoint blockade therapy.
ARID1A is a subunit of the chromatin remodeling complex SWI/SNF, which facilitates access of proteins to DNA4,5. In The Cancer Genome Atlas (TCGA) datasets, ARID1A was substantially mutated in 26 of the 32 cancer types, with a high mutation rate in uterine corpus endometrial carcinoma, stomach adenocarcinoma, and urothelial bladder carcinoma (15–44%; Fig. 1a and Supplementary Table 1). We conducted a proteomic analysis and identified a key MMR protein, MSH2, as a binding partner of ARID1A (Fig. 1b,c and Supplementary Table 2). Notably, DNA damage response and repair pathways were among the top pathways with proteins interacting with ARID1A (Fig. 1d and Supplementary Table 3). ARID1A–MSH2 interaction was further confirmed by ectopic, endogenous, and reciprocal immunoprecipitation assays (Fig. 1e,f). MSH2 and ARID1A deletion constructs showed that the N-terminal half of MSH2 was sufficient to mediate its interaction with ARID1A (Fig. 1g) and regions from 1,600–1,800 amino acids (aa) at the C-terminal half of ARID1A were essential for its interaction with MSH2 (Fig. 1h and Supplementary Fig. 1a). Deletions in ARID1A (2,004–2,021 aa; 2,100–2,200 aa; and 2,117–2,127 aa) or frameshift and/or early-stop codon mutations (5715delA, 5548delG, and R1989*) caused loss of protein expression (Supplementary Fig. 1b). ARID1A-MSH2 interaction did not appear to be mediated through DNA, since ethidium bromide (EtBr) did not affect the interaction (Supplementary Fig. 1c). In two cancer patient-derived ARID1A mutations with normal ARID 1A expression, A5337G However, two other mutants (deletion to MSH2 (Fig. 1h). However, two other mutants (deletion 1,700–1,800 aa and A5337G) contained comparable binding capacity to BRG1 (also called SMARCA4; Supplementary Fig. 1d). Together, our data showed an interaction between ARID1A and MSH2, likely mediated through the N-terminal region of MSH2 and the C-terminal region of ARID1A (1,600–1,800 aa).
Fig. 1 |. ARID1A interacts with MSH2.
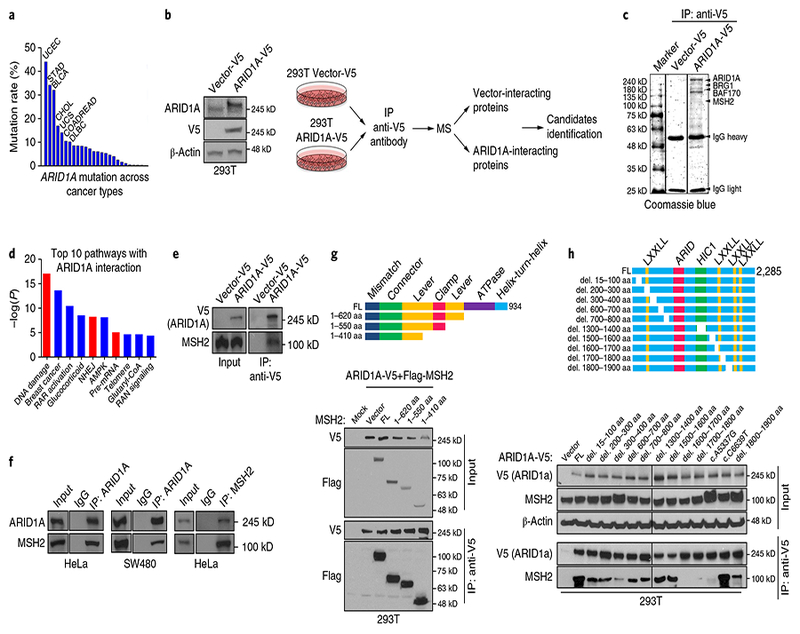
a, ARID1A mutation rate across cancer types in TCGA. Cancer types with mutation rate > 10% are shown; details in Supplementary Table 1. BLCA, urothelial bladder carcinoma; CHOL, cholangiocarcinoma; COADREAD, colon and rectal adnocarcinoma; DLBC, diffuse large B-cell lymphoma; STAD, stomach adenocarcinoma; UCS, uterine carcinonoma. b, Schematic of identification of ARID1A-interacting proteins using mass spectrometry in Vector-V5 and ARID1A-V5 expressing HEK 293 T cells. c, Coomassie blue staining of precipitates from anti-V5 immunoprecipitation (IP) in 293 T cells expressing empty vector or ARID1A-V5. Details in Supplementary Table 2. d, Ingenuity pathway analysis of AIRD1A-interacting proteins combining three immunoprecipitation/mass spectrometry results; details in Supplementary Table 3. RAR, retinoic acid receptor. e, Western blots of anti-V5 IP in vector-V5-expressing and ARID1A-V5-expressing 293 T cells. f, Western blots of endogenous IP and reciprocal IP with anti-ARID1A or anti-MSH2 antibodies in HeLa and SW480 cells. g, Top: schematic of MSH2 deletions. Bottom: IP of ARID1A with Flag-MSH2 containing indicated deletions in HEK 293 T cells. FL, full-length protein. h, Top: schematic of ARID1A deletions. Bottom: IP of ARID1A deletions (del.) with MSH2 in HEK 293 T cells. Experiments in b, c, and e–h were repeated three times each. Uncropped blots are shown in Supplementary Fig. 12.
To determine whether ARID 1A deficiency impairs MMR, we used a quantitative MMR reporter assay6. The assay identified reduced MMR capacity in cell lines with known microsatellite instability (Supplementary Fig. 2) and in cell lines with ARID1A knockdown (Fig. 2a and Supplementary Fig. 3a). Conversely, ARID1A expression in ARIDlA-null OAW42 cells substantially increased MMR capacity (Fig. 2b and Supplementary Fig. 3b). Depletion of an ATPase catalytic subunit, BRG1, but not BRM, decreased MMR, implying that the SWI/SNF chromatin remodeling activity is required for MMR (Fig. 2c and Supplementary Fig. 3c). In 21 ovarian cancer cell lines, we found that MMR capacity correlated with ARID1A expression level (Fig. 2d–f and Supplementary Fig. 4a). In cell lines with intact MMR protein expression (MSH2, MLH1, and MSH6), we found that lower ARID1A expression correlated with lower MMR capacity (Supplementary Fig. 4b). There was no correlation of ARID1A expression level with expression level of these MMR proteins (Supplementary Fig. 4c–e). In TCGA and Cancer Cell Line Encyclopedia (CCLE) datasets, we found no correlation of ARID1A mRNA expression level with mRNA expression levels of key MMR proteins MLH1, MSH2, MSH3, MSH6, PMS1, and PMS2 (Supplementary Fig. 5a–g). A recent study showed that ARID1A regulates enhancer-mediated transcription regulation7. However, MMR genes were not targeted by enhancer-mediated gene regulation by ARID1A. (Supplementary Fig. 5h). Moreover, we found that ARID1A lacking MSH2 binding could not rescue impaired MMR in ARIDlA-depleted cells (Fig. 2g and Supplementary Fig. 3d).These data showed that ARID1A regulates MMR repair independently of ARIDlA’s transcriptional regulation activity.
Fig. 2 |. ARID1A deficiency promotes mutability through regulating MMR.
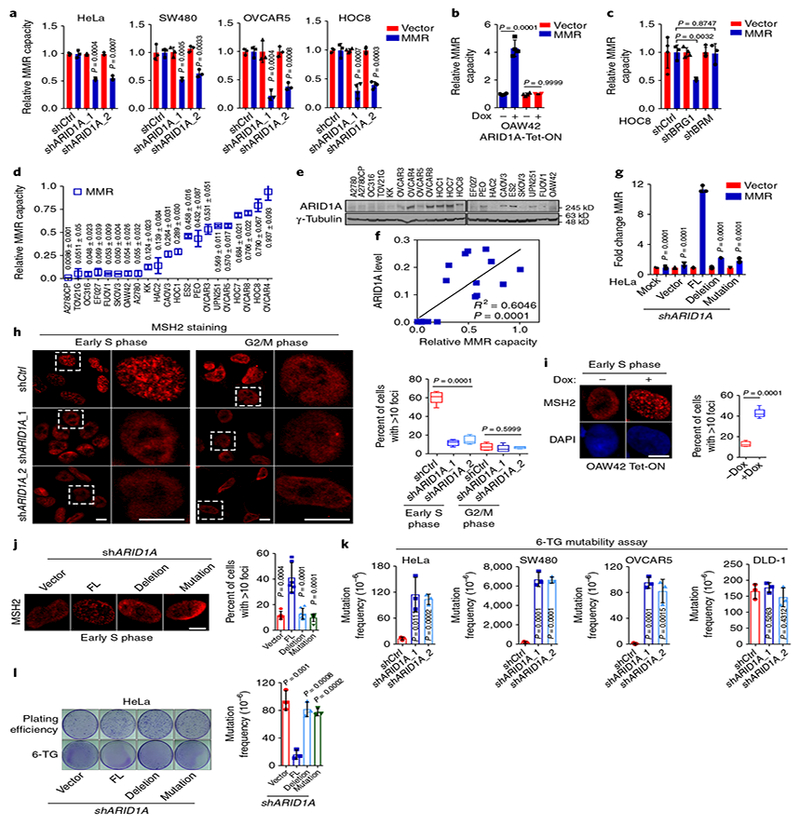
a, Relative MMR capacities in control (shCtrl) and ARID1A-knockdown cells. b, Relative MMR capacities in ARID1A-null OAW42 cells. c, Relative MMR capacity in HOC8 cells with BRG1 or BRM knockdown. d, Relative MMR capacities in 21 ovarian cancer cell lines. e, Representative western blots of ARID1A in 21 ovarian cancer cell lines from three independent experiments. Uncropped blots are shown in Supplementary Fig. 12. f, Correlation analysis of ARID1A protein levels in e with MMR capacities in d using linear regression analysis (n = 3 independent experiments). g, Relative MMR capacities in ARID1A-depleted HeLa cells reconstituted with wild-type or mutant ARID1A constructs. FL, full-length. Deletion, deletion of 1,700–1,800 aa. Mutation, A5337G. h, Immunocytochemistry and statistical analysis of MSH2 foci formation in control and ARID1A-knockdown HeLa cells. Dashed square, magnification of area. Early S phase, 1 h after thymidine release; G2/M phase, 8 h after thymidine release. Scale bars, 10 μ m. Data represent mean ± s.e.m. (Early S phage: shCtrl, 60.38 ± 2.976%, n = 250 cells; shARID1A_1, 12.05 ± 1.346%, n = 168 cells; shARID1A_2, 15.11 ± 1.891%, n = 121 cells; G2/M phage: shCtrl, 7.974 ± 1.597%, n = 345 cells; shARID1A_1, 6.008 ± 1.661%, n = 472 cells; shARID1A_2, 7.218 ± 0.47%, n = 179 cells; from 3 independent experiments; one-way ANOVA). i, MSH2 foci at early S phase in ARID1A-null OAW42 cells. Scale bars, 10 μ m. Data represent mean ± s.e.m. (without doxycycline (–dox): 13.02 ± 1.119%, n = 49 cells; with doxycycline (+ dox): 42.47 ± 1.804%, n = 35 cells; from 3 independent experiments, two-tailed t test.) j, MSH2 foci at early S phase in ARID1A-depleted HeLa cells reconstituted with wild-type or mutant ARID1A vectors. Scale bars, 10 μ m. (vector, n = 123 cells; FL, n = 101 cells; deletion, n = 151 cells; mutation, n = 177 cells; from 3 independent experiments; two-tailed t test compared with FL). k, Mutability assay in HeLa, SW480, OVCAR5, and DLD-1 cells. l, Mutability assay in ARID1A-depleted HeLa cells reconstituted with wild-type or mutant ARID1A constructs. Data represent mean ± s.e.m., n = 3 independent experiments, two-tailed t tests in a–d, g, k, and l).
In synchronized HeLa cells (Supplementary Fig. 6a,b), ARID1A, MSH2, and MSH6 formed distinct nuclear foci in a time-dependent manner, with the most substantial foci formation observed in early and middle S phases (1 h and 2.5 h after thymidine release; Supplementary Fig. 6c,d). Expression levels of ARID1A, MSH2, and MSH6 were not substantially altered by cell cycle, whereas expression levels of cyclin E and phosphohistone H3 were (Supplementary Fig. 6b). About 50% of ARID1A foci co-localized with MSH2 and MSH6 foci in early S phase (Supplementary Fig. 6e). And notably, ARID1A depletion markedly reduced MSH2 foci formation (Fig. 2h). The reduction of MSH2 foci formation in ARID1A-deficient cells was rescued by restoration of wild-type ARID1A in ARIDlA-null OAW42 cells (Fig. 2i). However, deletion (1,700–1,800 aa) or patient-derived mutant (A5337G) ARID1A lacking MSH2 interaction was unable to rescue impaired MSH2 foci formation (Fig. 2j). Furthermore, ARID1A knockdown significantly (P = 0.0007) reduced foci formation of MSH6, a well-known heterodimerization partner of MSH2 (Supplementary Fig. 6f). Impaired foci formation of MSH2 and MSH6 was not due to failed synchronization or altered MSH2 and MSH6 expression in ARIDlA-depleted cells (Supplementary Fig. 6g,h). As expected from MMR deficiency, ARID1A depletion significantly increased mutation frequency, but the mutation frequency remained unchanged in MMR-deficient DLD-1 cells (Fig. 2k and Supplementary Fig. 7a–d). Additionally, ARID1A mutants lacking MSH2 interaction failed to rescue enhanced mutability in ARID1A-depleted cells (Fig. 2l). ARID1A knockdown had similar effects to MSH2 knockdown on both MMR capacity and mutability. However, ARID1A knockdown in MSH2-deficient cells did not further change either MMR capacity or mutability (Supplementary Fig. 7e–g). Collectively, these results indicated the role of ARID1A in MMR through regulating MSH2 function.
We examined the clinical relevance of this finding in TCGA tumors. The mutation load was significantly elevated in ARID1A-mutant tumors (Fig. 3a and Supplementary Table 4). £RGl¯mutant tumors also exhibited an elevated mutation load (Supplementary Fig. 8a). Furthermore, there was a negative association between ARID1A protein and mRNA expression level and mutation load (Fig. 3b,c). The C>T mutation frequency was dramatically higher in ARID1A-mutants (Fig. 3d). C>T mutations represent the mutator phenotype most commonly seen in MMR-deficient tumors8. We also analyzed microsatellite instability (MSI) in tumors using a genomic MSI classifier9. ARID1A protein and mRNA levels were significantly lower in tumors with MSI than in microsatellite stable (MSS) tumors (Fig. 3e,f). In addition, ARID1A mutations were highly enriched in tumors with MSI (Fig. 3g).
Fig. 3 |. ARID1A deficiency is associated with a MMR-defective mutator phenotype.
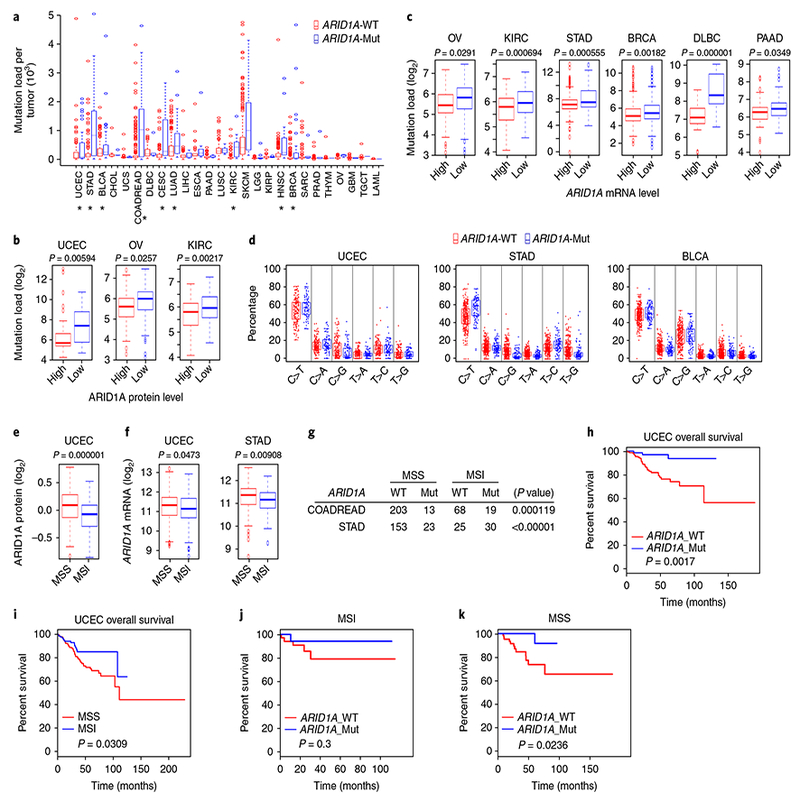
a, Mutation load in ARID1A-wild-type (WT) and ARID1Amutant (Mut) tumors from 26 cancer types. Cancer types with statistically significant differences between ARID1A-WT and ARID1A-Mut indicated by * (two-tailed t test); P values are shown in Supplementary Table 4. b, log2-valued mutation load in tumors with high or low ARID1A expression as determined by reverse-phase protein array. (uterine corpus endometrial carcinoma (UCEC), n = 198, high: 6.330906042, low: 7.294436325, standard error = 0.158625399; ovarian cancer (OV), n = 308, high: 5.471777482, low: 5.792463647, standard error = 0.049291046; KIRC, n = 313, high: 5.711217867, low: 6.037558673, standard error = 0.038347266; two-tailed t test). c, log2-valued mutation load in tumors with high or low ARID1A expression as determined by RNA-seq. (OV, n = 235, high: 5.47945417, low: 5.724745595, standard error = 0.056062231; KIRC, n = 436, high: 5.894734029, low: 6.211603408, standard error = 0.046937789; STAD, n = 371, high: 7.360502308, low: 7.984473751, standard error = 0.09068629; BRCA, n = 966, high: 5.346146074, low: 5.601771093, standard error = 0.041060948; DLBC, n = 48, high: 7.056759879, low: 8.517913502, standard error = 0.166581137; PAAD, n = 146, high: 6.284940848, low: 6.610659751, standard error = 0.077254816; two-tailed t test) d, Distribution of six types of mutation in ARID1A-WT and ARID1A-Mut tumors. C-to-T mutation: UCEC (n = 243, WT: 53.35262679%, Mut: 56.36623983%, standard error = 0.844758609, P = 0.047385754, two-tailed t test), STAD (n = 391, WT: 47.24396225%, Mut: 56.08073032%, standard error = 0.681799469, P = 2.49 × 10⁻⁹, two-tailed t test), and BLCA (n = 395, WT: 48.27947629%, Mut: 51.12505553%, standard error = 0.465674252, P = 0.003983508; two-tailed t test). e, ARID1A protein levels in MSS tumors and tumors with MSI from UCEC patients (n = 311, MSS: 0.085079362, MSI: –0.087844869, standard error = 0.017715104; two-tailed t test). f, ARID1A mRNA levels in MSS tumors and tumors with MSI from UCEC and STAD patients (UCEC, n = 426, MSS: 11.26773514, MSI: 11.11618424, standard error = 0.034736899, two-tailed t test; STAD, n = 260, MSS: 11.31157188, MSI: 11.10788881, standard error = 0.034995948, two-tailed t test). g, Association of MSS and MSI with ARID1A mutation status in COADREAD and STAD tumors as determined by χ2 analysis (COADREAD, n = 303; STAD, n = 231). h, Overall survival in UCEC patients with ARID1A-WT and ARID1A-Mut tumors (WT: n = 161, Mut: n = 82, log-rank (Mantel–Cox) test). i, Overall survival in UCEC patients with MSS tumors and tumors with MSI (MSS: n = 284; MSI: n = 153, log-rank (Mantel–Cox) test). j,k, Overall survival by ARID1A mutation status in UCEC patients with MSI tumors (ARID1A_WT: n = 36; ARID1A_Mut: n = 21, log-rank (Mantel–Cox) test) and MSS tumors (ARID1A_WT: n = 71; ARID1A_Mut: n = 38, log-rank (Mantel–Cox) test).
Moreover, MMR gene mutation was found to be significantly (P = 0.0001) associated with ARID1A-wild-type tumors but not with ARID1A-mutant tumors (Supplementary Fig. 8b). Loss of MLH1 expression due to MLH1-promoter methylation causes MMR deficiency and MSI10. We then analyzed the correlation between ARID1A mutation and MLH1 mRNA expression. In MSI tumors, ARID1A mutation was associated with reduced MLH1 mRNA expression (Supplementary Fig. 8c). However, in tumors without defined markers of MSI (indicated as MSS), ARID1A mutation did not correlate with MLH1 mRNA levels. Proteomic data showed that ARID1A mutations were not associated with alterations in MSH2 or MSH6 protein expression, which was consistent with their functional regulation by ARID1A (Supplementary Fig. 8d). Due to functional impairment of MSH2 and/or MSH6 in ARID1A-deficient tumors, as expected, ARID1A mutations were not associated with alterations in MSH2 or MSH6 protein expression, and mutations on the ARID1A–MSH2 axis and mutations on the MLH1–PMS2 axis were mutually exclusive (Supplementary Fig. 8d,e). Together these data indicated that ARID1A mutations may be either a cause or a consequence of MMR deficiency in different genetic contexts.
Next, survival analyses showed that patients with ARID1A mutations in uterine corpus endometrial carcinoma tumors had better prognoses (Fig. 3h), which was consistent with the observation that patients with MSI tumors have better survival rates than patients with MSS tumors (Fig. 3i). ARID1A mutation status was not significantly associated with survival in patients with clinically defined MSI in their tumors (Fig. 3j). Notably, in patients with MSS tumors who did not exhibit characterized molecular markers to be defined as MSI in clinic, ARID1A mutation was associated with a better prognosis (Fig. 3k). Collectively, these findings demonstrated the clinical relevance of ARID1As previously unknown function in regulating MMR.
Recent studies have shown that increased mutability in MMR-deficient tumors increases neoantigen load and tumor-infiltrating lymphocytes (TILs), which promote immunogenicity and render MMR-deficient tumors susceptible to immune checkpoint block-ade11–14. Therefore, we tested whether ARID1A-deficient tumors have high levels of TILs. ARID1A depletion remarkably reduced MMR capacity, but did not affect cell cycle progression in ID8 cells (Supplementary Fig. 9a–c). ARID1A loss significantly increased ID8-tumor volume and progression in both orthotopic and intra-peritoneal models (Fig. 4a,b and Supplementary Fig. 9d). Exome sequencing showed a higher mutation load in ARID1A-depleted tumors (Fig. 4c). These tumors had comparable staining of Ki67 (Supplementary Fig. 9e), suggesting that the increased mutation load was not due to an increased proliferation rate. Expression of cleaved-caspase 3, an apoptotic marker, was reduced in ARIDlA-depleted tumors (Supplementary Fig. 9e). Notably, immu-ohistochemistry analysis revealed significantly higher levels of protein expression of Cd8, a key cytotoxic T lymphocyte marker15, and substantial upregulation of Pdcdl, which encodes a key molecule in the immune checkpoint pathway in ARIDlA-depleted tumors (Fig. 4d and Supplementary Fig. 9f)16. However, ARID1A depletion did not increase Pdcdl expression in vitro (Supplementary Fig. 9g), suggesting a role for microenvironment interactions. In ovarian cancer patient specimens, ARIDlA-deficient tumors also exhibited remarkable increases in CD8 and PD-L1 (Fig. 4e and Supplementary Fig. 9h). Analysis of TCGA tumors using two independent TIL signatures17–19 showed that tumors with an increased-TIL transcriptome signature had significantly reduced ARID1A expression (Fig. 4f and Supplementary Fig. 10a–d). Furthermore, genes involved in ARID1A-associated enhancer-mediated regulation did not overlap with TIL signature genes, suggesting that the altered TIL signature was not due to transcriptional control through ARID1A-associated enhancer activity7 (Supplementary Fig. 10e). These findings raised the possibility that immune checkpoint blockade would restore antitumor immunity in ARIDlA-deficient tumors and thereby limit tumor growth.
Fig. 4 |. ARID1A-deficient tumors display increased TILs, activation of immune checkpoint, and sensitization to immune checkpoint blockade therapy.
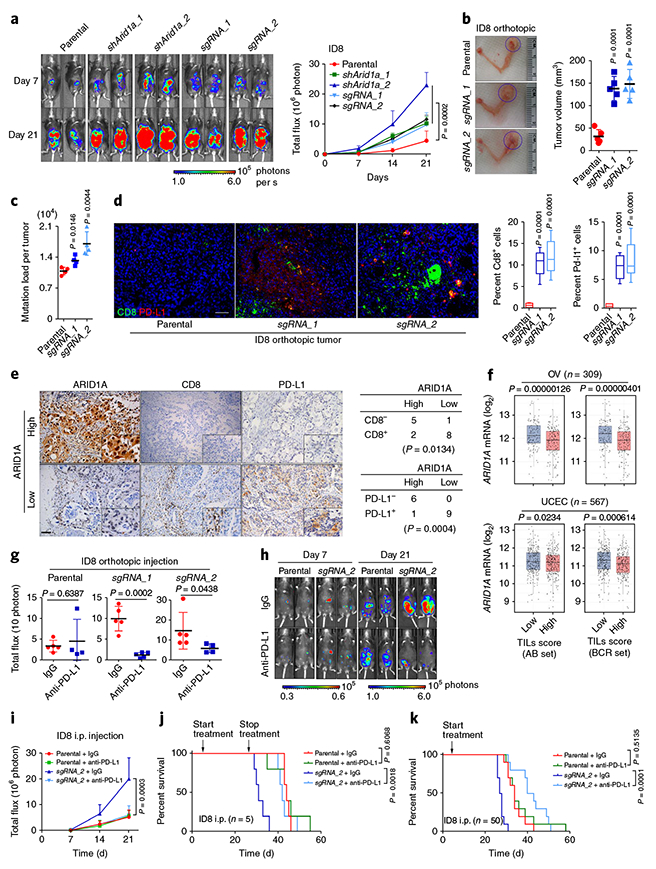
a, Representative bioluminescence images of mice bearing control and Arid1a-deficient tumors formed by intraperitoneal (i.p.) injection of parental and Arid1a-depleted ID8 cells. The graph shows the change in bioluminescence in mice over time. Data represent mean ± s.e.m. (endpoint: parental, 4.487 ± 3.238 (n = 5); shArid1a_1, 10.227 ± 2.181 (n = 5); shArid1a_2, 22.873 ± 4.201 (n = 5); sgRNA_1, 9.732 ± 4.0625 (n = 5); sgRNA_2, 11.583 ± 1.364 (n = 5); one-way ANOVA). Uncropped blots are shown in Supplementary Fig. 13. b, Representative images of ID8 tumors formed by intrabursal injection of ID8 cells (30 d after inoculation) and corresponding tumor volume (parental, n = 5 mice, 32.7 ± 6.888 mm3; sgRNA_1, n = 5 mice, 138.5 ± 11.86 mm3; sgRNA_2, n = 5 mice, 148.8 ± 14.25 mm3; two-tailed t test compared with parental). c, Mutation burden in ID8 tumors formed by intrabursal injection of parental and Arid1a-depleted ID8 cells as determined by whole-exome sequencing (parental, n = 4 mice, 1.091 ± 0.04266; sgRNA_1, n = 4 mice, 1.322 ± 0.05276; sgRNA_2, n = 4 mice, 1.706 ± 0.132; two-tailed t test compared with parental). d, Cd8 and PD-L1 immunohistochemistry (IHC) staining in ID8 orthotopic tumors and H-score analysis (parental, n = 5 mice, 0.7526 ± 0.1911%; sgRNA_1, n = 5 mice, 10.45 ± 1.012%; sgRNA_2, n = 5 mice, 12.08 ± 1.378%, two-tailed t test compared with parental). Scale bar, 100 μ m. e, IHC staining of ARID1A, CD8, and PD-L1 in ovarian cancer patient specimens (n = 16; 8 cases of ovarian serous adenocarcinoma and 8 cases of ovarian clear cell carcinoma (OCCC)). The χ2 association analysis is shown. Scale bar, 100 μ m. f, Association of TILs with ARID1A expression in OV and UCEC patient samples as analyzed by two TIL signatures (AB set and BCR set). Data represent mean ± s.e.m. (OV, n = 309, AB set: low, mean = 12.15276888, 95% confidence interval: 12.05091684–12.25462092; high, mean = 11.84214927, 95% confidence interval: 11.748771–11.93552755, two-tailed t test; BCR set: low, mean = 12.15367094, 95% confidence interval: 12.04573576–12.26160613; high, mean = 11.85680455, 95% confidence interval: 11.7668279–11.94678121, two-tailed t test; UCEC, n = 567, AB set: low, mean = 11.26615124, 95% confidence interval: 11.18430059–11.34800189; high, mean = 11.13324207, 95% confidence interval: 11.05226376–11.21422038, two-tailed t test; BCR set: low, mean = 11.29127279, 95% confidence interval: 11.21167643–11.37086914; high, mean = 11.09105846, 95% confidence interval: 11.00889521–11.17322171; two-tailed t test). g, Endpoint bioluminescence of mice bearing ID8 orthotopic tumors after 21 d of IgG or anti-PD-L1 treatment (parental + IgG, n = 5 mice, 3.403 ± 0.6162; parental + anti-PD-L1, n = 4 mice, 4.575 ± 2.599; sgRNA_1 + IgG, n = 5 mice, 9.853 ± 1.315; sgRNA_1 + anti-PD-L1, n = 5 mice, 1.133 ± 0.279; sgRNA_2 + IgG, n = 5 mice, 16.08 ± 3.605; sgRNA_2 + anti-PD-L1, n = 4 mice, 5.767 ± 1.103; two-tailed t tests). h, Representative bioluminescence images of IgG- or anti-PD-L1-treated mice bearing ID8 i.p. tumors. i, Changes in bioluminescence over time (day 21, parental + IgG, n = 5 mice, 5.249 ± 1.236%; parental + anti-PD-L1, n = 5 mice, 5.699 ± 0.9666%; sgRNA_2 + IgG, n = 5 mice, 20.04 ± 3.65%; sgRNA_2 + anti-PD-L1, n = 5 mice, 6.149 ± 1.58%, one-way ANOVA). j, Survival curves of mice with ID8 i.p. tumors. Treatment was started on day 7 of inoculation and stopped on day 28 (n = 5 mice per group, log-rank (Mantel–Cox) test). k, Survival curves of mice with ID8 i.p. tumors. Treatment was started on day 7 and continued until the mice were killed for analysis (n = 10 mice per group, log-rank (Mantel–Cox) test).
We tested this possibility in both orthotopic and intraperitoneal ovarian cancer mouse models (Fig. 4g and Supplementary Fig. 11a–c). Before treatment, the control and anti-PD-L1-treated groups had identical tumor volumes (Supplementary Fig. 11b). Compared to control tumors, ARIDlA-deficient tumors showed a remarkable response to anti-PD-L1 antibody (Fig. 4g,h and Supplementary Fig. 11c–g). In mice bearing ARIDlA-deficient tumors, both transient and continuous treatment with anti-PD-L1 antibody significantly prolonged survival, with continuous treatment producing a more remarkable survival benefit (Fig. 4j,k and Supplementary Fig. 11h). We further confirmed the treatment effect in a syngeneic colon cancer model. Owing to aggressive tumor growth in the control groups, response to anti-PD-L1 treatment was monitored for only 12 d. Nevertheless, ARIDlA-deficient tumors exhibited a better response to anti-PD-L1 than control tumors did, despite a very short treatment period (Supplementary Fig. 11j,k). Together, these data demonstrated that ARIDlA-deficient tumors are sensitive to immune checkpoint blockade targeting the PD-1–PD-L1 pathway (Supplementary Fig. 11l).
In this study, we found that the chromatin remodeling factor ARID 1A interacts with MMR protein MSH2. ARID 1A regulates MMR and mutagenesis, which may explain its tumor-suppressive role. Consistent with our findings, previous studies suggested a correlation between ARIDlA mutations and MSI in tumor sample analyses20–23, and ARIDlA mutations are associated with better outcome in high-grade endometrial cancer20. Immune checkpoint blockade is among the most promising emerging approach in cancer treatment24. However, it benefits only a limited subpopulation of patients. Therefore, there is an urgent clinical need to identify molecular tumor subtypes that are likely to benefit from specific immunotherapies25. Our results suggest ARIDlA status as a potential predictor of response to inhibitors of the PD-1–PD-L1 immune checkpoint pathway. Recently, mutations in PBRMl, encoding a component of the SWI/SNF complex, were found to be associated with benefit of immune therapy26,27. Our study may provide a mechanistic basis for broadening the application of immune checkpoint blockade to patients with SWI/SNF-pathway mutant tumors.
Methods
Methods, including statements of data availability and any associated accession codes and references, are available at https://doi.org/10.1038/s41591-018-0012-z.
Methods
Pan-cancer analysis.
Data on 32 cancer types were downloaded from the TCGA database and analyzed as previously described8. Briefly, for ARID1A mutation rate analysis, we included missense, nonsense, nonstop, silent, and frameshift/in-frame insertions and deletions, except for larger genomic fragment rearrangements. For mutation load calculation, we counted the total number of mutations per tumor. Cutoffs of 25% and 50% were used to define ARID1A ‘high’ and ‘low’ status in reverse-phase protein array and RNA-seq analyses, respectively. The frequencies of 6 classes of mutations were calculated by dividing the total number of mutations in each category by the total number of mutations in the 6 categories combined. MSI status was determined using published information combining the results of bioinformatics analysis and experimental assessment9. Correlations between categorical variables were determined using the χ2 test. Levels of gene or protein expression were compared between groups using Student’s t test. Significance is defined as P < 0.05 throughout. All statistical analyses were performed using R software (version 3.3.2, https://www.r-project.org/).
Cell culture.
Cell lines were validated by short tandem repeat (STR) DNA fingerprinting using the AmpF STR identifier kit according to the manufacturer’s instructions (Applied Biosystems, catalog no. 4322288). The STR profiles were compared to known American Type Culture Collection fingerprints, to the Cell Line Integrated Molecular Authentication database, version 0.1.20080828, and to the MD Anderson fingerprint database. The STR profiles matched known DNA fingerprints or were unique. The vector or ARID1A (pLenti-puro-ARID1A) constructs were introduced into HEK 293 T cells by lentiviral infection and further selected by puromycin at 1 μg/mL. The stable clones were then pooled and analyzed for ARID1A and/or V5-tag expression. The colorectal and ovarian cancer cell lines were kindly provided by G. B. Mills’ laboratory at The University of Texas MD Anderson Cancer Center. Cell line authentication was performed in the MD Anderson Characterized Cell Line Core in 2012 and 2013. HEK 293 T and SW480 cells were maintained in DMEM (high-glucose, Cellgro), and other cell lines were maintained in RPMI1640 medium (Cellgro). All media were supplemented with 10% FBS with glutamine, penicillin, and streptomycin. The ID8 mouse ovarian surface epithelial cells were kindly provided by V. Afshar-Kharghan’s laboratory at MD Anderson. The ID8 cells were maintained in DMEM (high-glucose, Cellgro) supplemented with 4% FBS, 100 U/mL penicillin, 100 μg/mL streptomycin, 5 μg/mL insulin, 5 μg/mL transferrin, and 5 ng/mL sodium selenite. Cells were incubated at 37 °C in a humidified incubator with 5% CO2.
HPRT mutability assay.
The HPRT mutability assay was performed as described previously with minor modifications28. In brief, cells (1 × 10⁶) were seeded in triplicate in 100-mm dishes for 12 h and maintained with complete medium containing 5 μM freshly prepared 6-thioguanine (6-TG). The plating efficiency was determined by culturing 5 × 10² cells similarly in the absence of 6-TG. After 3 weeks of culturing, cell colonies were visualized by staining with 0.05% crystal violet. The mutation frequency was calculated by dividing the number of 6-TG-resistant colonies by the total number of cells plated after correction for the colony-forming ability.
Cell synchronization and cell cycle analysis.
Cell synchronization was performed as described previously28. Basically, cells were arrested at G1/S by culturing for 18 h in complete medium containing 2 mM thymidine, for 9 h in thymidine-free medium, and then for an additional 15 h in thymidine-containing medium before release into complete medium. Cells were collected at 0 h (G1 phase), 1 h (early S), 2.5 h (middle S), 4 h (late S), and 8 h (G2/M). Cell cycle status was further validated by flow cytometry.
Antibodies, plasmids, and reagents.
Anti-ARID1A (A301–040A), anti-BRG1 (A303–877A), and anti-BRM (A301–014A) antibodies were purchased from Bethyl Laboratories. Anti-V5 (R960–25) antibody was purchased from ThermoFisher Scientific. Anti-Flag (14793), anti-PD-L1 (13684 and 64988), and anti-ARID1A (immunofluorescence, 12354) antibodies were purchased from Cell Signaling Technology. Anti-MLH1 (554073) antibody was purchased from BD Biosciences. Anti-MSH2 (ab52266) and anti-MSH6 (ab92471) antibodies were purchased from Abcam. Anti-CD8 (sc-7970) and other antibodies were purchased from Santa Cruz Biotechnology. Doxycycline, 6-TG, thymidine, and Coomassie blue were purchased from Sigma-Aldrich. VivoGlo Luciferin was purchased from Promega. Isotype control IgG and anti-PD-L1 (BE0101, clone 10F.9G2) antibodies were purchased from Bio X Cell. MSH2 full-length and deletion constructs were kindly provided by J. Chen’s laboratory at MD Anderson. ARID1A deletion and mutation constructs were generated and purchased from Epoch Life Science Inc. The multiplexed immunofluorescence IHC kit was purchased from PerkinElmer.
RNA interference and CRISPR–Cas9 gene editing.
ARID1A knockdown was achieved by RNA interference using a lentiviral vector-based MISSION shRNA (Sigma). Lentiviral particles corresponding to the MISSION shRNA ARID1A NM_006015 target set were used, as well as a MISSION nontarget shRNA control. The shRNA sequences were as follows: V3LHS 410041 (#1), TAAATAGCTGTGTCTCGCT; V2LHS_71866 (#2), TCTTGAGATAGCTCCTGCG; V3LHS_410041 (3’ UTR targeting), TAAATAGCTGTGTCTCGCT. For mouse ARID1A knockdown, the following shRNA sequences were used: TRCN0000238304 (#1), CTAGGCAGCCTAACTATAAT; TRCN0000238306 (#2), TTTATAGTATGGCGAGTTAA. For CRISPR–Cas9 gene knockout, the mouse ARID1A sgRNAs were purchased from GeneCopoeia (MCP225840-SG01–3). Specificity and efficacy of ARID1A knockdown or knockout were evaluated by western blotting.
Immunoblotting, immunoprecipitation, and mass spectrometry.
Cells were washed in PBS, and cellular proteins were extracted in 8 mol/L urea lysis buffer plus protease and phosphatase inhibitors (GenDEPOT) for 30 min at 4 °C. Lysates were cleared by centrifugation, and proteins were separated by gel electrophoresis. Membranes were blocked in PBS 0.1% Tween 20 (PBS-T)/5% (w/v) milk for 1 h at room temperature (20–25 °C). Membranes were then incubated with primary antibodies diluted in PBS-T/5% (w/v) milk at 4 °C overnight. Subsequently, membranes were washed with PBS-T and incubated with horseradish peroxidase secondary antibody (1:2,000; Jackson ImmunoResearch) diluted in PBS-T/5% skim milk. Membranes were washed in PBS-T, and bound antibody was detected by enhanced chemiluminescence (GE Healthcare). For immunoprecipitation, whole-cell extracts (1–2 mg) were prepared with RIPA buffer (50 mM Tris-HCl pH 7.4, 1% Nonidet P40, 150 mM NaCl, 1 mM EDTA, 10% sodium deoxycholate, freshly added with 1 mM phenylmethylsulfonyl fluoride (PMSF), 1 mM Na3VO4 and 1 mM NaF), and were incubated with antibody (1:100–200 dilution) at 4 °C overnight, followed by addition of 10 μL of protein A/G-conjugated agarose beads (GE Healthcare). The precipitates were washed 4 times with ice-cold lysis buffer, resuspended in 2 × Laemmle buffer, and resolved by SDS-PAGE followed by immunoblotting. For mass spectrometry, 10 mg of Vector-V5-overexpressing or ARID1A-V5-overexpressing 293 T cell lysate were incubated with anti-V5 (1:100, Thermo Fisher Scientific) antibody for 1 h at 4 °C, followed by additional 1 h incubation with 10 μL of protein A/G beads at 4 °C. The resulting precipitates were subjected to mass spectrometry or SDS-PAGE separation followed by Coomassie blue visualization. The peptides in both Vector-V5 and ARID1A-V5 samples were identified and the unique genes were determined by the following criteria: (i) more than three peptide hits only discovered in ARID1A-V5 sample; or (ii) more than threefold increase of peptide hits in ARID1A-V5 compared to Vector-V5.
Immunofluorescence.
For detection of subcellular localization of MSH2, MSH6, and ARID1A, immunofluorescent staining was performed essentially as described29. After treatment, cells were first fixed in ice-cold methanol for 10 min at −20 °C, then blocked with 10% goat serum for 30 min at room temperature. Primary antibodies (MSH2, MSH6, 1:500, Abcam; ARID1A, 1:200, Santa Cruz) were incubated at 4 °C overnight, and Alexa Fluor 488- or Alexa Fluor 594-conjugated secondary antibodies (1:500,Thermo Fisher Scientific) were incubated for 1 h at room temperature. Slides were mounted in ProLong antifade mounting medium containing DAPI (Thermo Fisher Scientific) and analyzed under a fluorescence microscope. At least 50 cells per sample were analyzed, and the percentage of cells with foci formation was determined.
IHC staining.
Patient tissue specimens were obtained from Tongji Hospital, The University of Huazhong Science & Technology. Tissue microarrays were purchased from US Biomax Inc (OV1004). As described previously30, tissue microarrays or sections cut from formalin-fixed, paraffin-embedded blocks were baked at 60 °C for 1 h, deparaffinized, rehydrated with serial passage through changes of xylene and graded alcohol, and washed in water. Antigen retrieval was performed using either citrate or EDTA buffer, depending on the antibody. Endogenous peroxidase in tissues was blocked by incubation of slides in 3% hydrogen peroxide solution before incubation with primary antibody. The following antibodies were used for IHC: human anti-ARID1A (1:100, Cell Signaling Technology), human anti-PD-L1 (1:100, Cell Signaling Technology), mouse anti-PD-L1 (1:100, Cell Signaling Technology), anti-CD8 (1:200, Santa Cruz), anti-Ki67 (1:200, Cell Signaling Technology), and anti-cleaved-Caspase3 (1:50, Cell Signaling Technology). Stained slides were counterstained with hematoxylin and coverslipped for review. The multiplexed immunofluorescence analysis was performed following the manufacturer’s instructions (PerkinElmer). Positivity was defined as staining in at least 5% of cells. The H-score was calculated by the formula (3 × percentage of strong staining nuclei) + (2 × percentage of moderate staining nuclei) + percentage of weak staining nuclei, as described previously31.
Whole-exome sequencing.
Briefly, DNA was obtained from ID8 orthotopic tumors using a DNA extraction kit (Qiagen). Whole-exome capture was accomplished at the MD Anderson Sequencing and Microarray Facility according to the manufacturer’s protocol. Captured targets were subjected to massive sequencing using the Illumina HiSeq 4000 platform with the paired-end 75-bp read option, according to the manufacturer’s instructions. The number of reads was from 150 million to 300 million for each sample, with mean coverage ranging from 24 × to 61 × per sample. Sequenced reads were mapped to Genome Reference Consortium GRCm38 (mm10) version of the mouse reference genome sequence using BWA version 0.7.1232. For subsequent reads, preprocessing steps before variant calling, including realignment, mark duplicates, and recalibration, were carried out according to the Genome Analysis Toolkit’s best practices33. Single-nucleotide variants were then called using MuTect version 1.1.4 without a matched normal sample34. These single-nucleotide variants were then annotated for variant effects using SnpEff35.
TIL scoring analysis.
Gene expression of ovarian cancer (OV) and uterine corpus endometrial carcinoma (UCEC) tumors from TCGA were analyzed. RNA-seq data were downloaded from TCGA Data Portal and were log-transformed. TIL scores were determined by comparing the gene signatures from two studies that profiled the mRNA expression landscape of immune cells17,18. Differential expressions of 116 genes (AB set) were identified in both cohorts. Unsupervised clustering of the 116-gene signature classified samples into two groups. The ARID1A mRNA levels of TIL-high and TIL-low tumors were analyzed using Student’s t test. The analysis was verified using another TIL signature of eight genes (BCR set)19.
MMR assay.
The MMR assay was performed as previously described6. Briefly, cells were seeded in 12-well plates at a density of 2 × 10⁵cells/well. For each well, the cells were transfected with a plasmid mixture containing 800 ng of pmax-vector, 100 ng of pmax-BFP, and 100 ng of pmax-mOrange (vector control) or pmax-G:G-mismatch-mOrange (MMR). After 24 h of transfection, cells were harvested and analyzed by flow cytometry. The relative MMR capacity was determined by dividing the percentage of mOrange-positive cells in MMR by the percentage of mOrange-positive cells in vector control. The pmax-BFP in each group was used as an internal transfection control to normalize the mOrange expression.
In vivo mouse models.
For the intraperitoneal model, ID8 cells (5 × 10⁶) were injected into the peritoneal cavity of C57BL/6 mice (female, 6–8 weeks old, CRL/NCI). All studies were supervised and approved by the MD Anderson Institutional Animal Care and Use Committee (IACUC). When used in a power calculation, our sample size predetermination experiments indicated that 5 mice per group could identify the expected effects with 90% power. Animals were randomly assigned to different groups. For the orthotopic model, C57BL6 mice were anesthetized with isoflurane, and a single dorsal midline incision was made to allow access to both ovaries. Then 1 × 10⁶ ID8 cells in 5 μL of PBS were injected under the ovarian bursa using a Hamilton syringe with a 30-gauge needle. While the cells were not directly injected into the ovary, the injection technique disrupted an area of the existing surface epithelium, providing direct contact between the ID8 cells and the ovarian stroma. The mice were allowed to recover and monitored closely for the next 24 h. Tumor progression was monitored once a week using a Xenogen IVIS Spectrum in vivo bioluminescence imaging system. Tumor volume was determined on the basis of the total flux (photons per s). Tumor-bearing mice were treated by i.p. injection with isotype control IgG or anti-PD-L1 antibody (200 μg/mouse, B7–H1, clone 10 F.9G2, Bio X Cell) every 3 d. Mice reaching a humane endpoint or weighing more than 35 g as a result of tumor growth and/or ascites were killed for analysis. For the colorectal cancer syngeneic model, murine CT26 colorectal cancer cells CT26 (2 × 10⁵) were subcutaneously injected into the left flank of BALB/C mice (6–8 weeks old, CRL/NCI). Mice were allowed to recover and monitored closely for the next 24 h. Tumor size was measured every 3 d, and tumor volume was determined based on the formula (width × width × length)/2. Tumor-bearing mice were treated (i.p.) with isotype control IgG (200 μg/mouse) or anti-PD-L1 antibody (200 μg/mouse, B7–H1, clone 10 F.9G2, Bio X Cell) every 3 d. Mice reaching an endpoint requiring euthanasia according to IACUC guidelines or exceeding tumor burden limits were killed.
Statistics.
All statistical analyses were done in GraphPad Prism 7 software. Correlations between gene expression levels and MMR capacities were analyzed using linear regression test. Comparisons of MMR gene mutations, CD8 or PD-L1 expression with ARID1A status were performed using the χ2 test. Overall survival of various treatment groups was analyzed using the Cox regression model. Otherwise, unpaired t tests were used to generate two-tailed P values.
Supplementary Material
Acknowledgements
This research was supported by NCI Cancer Center Support Grant CA016672 to The University of Texas MD Anderson Cancer Center, Department of Defense grant 0C140431, NIH R01 grant CA181663 to G.P., Cancer Prevention and Research Institute of Texas grant RP160242 to X.S. and G.P., NIH R01 grant GM093104 to X.S, and NIH P01 grant CA092584 to Z.D.N.
Footnotes
Accession codes. Sequence Read Archive (SRA): SRP132473.
Reporting Summary. Further information on experimental design is available in the Nature Research Reporting Summary linked to this article.
Data availability. All sequencing data that support the findings of this study have been deposited in the National Center for Biotechnology Information Sequence Read Archive (SRA) and are accessible through the SRA Series accession number SRP132473. All other relevant data are available from the corresponding author on request.
Competing interests
G.B.M. has received sponsored research support from Abbvie, AstraZeneca, Critical Outcomes Technology, Horizon Diagnostics, Illumina, Immunomet, Ionis, Karus Therapeutics, Nanostring, Pfizer, Takeda/Millennium Pharmaceuticals, and Tesaro; has ownership interest in Catena Pharmaceuticals, PTV Ventures, and Spindle Top Ventures; and is a consultant/advisory board member of AstraZeneca, Catena Pharmaceuticals, Critical Outcome Technologies, ImmunoMET, Ionis, Medimmune, Nuevolution, Pfizer, Precision Medicine, Signalchem Lifesciences, Symphogen, Takeda/Millennium Pharmaceuticals, and Tarveda. G.P. has received sponsored research support from Pifzer. No potential conflicts of interest were disclosed by the other authors.
Additional information
Supplementary information is available for this paper at https://doi.org/10.1038/s41591-018-0012-z.
Publisher’s note: Springer Nature remains neutral with regard to jurisdictional claims in published maps and institutional affiliations.
References
- 1.Wilson BG & Roberts CW SWI/SNF nucleosome remodellers and cancer. Nat. Rev. Cancer 11, 481–492 (2011). [DOI] [PubMed] [Google Scholar]
- 2.Wu JN & Roberts CW ARID1A mutations in cancer: another epigenetic tumor suppressor? Cancer Discov. 3, 35–43 (2013). [DOI] [PMC free article] [PubMed] [Google Scholar]
- 3.Wu RC, Wang TL & Shih Ie. M. The emerging roles of ARID1A in tumor suppression. Cancer Biol. Ther 15, 655–664 (2014). [DOI] [PMC free article] [PubMed] [Google Scholar]
- 4.Wang X et al. Expression of p270 (ARID1A), a component of human SWI/SNF complexes, in human tumors. Int. J. Cancer 112, 636 (2004). [DOI] [PubMed] [Google Scholar]
- 5.Wang X et al. Two related ARID family proteins are alternative subunits of human SWI/SNF complexes. Biochem. J 383, 319–325 (2004). [DOI] [PMC free article] [PubMed] [Google Scholar]
- 6.Nagel ZD et al. Multiplexed DNA repair assays for multiple lesions and multiple doses via transcription inhibition and transcriptional mutagenesis. Proc. Natl. Acad. Sci. USA 111, E1823–E1832 (2014). [DOI] [PMC free article] [PubMed] [Google Scholar]
- 7.Mathur R et al. ARID1A loss impairs enhancer-mediated gene regulation and drives colon cancer in mice. Nat. Genet 49, 296–302 (2017). [DOI] [PMC free article] [PubMed] [Google Scholar]
- 8.Kandoth C et al. Mutational landscape and significance across 12 major cancer types. Nature 502, 333–339 (2013). [DOI] [PMC free article] [PubMed] [Google Scholar]
- 9.Hause RJ, Pritchard CC, Shendure J & Salipante SJ Classification and characterization of microsatellite instability across 18 cancer types. Nat. Med 22, 1342–1350 (2016). [DOI] [PubMed] [Google Scholar]
- 10.Kane MF et al. Methylation of the hMLH1 promoter correlates with lack of expression of hMLH1 in sporadic colon tumors and mismatch repair-defective human tumor cell lines. Cancer Res. 57, 808–811 (1997). [PubMed] [Google Scholar]
- 11.Zhao H et al. Mismatch repair deficiency endows tumors with a unique mutation signature and sensitivity to DNA double-strand breaks. eLife 3, e02725 (2014). [DOI] [PMC free article] [PubMed] [Google Scholar]
- 12.Le DT et al. PD-1 blockade in tumors with mismatch-repair deficiency. N. Engl. J. Med 372, 2509–2520 (2015). [DOI] [PMC free article] [PubMed] [Google Scholar]
- 13.Llosa NJ et al. The vigorous immune microenvironment of microsatellite instable colon cancer is balanced by multiple counter-inhibitory checkpoints. Cancer Discov. 5, 43–51 (2015). [DOI] [PMC free article] [PubMed] [Google Scholar]
- 14.Le DT et al. Mismatch repair deficiency predicts response of solid tumors to PD-1 blockade. Science 357, 409–413 (2017). [DOI] [PMC free article] [PubMed] [Google Scholar]
- 15.Tscharke DC, Croft NP, Doherty PC & La Gruta NL Sizing up the key determinants of the CD8(+) T cell response. Nat. Rev. Immunol 15, 705–716 (2015). [DOI] [PubMed] [Google Scholar]
- 16.Pardoll DM The blockade of immune checkpoints in cancer immunotherapy. Nat. Rev. Cancer 12, 252–264 (2012). [DOI] [PMC free article] [PubMed] [Google Scholar]
- 17.Angelova M et al. Characterization of the immunophenotypes and antigenomes of colorectal cancers reveals distinct tumor escape mechanisms and novel targets for immunotherapy. Genome Biol. 16, 64 (2015). [DOI] [PMC free article] [PubMed] [Google Scholar]
- 18.Bindea G et al. Spatiotemporal dynamics of intratumoral immune cells reveal the immune landscape in human cancer. Immunity 39, 782–795 (2013). [DOI] [PubMed] [Google Scholar]
- 19.West NR et al. Tumor-infiltrating lymphocytes predict response to anthracycline-based chemotherapy in estrogen receptor-negative breast cancer. BCR 13, R126 (2011). [DOI] [PMC free article] [PubMed] [Google Scholar]
- 20.Allo G et al. ARID1A loss correlates with mismatch repair deficiency and intact p53 expression in high-grade endometrial carcinomas. Mod. Pathol 27, 255–261 (2014). [DOI] [PMC free article] [PubMed] [Google Scholar]
- 21.Chou A et al. Loss of ARID1A expression in colorectal carcinoma is strongly associated with mismatch repair deficiency. Hum. Pathol 45, 1697–1703 (2014) [DOI] [PubMed] [Google Scholar]
- 22.Kim MS, Je EM, Yoo NJ & Lee SH Loss of ARID1A expression is uncommon in gastric, colorectal, and prostate cancers. APMIS 120, 1020–1022 (2012). [DOI] [PubMed] [Google Scholar]
- 23.Wang K et al. Exome sequencing identifies frequent mutation of ARID1A in molecular subtypes of gastric cancer. Nat. Genet 43, 1219–1223 (2011). [DOI] [PubMed] [Google Scholar]
- 24.Koster BD, de Gruijl TD & van den Eertwegh AJ Recent developments and future challenges in immune checkpoint inhibitory cancer treatment. Curr. Opin. Oncol 27, 482–488 (2015). [DOI] [PubMed] [Google Scholar]
- 25.Khalil DN, Smith EL, Brentjens RJ & Wolchok JD The future of cancer treatment: immunomodulation, CARs and combination immunotherapy. Nat. Rev. Clin. Oncol 13, 273–290 (2016). [DOI] [PMC free article] [PubMed] [Google Scholar]
- 26.Pan D et al. A major chromatin regulator determines resistance of tumor cells to T cell-mediated killing. Science 359, 770–775 (2018). [DOI] [PMC free article] [PubMed] [Google Scholar]
- 27.Miao D et al. Genomic correlates of response to immune checkpoint therapies in clear cell renal cell carcinoma. Science 359, 801–806 (2018). [DOI] [PMC free article] [PubMed] [Google Scholar]
- 28.Romano P et al. Cell Line Data Base: structure and recent improvements towards molecular authentication of human cell lines. Nucleic Acids Res. 37, D925–D932 (2009). [DOI] [PMC free article] [PubMed] [Google Scholar]
- 29.Li F et al. The histone mark H3K36me3 regulates human DNA mismatch repair through its interaction with MutSα. Cell 153, 590–600 (2013). [DOI] [PMC free article] [PubMed] [Google Scholar]
- 30.Herbst RS et al. Predictive correlates of response to the anti-PD-L1 antibody MPDL3280A in cancer patients. Nature 515, 563–567 (2014). [DOI] [PMC free article] [PubMed] [Google Scholar]
- 31.Peng D et al. Epigenetic silencing of TH1-type chemokines shapes tumour immunity and immunotherapy. Nature 527, 249–253 (2015). [DOI] [PMC free article] [PubMed] [Google Scholar]
- 32.Li H et al. The Sequence Alignment/Map format and SAMtools. Bioinformatics 25, 2078–2079 (2009). [DOI] [PMC free article] [PubMed] [Google Scholar]
- 33.Van der Auwera GA et al. From FastQ data to high confidence variant calls: the Genome Analysis Toolkit best practices pipeline. Curr. Protoc. Bioinformatics 43, 1–33 (2013). [DOI] [PMC free article] [PubMed] [Google Scholar]
- 34.Cibulskis K et al. Sensitive detection of somatic point mutations in impure and heterogeneous cancer samples. Nat. Biotechnol 31, 213–219 (2013). [DOI] [PMC free article] [PubMed] [Google Scholar]
- 35.Cingolani P et al. A program for annotating and predicting the effects of single nucleotide polymorphisms, SnpEff: SNPs in the genome of Drosophila melanogaster strain w1118; iso-2; iso-3. Fly (Austin) 6, 80–92 (2012). [DOI] [PMC free article] [PubMed] [Google Scholar]
Associated Data
This section collects any data citations, data availability statements, or supplementary materials included in this article.