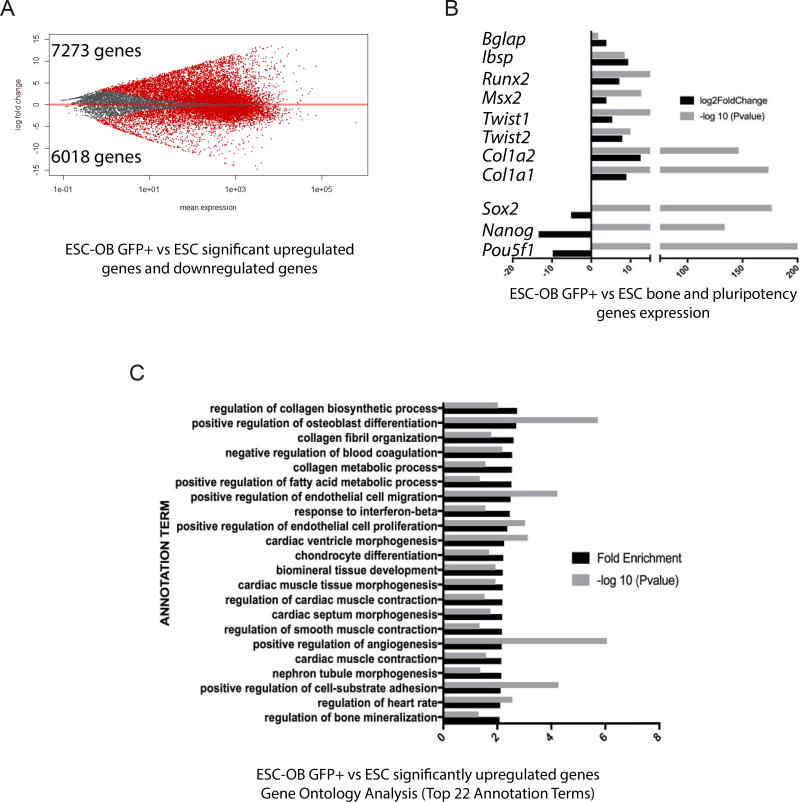
Fig. 7. Genes from ESC-OB GFP+ cells are enriched in osteoblast differentiation and bone mineralization related categories.
(A) A plot of gene expression changes in mouse ESC-OB GFP+ versus ESC. The log2-fold change for gene expression level is plotted on the y-axis and the average of the counts normalized by size factor is shown on the x-axis. Each gene is represented with a dot. Differentially expressed genes with an adjusted p (FDR) value below 0.05 are shown in red. Compared to the ESC population, 7273 genes were significantly upregulated and 6018 genes were downregulated in the ESC-OB GFP+ population. (B) Osteoblast and bone related gene expression levels. Log2-fold change of expression level and −log10 (P value) in mouse ESC-OB GFP+ versus ESC are shown on the X axis. (C) Gene Ontology Analysis of biological process for significantly upregulated genes in mouse ESC-OB GFP+ versus ESC population. Gene fold enrichment and −log10 (P value) of top 22 annotation terms are shown.

