Abstract
To evaluate the usefulness of imaging mass spectrometry (IMS) technology for assessing drug toxicity, we analyzed animal tissues in an amiodarone (AMD)-induced phospholipidosis model by IMS and confirmed the relationship between the distribution of AMD, its metabolites, and representative phospholipids (phosphatidylcholine, PC) and histological changes. AMD was administered to rats for 7 days at 150 mg/kg/day. The lung, spleen, and mesenteric lymph node were histologically examined and analyzed using IMS. The detection intensities of AMD, its metabolites, and typical PCs were higher in regions infiltrated by foamy macrophages compared with normal areas. This tendency was common in all three organs analyzed in this study. For the spleen, signals for AMD, its metabolites, and typical PCs were significantly more intense in the marginal zone, where foamy macrophages and vacuolated lymphocytes are abundant, than in the other areas. These results indicate that AMD, its metabolites, and PCs accumulate together in foamy or vacuolated cells, which is consistent with the mechanism of AMD-induced phospholipidosis. They also indicate that IMS is a useful technique for evaluating the distribution of drugs and biological components in the elucidation of toxicity mechanisms.
Keywords: imaging mass spectrometry, toxicity assessment, histological examination, amiodarone, desethylamiodarone, phosphatidylcholines
Investigation of the local distribution of a drug, its metabolites, and biological components in target organs provides useful information for drug discovery and development1. In a toxicity assessment, the local distribution of a test compound and its metabolites can help elucidate toxicity mechanisms2, 3. Imaging mass spectrometry (IMS) is a powerful technique to visualize the detailed localization of target molecules, such as test compounds, metabolites, or biomarkers, and helps to characterize the biological status of target tissues4, 5, 6. IMS allows detection of target molecules as well as their localization by direct assay of tissue sections by mass spectrometry6. A common ionization technique for detecting target molecules in IMS is the matrix-assisted laser desorption/ionization (MALDI) method in which a pulsed UV laser ionizes target molecules in fresh frozen tissue sections coated with matrix solution, allowing measurement of m/z (mass-to-charge ratio, with “m” meaning the mass number of the target molecule and “z” meaning the charge number of the target molecule)4, 6. By measuring peak intensities of target molecules over numerous laser spots, mass spectrometric images can be generated for specific molecular weight values4. Because IMS requires no labeling, we can readily conduct IMS analyses in toxicity studies. IMS reveals the localization of target molecules in detail with general resolution ranging from 10 to 100 μm depending on the IMS system. Moreover, multiple target molecules can be analyzed concurrently. IMS is also recently being used to assess nonclinical safety during drug development, especially in the discovery of toxicity biomarkers and in obtaining insights concerning toxicological mechanisms1, 2, 7.
To evaluate the utility of IMS, we selected amiodarone (AMD) as a reference compound and compared the distribution of histological lesions with the localization of AMD and its related substances detected using IMS. AMD and its metabolites induce phospholipidosis, characterized by the storage of phospholipids in lysosomes8, 9, 10, 11. Cationic amphiphilic drugs such as AMD and its metabolites accumulate within lysosomes and subsequently promote the storage of phospholipids by directly binding to phospholipids or inhibiting lysosomal phospholipase activity9, 10. These lysosomes containing drugs and phospholipids are observed histologically as small vacuoles or as foamy cytoplasm8, 9. After AMD treatment, numerous vacuoles are histologically observed in macrophages and epithelial cells in various organs9. We examined the ability of IMS to detect AMD, its metabolites, and phospholipids in the same vacuolated cells.
Although phospholipids after AMD treatment have been analyzed by LC-MS or IMS12, 13, 14, these previous reports did not present information on the distribution of these molecules in the context of phospholipidosis mechanisms. We previously reported the use of IMS to evaluate the detectability and distribution of several toxic compounds including AMD15. In the present work, we examined not only AMD itself but also its metabolites and phospholipids (phosphatidylcholine, PC) in rat tissues.
Five-week-old male Sprague Dawley rats were purchased from Charles River Laboratories Japan (Kanagawa, Japan), acclimatized to laboratory conditions, and used at 6 weeks old. AMD hydrochloride (Sigma-Aldrich Corporation, St. Louis, MO, USA) was orally administered to 5 rats for 7 days at 150 mg/kg/day. Vehicle (0.5 w/v% hydroxypropyl methylcellulose, Sigma-Aldrich Corporation, St. Louis, MO, USA; aqueous solution) was orally administered to 5 rats to establish the control group. On the day following the final administration, all animals were sacrificed by exsanguination under deep anesthesia, and their lungs, spleens, and mesenteric lymph nodes were collected. All procedures were performed in accordance with ‘the Rules for Feeding and Storage of Experimental Animals and Animal Experiments of Mitsubishi Tanabe Pharma Corporation.
The sample tissues were fixed using 10% neutral-buffered formalin, dehydrated, and embedded in paraffin. Tissue sections were stained with hematoxylin and eosin (HE) for histological examination. AMD-induced vacuolar changes in the lungs, spleens, and mesenteric lymph nodes were observed as previously described9. For IMS analysis, we selected samples of the above organs from one rat in the AMD treatment group that displayed the most severe histological changes. Samples from a rat in the control group were also subjected to IMS analysis. Sequential frozen sections (5-μm thick) were prepared from the sample tissues of the animals that were frozen at necropsy. These sections were used for IMS analysis and light microscopy to visualize drug localization in relation to the lesion. Frozen sections for IMS analysis were coated with α-cyano-4-hydroxycinnamic acid (1-μm thick matrix layer) using iMLayer (Shimadzu Corporation, Kyoto, Japan). The frozen sections for light microscopy were fixed using formalin-alcohol and stained with HE.
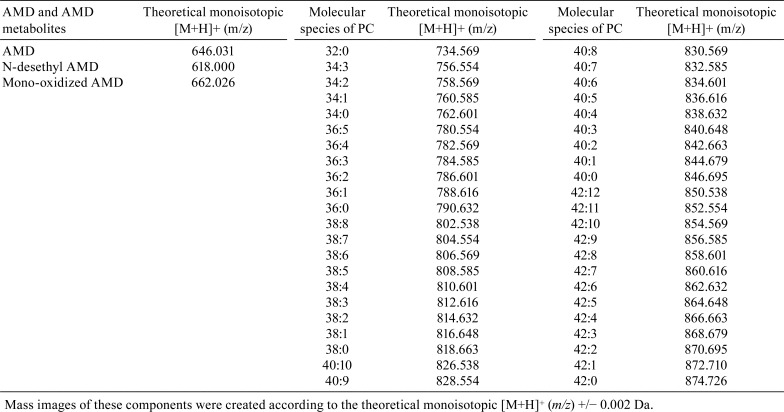
Before IMS analyses, the lung and spleen were homogenized to measure the concentration of AMD and the relative quantity of its metabolites (N-desethyl AMD and mono-oxidized AMD) using LC-MS according to previously described protocols with minor modifications14. The IMS samples were analyzed using an AP-SMALDI IMS system (AP-SMALDI10, TransMIT GmbH, Giessen, Germany) coupled to an orbital trapping mass spectrometer (Q Exactive, Thermo Fisher Scientific GmbH, Bremen, Germany). Data acquisition was performed under the following conditions: positive mode over a mass range of m/z 250–1,000, high mass-resolution mode (140,000 at m/z 200), and 30-μm optical resolution (30 μm/pixel). Mass images of AMD, its metabolites, and PCs were generated using the Million ver. 3.2 software (TransMIT GmbH, Giessen, Germany) according to the theoretical [M+H]+m/z for each molecule (Table 1). All mass images were normalized by the total ion current per pixel.
Table 1. Theoretical Monoisotopic [m+h]+ (m/z) of AMD, its Metabolites, and Analyzed PCs.
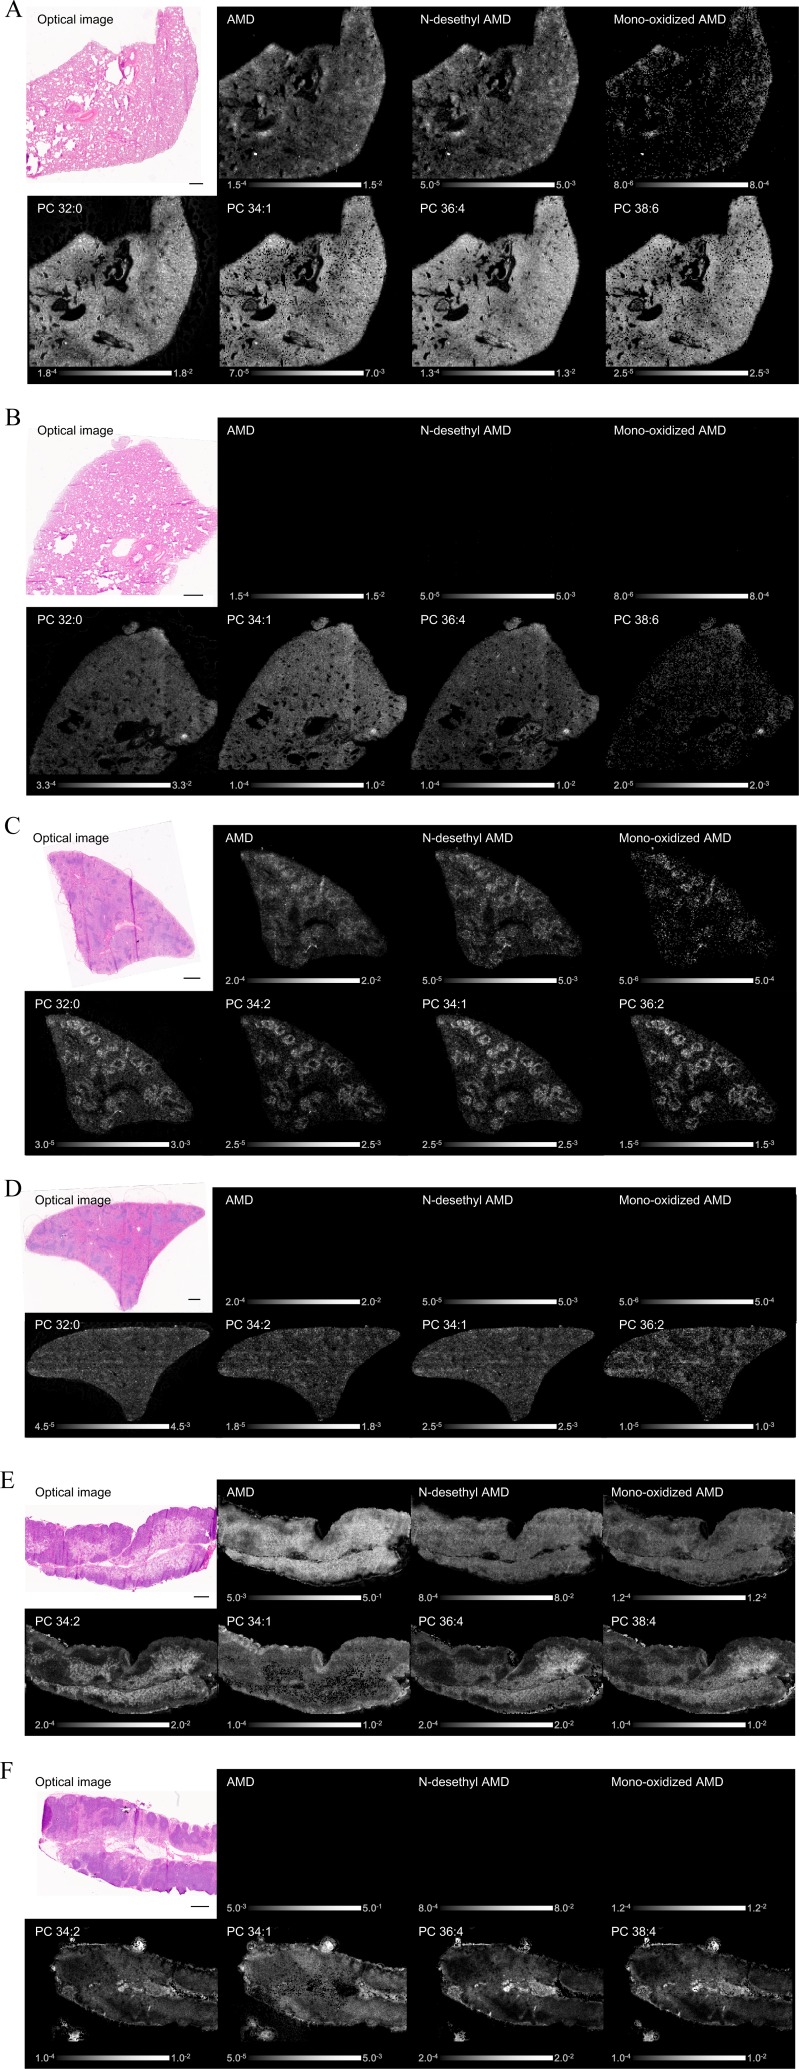
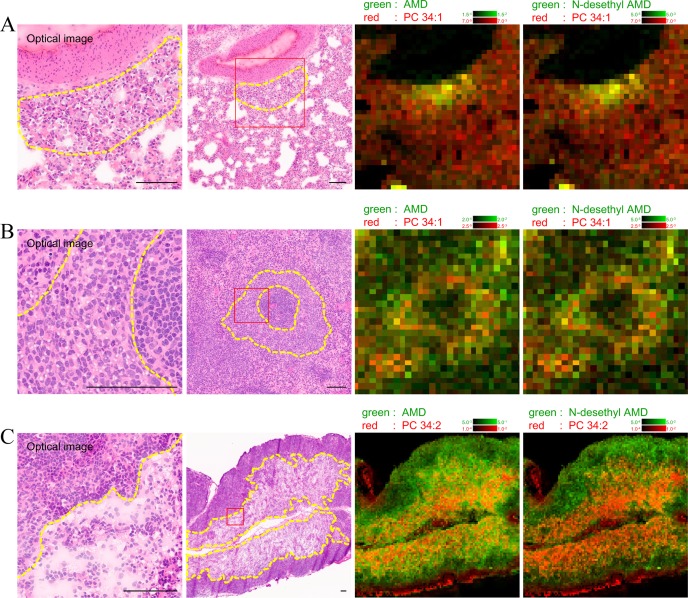
LC-MS analyses were conducted to evaluate the AMD concentration and relative quantity of its metabolites (N-desethyl AMD and mono-oxidized AMD) in tissues. The molecules were present at high concentrations in the lung and spleen samples collected from AMD-administered rat (Table 2). IMS analyses were also conducted to evaluate the distribution of AMD, its metabolites (N-desethyl AMD and mono-oxidized AMD), and PCs in tissues. These molecules were detected in the lung, spleen, and mesenteric lymph node samples collected from AMD-administered rat (Fig. 1A, C, and E). In contrast, AMD and its metabolites were not detected in vehicle-administered rat, and PCs were distributed evenly in general (Fig. 1B, D, and F). For the spleen, the distribution pattern of PCs markedly differed between AMD-administered rat and vehicle-administered rat (Fig. 1C and D). For AMD-administered rat, there was clear localization of AMD, its metabolites, and PCs in the marginal zone of the spleen (Fig. 1C). In the lung and mesenteric lymph node isolated after AMD treatment, AMD, its metabolites, and PCs had a similar distribution, with localization around blood vessels and bronchi and under the pleura (Fig. 1A) and in the medullary sinus of mesenteric lymph node (Fig. 1E). Consistent with the distribution seen in the organs examined by IMS, histological examination of the sequential frozen sections prepared from the AMD-administered rat showed accumulation of i) foamy macrophages in the alveoli mainly around blood vessels and bronchi and under the pleura of the lung, ii) foamy macrophages and vacuolated lymphocytes in the marginal zone of the spleen, and iii) foamy macrophages mainly in the medullary sinus of the mesenteric lymph node (Fig. 2). In these areas, the detection intensities for AMD, N-desethyl AMD, and representative PC species were relatively higher than in the normal areas (Fig. 2).
Table 2. LC-MS Measurement of the AMD Concentration and Relative Quantity of its Metabolites.
Fig. 1.
IMS analysis of the lung (A, B), spleen (C, D), and mesenteric lymph node (E, F). In AMD-administered rat, AMD, its metabolites (N-desethyl AMD and mono-oxidized AMD), and PCs were detected in all three organs (A, C, E). In vehicle-administered rat, AMD and its metabolites were not detected, and PCs were distributed evenly in general in all the organs (B, D, F). For the spleen, the distribution pattern of PCs markedly differed between AMD-administered rat and vehicle-administered rat. For AMD-treated rat, there was clear localization of AMD, its metabolites, and PCs in the marginal zone of the spleen (C, D). The Detection intensity showed a characteristic localized pattern. Optical image (HE staining) and IMS image. Scale bar = 600 μm.
Fig. 2.
Comparison between light microscopy and IMS analysis in the lung (A), spleen (B), and mesenteric lymph node (C) of AMD-administered rat. The images are taken from the same lesion area. The left optical images are magnified images of the right optical images (red lined square). The detection intensity of AMD, N-desethyl AMD, and representative PCs (PC 34:2 and 34:1) was relatively higher in the lesion areas where foamy macrophages and/or vacuolated lymphocytes accumulated (yellow dotted outline) compared with normal areas. Optical image (HE staining) and IMS image. Scale bar = 100 μm.
In this study, IMS analysis revealed that the localization of AMD and its metabolites was associated with the affected cells/regions in the tissue. It also revealed that the distribution pattern of PCs corresponded to the distribution of histological lesions, and the trend was especially evident in the spleen. These results suggest that AMD and its metabolites accumulate in foamy macrophages and vacuolated lymphocytes, and their localizations were associated with phospholipids in lysosomes. These results are consistent with the known mechanism of AMD-induced phospholipidosis.
Although the detection sensitivity of IMS is lower than that of LC-MS, its capabilities are advancing rapidly. The strength of IMS is that no labelling is required, and the technique allows concurrent analyses of the detailed localization of multiple molecules or components in tissues. IMS can provide insight and contribute to understanding the mechanisms of organ toxicity. It will become a more powerful technique for discussing nonclinical safety in drug development.
Disclosure of Potential Conflicts of Interest
The authors declare that there are no conflicts of interest.
Acknowledgments
The authors are grateful to Manami Miyake for providing samples and to Takatomo Kawamukai from the AMR Incorporated for providing useful information concerning IMS system maintenance.
References
- 1.Karlsson O, and Hanrieder J. Imaging mass spectrometry in drug development and toxicology. Arch Toxicol. 91: 2283–2294. 2017. [DOI] [PMC free article] [PubMed] [Google Scholar]
- 2.Groseclose MR, Laffan SB, Frazier KS, Hughes-Earle A, and Castellino S. Imaging MS in Toxicology: An Investigation of Juvenile Rat Nephrotoxicity Associated with Dabrafenib Administration. J Am Soc Mass Spectrom. 26: 887–898. 2015. [DOI] [PMC free article] [PubMed] [Google Scholar]
- 3.Bruinen AL, van Oevelen C, Eijkel GB, Van Heerden M, Cuyckens F, and Heeren RM. Mass Spectrometry Imaging of Drug Related Crystal-Like Structures in Formalin-Fixed Frozen and Paraffin-Embedded Rabbit Kidney Tissue Sections. J Am Soc Mass Spectrom. 27: 117–123. 2016. [DOI] [PMC free article] [PubMed] [Google Scholar]
- 4.Stoeckli M, Chaurand P, Hallahan DE, and Caprioli RM. Imaging mass spectrometry: a new technology for the analysis of protein expression in mammalian tissues. Nat Med. 7: 493–496. 2001. [DOI] [PubMed] [Google Scholar]
- 5.McDonnell LA, and Heeren RM. Imaging mass spectrometry. Mass Spectrom Rev. 26: 606–643. 2007. [DOI] [PubMed] [Google Scholar]
- 6.Norris JL, and Caprioli RM. Analysis of tissue specimens by matrix-assisted laser desorption/ionization imaging mass spectrometry in biological and clinical research. Chem Rev. 113: 2309–2342. 2013. [DOI] [PMC free article] [PubMed] [Google Scholar]
- 7.Maronpot RR, Nyska A, Troth SP, Gabrielson K, Sysa-Shah P, Kalchenko V, Kuznetsov Y, Harmelin A, Schiffenbauer YS, Bonnel D, Stauber J, and Ramot Y. Regulatory Forum Opinion Piece*: Imaging Applications in Toxicologic Pathology-Recommendations for Use in Regulated Nonclinical Toxicity Studies. Toxicol Pathol. 45: 444–471. 2017. [DOI] [PubMed] [Google Scholar]
- 8.Halliwell WH. Cationic amphiphilic drug-induced phospholipidosis. Toxicol Pathol. 25: 53–60. 1997. [DOI] [PubMed] [Google Scholar]
- 9.Nonoyama T, and Fukuda R. Drug-induced phospholipidosis: pathological aspects and its prediction. J Toxicol Pathol. 21: 9–24. 2008. [Google Scholar]
- 10.Adams PC, Holt DW, Storey GC, Morley AR, Callaghan J, and Campbell RW. Amiodarone and its desethyl metabolite: tissue distribution and morphologic changes during long-term therapy. Circulation. 72: 1064–1075. 1985. [DOI] [PubMed] [Google Scholar]
- 11.Kannan R, Sarma JS, Guha M, and Venkataraman K. Amiodarone toxicity. II. Desethylamiodarone-induced phospholipidosis and ultrastructural changes during repeated administration in rats. Fundam Appl Toxicol. 16: 103–109. 1991. [DOI] [PubMed] [Google Scholar]
- 12.Mortuza GB, Neville WA, Delaney J, Waterfield CJ, and Camilleri P. Characterisation of a potential biomarker of phospholipidosis from amiodarone-treated rats. Biochim Biophys Acta. 1631: 136–146. 2003. [DOI] [PubMed] [Google Scholar]
- 13.Baronas ET, Lee JW, Alden C, and Hsieh FY. Biomarkers to monitor drug-induced phospholipidosis. Toxicol Appl Pharmacol. 218: 72–78. 2007. [DOI] [PubMed] [Google Scholar]
- 14.Sanoh S, Yamachika Y, Tamura Y, Kotake Y, Yoshizane Y, Ishida Y, Tateno C, and Ohta S. Assessment of amiodarone-induced phospholipidosis in chimeric mice with a humanized liver. J Toxicol Sci. 42: 589–596. 2017. [DOI] [PubMed] [Google Scholar]
- 15.Sato H, Kashimura A, Hashimoto Y, Kaji H, Yamamoto T, Nishikawa S, Fujiki K, and Tanaka M. Application of high-resolution imaging mass spectrometry to toxicity assessment. The 32th annual meeting of the Japanese Society of Toxicologic Pathology. Kagawa. 2016.


