Significance
Wildfires are a major source of fine particulate matter (diameter <2.5 µm; PM2.5), which is a health hazard. Since the mid-1980s, the total US area burned by wildfires has been increasing, with fires in the Northwest United States accounting for ∼50–60% of that increase. In the Northwest United States, we find a positive trend in the 98th quantile of PM2.5 in contrast to other areas of the country where PM2.5 is decreasing. This positive trend in PM2.5 is closely associated with total carbon (a marker of wildfire emissions). These results support model predictions of increasing wildfire occurrence and PM2.5 in a warming world.
Keywords: PM2.5, wildfires, particulate matter, Kriging, Quantile Regression
Abstract
Using data from rural monitoring sites across the contiguous United States, we evaluated fine particulate matter (PM2.5) trends for 1988–2016. We calculate trends in the policy-relevant 98th quantile of PM2.5 using Quantile Regression. We use Kriging and Gaussian Geostatistical Simulations to interpolate trends between observed data points. Overall, we found positive trends in 98th quantile PM2.5 at sites within the Northwest United States (average 0.21 ± 0.12 µg·m−3·y−1; ±95% confidence interval). This was in contrast with sites throughout the rest of country, which showed a negative trend in 98th quantile PM2.5, likely due to reductions in anthropogenic emissions (average −0.66 ± 0.10 µg·m−3·y−1). The positive trend in 98th quantile PM2.5 is due to wildfire activity and was supported by positive trends in total carbon and no trend in sulfate across the Northwest. We also evaluated daily moderate resolution imaging spectroradiometer (MODIS) aerosol optical depth (AOD) for 2002–2017 throughout the United States to compare with ground-based trends. For both Interagency Monitoring of Protected Visual Environments (IMPROVE) PM2.5 and MODIS AOD datasets, we found positive 98th quantile trends in the Northwest (1.77 ± 0.68% and 2.12 ± 0.81% per year, respectively) through 2016. The trend in Northwest AOD is even greater if data for the high-fire year of 2017 are included. These results indicate a decrease in PM2.5 over most of the country but a positive trend in the 98th quantile PM2.5 across the Northwest due to wildfires.
Fine particulate matter (diameter <2.5 µm; PM2.5) is shown to have significant adverse effects on human health, with direct links to pulmonary and cardiovascular emergencies (1–3). To combat these issues, the Clean Air Act requires the US Environmental Protection Agency (EPA) to set National Ambient Air Quality Standards (NAAQS). The current NAAQS for PM2.5 is set for both maximum 24-h (98th percentile, averaged over 3 y >35 µg/m3) and yearly (annual mean, averaged over 3 y >12.0 µg/m3) averages. On average, PM2.5 has been decreasing nationally (42% decrease for 2000–2016) (4). Although many urban areas still exceed the NAAQS, the overall decrease in PM2.5 is a direct result of a reduction in anthropogenic emissions.
Wildfires are a significant source of PM2.5. Since the mid-1980s, there has been an increase in the frequency and duration of large fires (defined as >400 ha) along with longer wildfire seasons in the Northwest United States (5). This increase in wildfire season and extent has been linked with changes in forest management practices and climatological factors such as increased spring/summer temperatures, earlier snowmelt, and moisture deficits (5–11). In the Northern Rockies and Pacific Northwest regions, large fires for 1984–2011 have been increasing at a rate of 0.6–1.0 per year (7). Additionally, Westerling et al. (5) and Westerling (12) estimate that wildfires in the Northern Rockies alone have contributed 50–60% of the increase in large fires across the western United States for 1970–2016. Recently, Abatzoglou and Williams (13) concluded that anthropogenic climate change has doubled the cumulative wildfire area burned during 1984–2015 in the western United States (14). This suggests that a significant portion of wildfire emissions are due to anthropogenic factors including climate change and direct ignition (15). Several studies have also modeled wildfire probability and extent as well as associated PM and organic carbon (OC) through the end of the century (16–19). These studies found an increased probability of wildfires (16, 19) with a coupled increase in summertime PM2.5 that could offset the reduction in anthropogenic PM2.5 emissions in the western United States (17).
Due to the episodic nature of wildfires, quantifying trends in PM from wildfires is difficult. PM2.5 concentrations during high wildfire years are approximately two times the average summer concentrations (20). In urban areas, it can be difficult to separate the contribution to PM2.5 from natural and anthropogenic sources. To resolve this issue, we use data from the Interagency Monitoring of Protected Visual Environments (IMPROVE) network. Sites within this network are largely in national forests and parks, with less direct influence from urban sources. A previous study using this dataset concluded that although wildfires appeared to be a major contributor to particulate organic matter in rural areas, most long-term trends (1989–2008) in the 90th percentile of PM were either low or negative across the western United States (21). However, Rose (22) analyzed smoke concentrations at six western US IMPROVE sites in the last few decades and found that the (>90th) high percentile concentrations in the last decade are significantly larger than in the late 1990s.
Given the evidence of increasing wildfires and health effects of PM, the goals of this analysis are as follows: (i) compare the 98th quantile PM2.5 trends in the Northwest United States with the rest of the country; (ii) identify how concentrations of PM2.5 are changing in the Northwest United States; and (iii) determine how markers for wildfire and anthropogenic pollution vary with observed PM2.5 trends. To accomplish these goals, we aggregate IMPROVE data for 1988–2016 across the contiguous United States and Ontario, Canada. We use IMPROVE particulate total carbon (TC) and sulfate (SO4) as markers for wildfire and anthropogenic pollution, respectively. We also use satellite measured aerosol optical depth (AOD) data for 2002–2017.
Results and Discussion
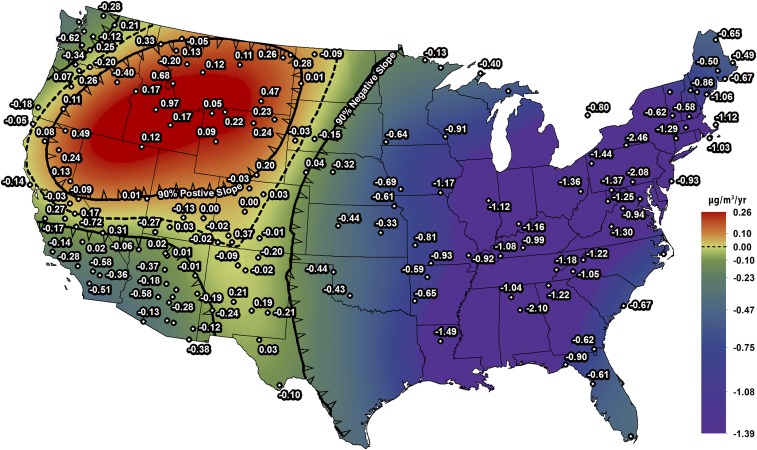
Fig. 1 shows the trends in PM2.5 for 1988–2016 at IMPROVE sites across the contiguous United States and Ontario. Observational trend data are shown by dots with corresponding values in µg·m−3·y−1. These trends are calculated at the 98th quantile using Quantile Regression (QR). Not all trend values are shown for readability, but the complete list can be found in SI Appendix, Table S1. The trends at individual sites are highly variable in wildfire-prone areas due to the location of wildfires, varying plume transport patterns, and the length of data records. Kriging provides a spatial smoothing of trends, but there are multiple approaches. The interpolated color ramp values (µg·m−3·y−1) are drawn by Kriging observational data. The percentage Krige (solid black lines with triangles indicating direction) shows the boundary where Krige-interpolated PM2.5 trends within have either a 90% probability of being positive or a 90% probability of being negative over that region. At IMPROVE sites within the 90% positive trend region, the increase in the observed 98th quantile PM2.5 per year is up to 0.97 ± 0.22 µg·m−3·y−1 at Sawtooth National Forest, with an average of 0.21 ± 0.12 µg·m−3·y−1 (n = 23). We also use Gaussian Geostatistical Simulations (GGS) to examine the spatial pattern when trend errors are incorporated into the final Krige product. This result is shown in SI Appendix, Fig. S1A. Comparing Fig. 1 to the corresponding GGS plot in SI Appendix, Fig. S1A, we find that although the Krige-predicted maximum trend in the Northwest decreases slightly, the positive trend region is very similar when trend uncertainty is included. In addition, the SE Krige prediction map (SI Appendix, Fig. S1B) indicates a low uncertainty in Krige trends in the Northwest and, therefore, a robust interpolated trend. The increase in high-quantile Northwest PM2.5 is consistent with previous work showing an increase in organic aerosol correlated with fire area in the Rocky Mountain region (23). Our analysis implies that most areas within the Northwest, with the exception of the Seattle–Portland urban corridor, show a positive trend in the 98th quantile PM2.5 due to wildfire influence. It is assumed that the Seattle–Portland corridor is more directly affected by decreasing anthropogenic emissions.
Fig. 1.
The 98th Quantile Regression of PM2.5 trends. Observed PM trends for 1988–2016 (calculated using QR methods) from IMPROVE sites are shown by black dots with corresponding values in µg·m−3·y−1. Krige-interpolated values (calculated from observed data) are shown by the color ramp. Solid black lines with arrows (indicating direction) show the boundary where the Krige-interpolated PM2.5 trends within have a 90% probability of being positive or negative. Of the 157 sites, 92 show statistical significance (8 positive/84 negative).
In contrast, the rest of the United States shows a predominately negative trend in 98th quantile PM2.5. This is supported by the 90% negative trend region, which shows that much of the rest of the United States is within the region of decreasing PM2.5 (average 98th quantile trend of −0.66 ± 0.10 µg·m−3·y−1; n = 89). This result is consistent with reductions in PM2.5 precursor gases (e.g., SO2) across the United States (24, 25).
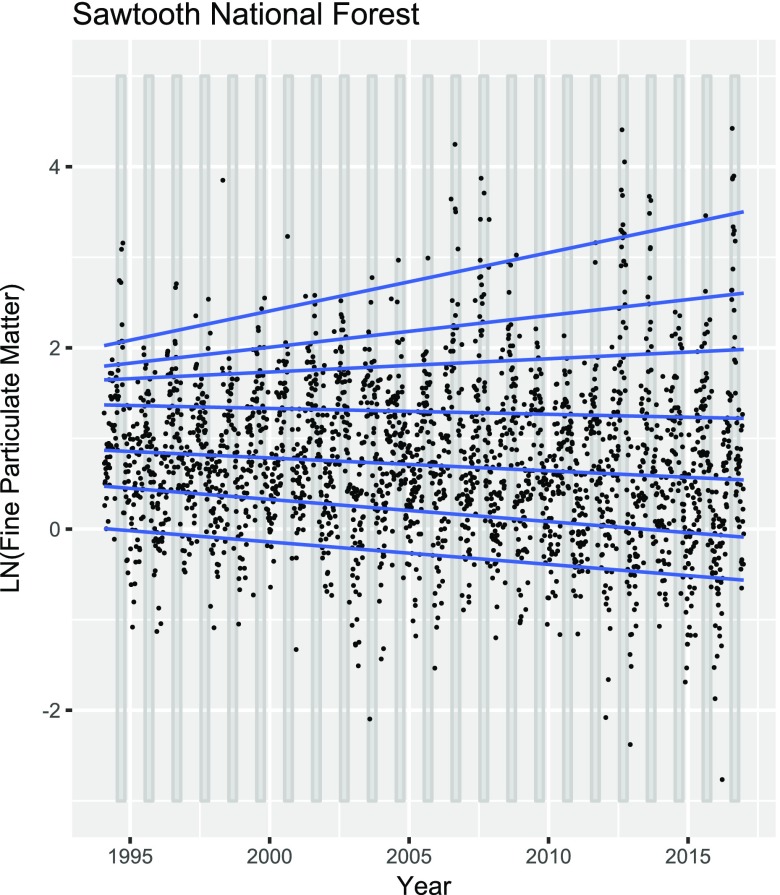
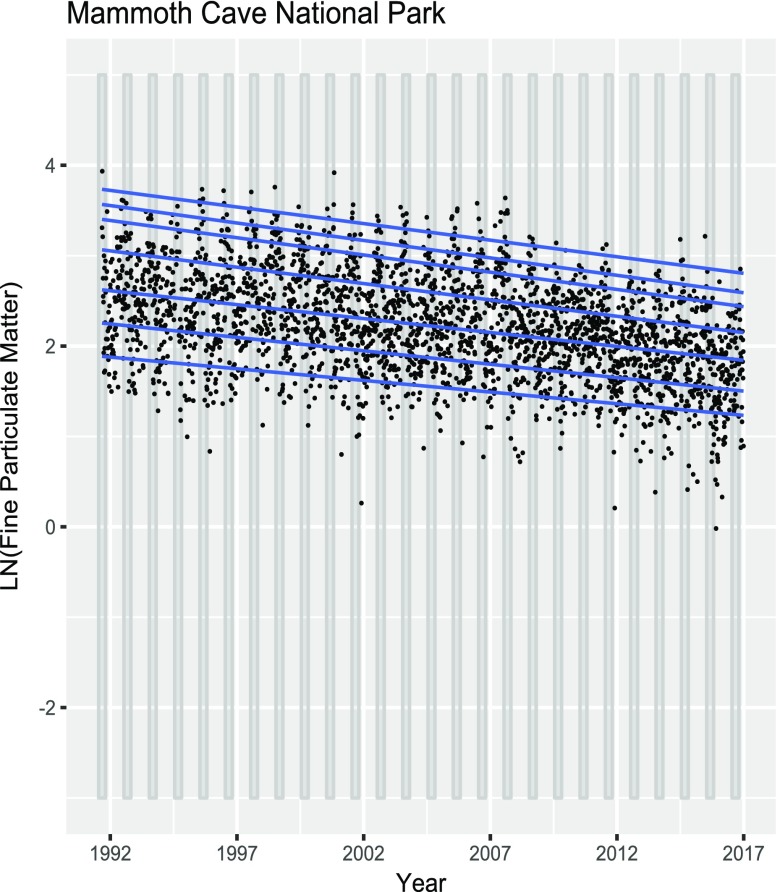
Looking closely at two sites, one in the Northwest and one in the eastern United States, we can identify the effects of decreasing anthropogenic pollution and increasing wildfires. In Fig. 2, we have plotted log-transformed PM2.5 data from the Sawtooth National Forest, Idaho. Observed PM data are shown by black circles. Gray vertical bars indicate the summer wildfire season. It is clear that most high PM2.5 events are occurring in the summer. Using QR analysis, we identify changes in different quantiles of these data. These trends, calculated by QR, are shown by solid blue lines at the 10th, 25th, 50th, 75th, 90th, 95th, and 98th quantiles. At this site, the lower quantiles of the PM2.5 distribution are uniformly decreasing, consistent with a reduction in anthropogenic emissions. At higher quantiles (>90th), we see a positive trend in extreme PM2.5 events. Specifically, at the 98th quantile, we see a positive PM2.5 trend of 6.7 ± 1.1% per year. Variations in the high- and low-quantile slopes suggest one mechanism causing a decrease at low-PM2.5 quantiles and a different mechanism causing the increase in high quantiles, which we suggest to be anthropogenic reduction and wildfire influence, respectively. In contrast, Fig. 3 shows a characteristic eastern US site, Mammoth Cave National Park, Kentucky. In this example, all quantiles are decreasing uniformly, with a 98th quantile trend of −3.6 ± 0.4% per year, suggesting a single mechanism is responsible. These decreases are indicative of a site that is predominately affected by anthropogenic pollution, which has benefitted from a reduction in anthropogenic emissions. Using QR analyses, these sites show two different regimes for PM2.5 trends. In the Northwest, we conclude an increase in extreme PM events (seen primarily during summer) is due to wildfire emissions; in the eastern United States, we see a decrease in PM at all quantiles due to a reduction in anthropogenic emissions.
Fig. 2.
Sawtooth National Forest PM2.5 data. Log-transformed PM2.5 data for 1994–2016 are shown by black circles. The gray shading indicates the summer season. Solid blue lines denote quantile regression of PM data at the 10th, 25th, 50th, 75th, 90th, 95th, and 98th quantiles (lowest to highest line).
Fig. 3.
Mammoth Cave National Park PM2.5 data. Log-transformed PM2.5 data for 1991–2016 are shown by black circles. The gray shading indicates the summer season. Solid blue lines denote quantile regression of PM data at the 10th, 25th, 50th, 75th, 90th, 95th, and 98th quantiles (lowest to highest line).
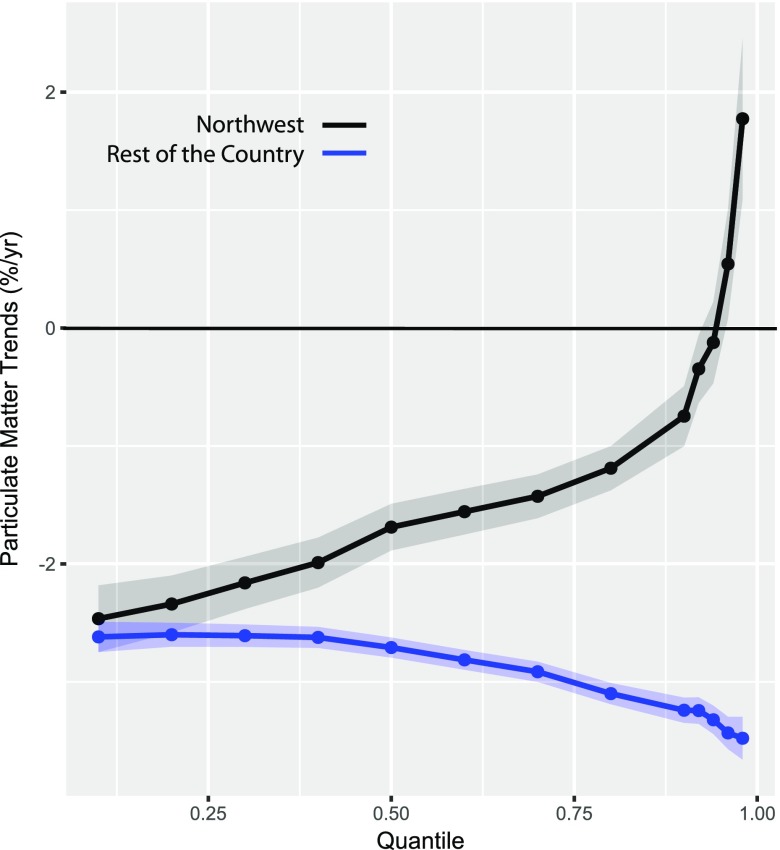
Fig. 4 shows average QR values at sites in the Northwest (black) and the rest of the United States (blue). These regions are defined as the area within the 90% positive and negative boundaries from Fig. 1, respectively. Trend SE from each site is pooled by region and incorporated into the 95% confidence interval shading shown in Fig. 4. Trends at 94th quantile and below are decreasing for the Northwest and the rest of the United States. However, at the high quantiles (e.g., 98th quantile), PM is increasing in the Northwest (1.77 ± 0.68% per year) compared with the rest of the country (−3.48 ± 0.18% per year). This analysis confirms our previous case studies, indicating an increase in high-quantile PM2.5 trends in the Northwest and a decrease in all PM quantiles in the rest of the country.
Fig. 4.
Quantile regression trends. The black and blue dotted lines indicate the trend in PM2.5 across quantiles from 0.10 (10th) to 0.98 (98th) for the Northwest United States (n = 23) and the rest of the country (n = 89), respectively. Shading indicates the 95% CI from the average trend. From 0.10 to 0.90, intervals of 0.10 are chosen, and from quantile 0.90–0.98, intervals of 0.02 are chosen.
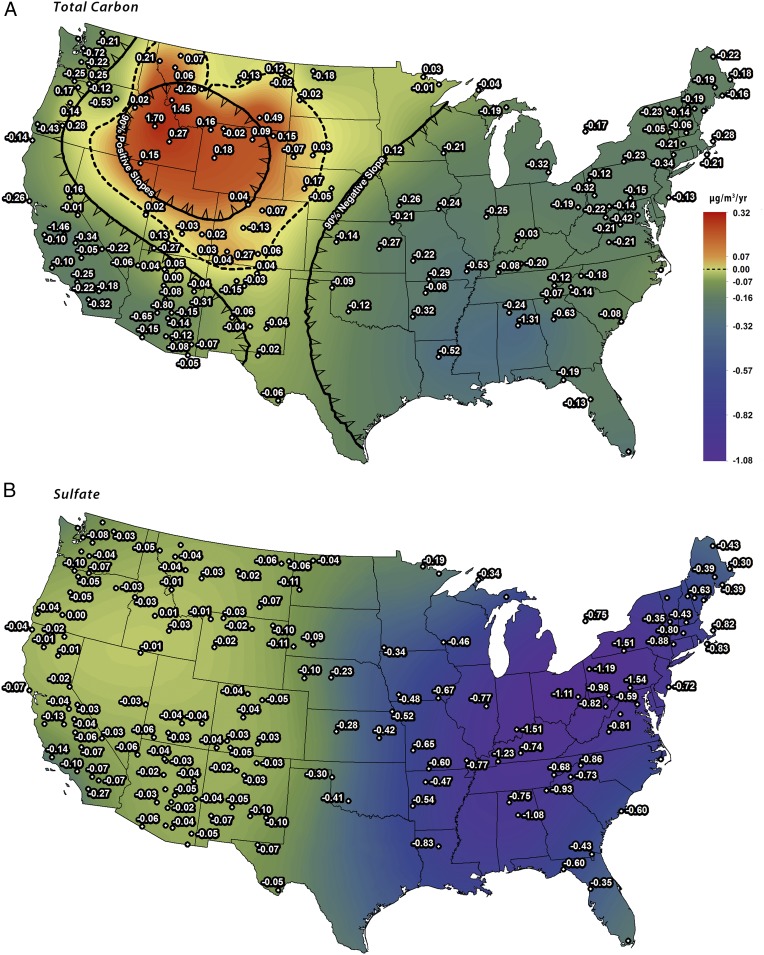
In Fig. 5, we plot trends in TC and SO4, respectively. Observed trends, Krige trend interpolation, and the Krige probability regions are plotted in the same manner as Fig. 1. The GGS and SE plots for both TC and SO4 are shown in SI Appendix, Figs. S2 and S3. TC and SO4 GGS plots show similar results compared with Fig. 5, suggesting robust spatially interpolated trends. We use TC as a marker for wildfire emissions because wildfire PM is comprised of up to 80% OC (26, 27). SO4 aerosol from SO2 emissions is a standard indicator of anthropogenic pollution (25). However, since SO4 has been decreasing significantly (24, 25, 28), it is no longer the dominate component of PM2.5 in the eastern United States (24). In Fig. 5A, the TC trend within the 90% positive trend region corresponds well with Fig. 1, confirming wildfire influence in the same area as positive 98th quantile PM2.5 trends. These TC trends are consistent with previous work by Spracklen et al. (29) and Hallar et al. (23). Across the rest of the United States, we observe zero or negative trends in TC, suggesting a smaller, decreasing influence from emission sources. This decrease in TC across the rest of the United States is consistent with previous work by Blanchard et al. (28). We considered whether these TC and PM2.5 trends could be due to increasing biogenic emissions associated with warmer temperatures. This hypothesis was rejected because increases in biogenic emissions would result in a broad increase of TC and PM2.5 distributions. Instead, our analysis shows an increase at the high quantiles of these distributions.
Fig. 5.
TC and SO4 98th quantile trends. Observed 98th quantile TC (Top) and SO4 (Bottom) trends (calculated using QR methods) from IMPROVE sites for 1988–2016 are shown by black dots with corresponding values in µg·m−3·y−1. Krige-interpolated values (calculated from observed data) are shown by the color ramp. In A, the solid black lines with arrows (indicating direction) show the boundary where 90% of the Krige-interpolated TC trends within are positive or negative. Of the 149 sites, 73 show statistical significance. In B, all regions are within the 90% negative slope estimation. Of the 156 sites, 145 show statistical significance.
In Fig. 5B, we see significantly decreasing SO4 in the eastern United States due to a reduction in SO2 emissions from power plants (25). We also notice that SO4 trends in the western United States are less than zero. This suggests that SO4 in the Northwest is not contributing to the observed positive trend in PM2.5.
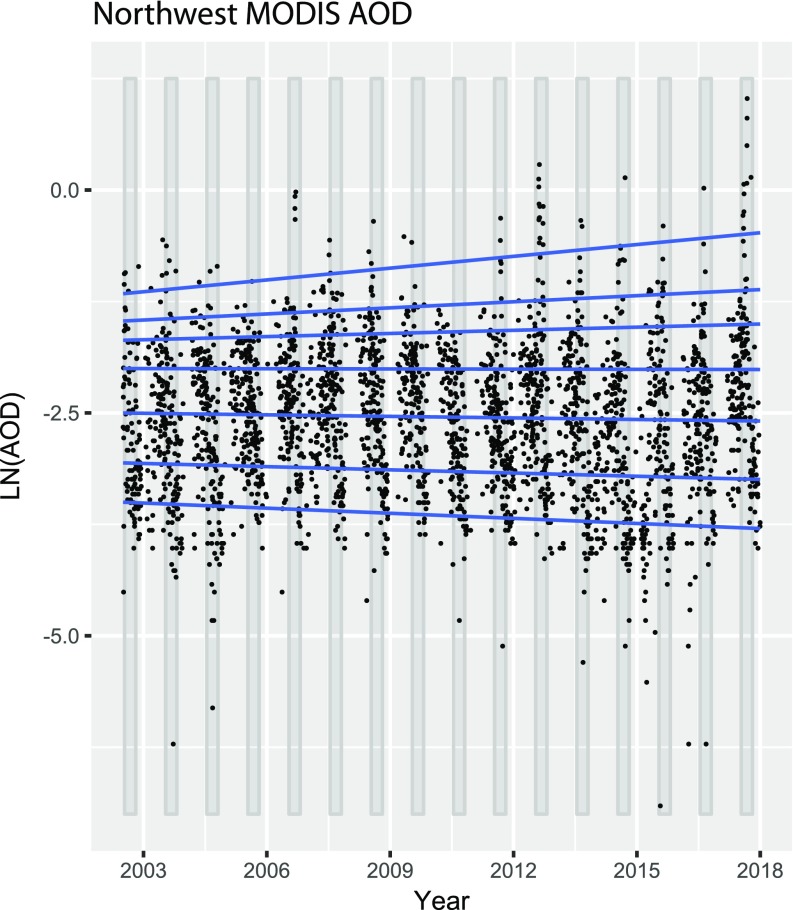
To compare with ground-based observations, we use the same Krige methodology on moderate resolution imaging spectroradiometer (MODIS) Aqua AOD data for 2002–2017 over the United States. It is important to note that AOD data will show aerosols in the full atmospheric column, not just at the surface. SI Appendix, Fig. S4 shows the 98th quantile of AOD across the United States. The GGS and SE plots for the MODIS AOD data are shown in SI Appendix, Fig. S5. Areas of positive trends in AOD approximately correspond with the area in Figs. 1 and 5A. The MODIS and IMPROVE Krige products should not exactly match because MODIS AOD values show aerosols in the full atmospheric column and are more impacted by transport, whereas the IMPROVE PM values should mostly be impacted by regional or local sources. The MODIS Krige product is similar in extent to the smoke spatial distribution reported by Kaulfus et al. (30). The extent of their smoke product extends further east than our Krige product, likely due to our focus on the highest (98th quantile) AOD values, while their spatial distribution is derived from a (simpler) smoke or no smoke criteria. Using boundaries at 42° N and 108° W to separate the Northwest from the rest of the United States, we find a 2002–2017 average 98th quantile AOD trend of 5.01 ± 0.98% per year for the Northwest and −0.92 ± 0.55% per year for the rest of the county. Since 2017 was an especially high-fire year in the Northwest, these trends are significantly higher than the IMPROVE trends for 1988–2016. Fig. 6 shows QR analysis of a representative MODIS grid box in the Northwest with 2017 showing the highest AOD. This grid box corresponds to Sawtooth National Forest (Fig. 2) and shows a 98th quantile PM2.5 trend of 4.5 ± 1.8% per year for 2002–2017 (2.6 ± 1.8% per year for 2002–2016). For the entire Northwest region, we calculate 2002–2016 average 98th quantile AOD trends of 2.12 ± 0.81% per year and −1.20 ± 0.51% per year for the rest of the county, which is similar to the IMPROVE results shown in Fig. 4.
Fig. 6.
Northwest MODIS AOD site. Log-transformed AOD data for 2002–2017 are shown by black circles. The gray shading indicates the summer season. Solid blue lines denote quantile regression of PM data at the 10th, 25th, 50th, 75th, 90th, 95th, and 98th quantiles (lowest to highest line). This grid box (43.87°N, 114.91°W) is directly over Sawtooth National Forest, ID (Fig. 2).
Conclusions
Based on the analysis of PM2.5 at IMPROVE sites across the contiguous United States and Ontario, we find a positive trend in the 98th quantile of PM2.5 in the Northwest and a negative trend in most other areas. We investigate anthropogenic influences and find negative trends in SO4 across the entire United States. We attribute the increase in PM2.5 in the Northwest to wildfires based on the similarly positive trends in TC and MODIS AOD. Due to the significant difference in 98th quantile PM2.5 trends between the Northwest and the rest of the country, we are confident in our analysis of separate mechanisms affecting each region. Ultimately, we conclude that wildfires are causing the increase in PM2.5 at the 98th quantile in the Northwest. While areas within the Northwest are generally below the EPA PM2.5 standards, we show that wildfires are causing a significant effect on high-quantile PM2.5 that could offset anthropogenic reductions as suggested by Val Martin et al. (17). This result has important implications for wildfire-prone regions in the Northwest and supports model predictions of increasing wildfires and PM2.5 in a warming world.
Methods
Data.
The IMPROVE network has monitored PM mass and chemical composition at over 200 sites since 1987. PM filter samples are collected at each site for 24 h every 3 d. We selected the 160 sites within the contiguous United States and Ontario, Canada, with greater than 10 y of data (views.cira.colostate.edu/fed/DataWizard/Default.aspx). We use fine particulate matter (MF), total fine organic carbon (OCf), total fine elemental carbon (ECf), and fine SO4 (SO4f) from these datasets. We calculate TC as [(OCf × 1.8) + ECf] to determine trends in TC and avoid carbon trend uncertainties noted by Hand et al. (21). For TC analysis, we omitted 10 sites where OC was at least 5 µg/m3 and 20% greater than MF at the 98th percentile for 2 or more years. These sites are removed from the TC plot in Fig. 5A to avoid bias from unrealistic OC mass values in the overall trends. SI Appendix, Table S1 provides the list of IMPROVE sites used, along with years of data, coordinates, calculated trends, and error estimates of those trends.
MODIS Aqua 1° × 1° Daily Averaged data (MYD08_D3) for 2002–2017 were retrieved from the NASA Earth Data Level-1 and Atmospheric Archive & Distribution System Distributed Active Archive Center (LAADS DAAC) website (https://ladsweb.modaps.eosdis.nasa.gov/). We used the “AOD 550 nm Dark Target/Deep Blue Combined Mean” dataset. To calculate the 95% confidence intervals for MODIS data, we assume values are independent at 2.5° × 2.5° intervals.
Statistical Methods.
To model the change in extreme events at IMPROVE sites and in MODIS data, we use QR (R package “quantreg”) (31). While ordinary least squares (OLS) regressions use symmetric weighting to regress data, this may not describe the full dataset if there are significant outliers or the data have heterogeneous variance. This is especially important in our analysis given the high variability in PM2.5 due to high- and low-wildfire years. By focusing only on changes in the distribution mean, we may over- or underestimate the real changes in a heterogeneous distribution. QR was developed by Koenker and Basset (32) to estimate rates of change across the full range of a distribution by applying asymmetric weighting at different quantiles to regress data (33, 34). This approach does not subset data into quantiles but instead regresses the full dataset at a specific quantile (35). We use QR at all sites to focus on variability in data extremes for the 10th–98th quantiles. QR analyses use all data points (daily data, not subset by year) to calculate quantile regressions. Each QR trend estimate includes a SE and P value used to evaluate uncertainty and statistical significance, respectively. Individual trend values listed in the text are reported with ±SE. Averaged trend values are listed with a ±95% confidence interval.
Trend estimates are considered statistically significant if the QR analysis returns P < .10. We choose a lower statistical significance threshold in accordance with previous analyses of IMPROVE data (21). We do not remove trend estimates based on statistical significance in our Krige analyses but instead propagate estimated trend errors (using GGS) and include the number of statistically significant values for each figure in the respective caption.
Geospatial Methods—Kriging.
Trend values are interpolated between IMPROVE sites and MODIS grid boxes by Kriging observed data using ArcMap 10.5.1 Geostatistical Analyst Toolbox. Spatial data in decimal degree coordinates are projected using the “USA Contiguous Equidistant Conic” coordinate system, which uses linear units (meters). Conversion to a linear coordinate system is important when Kriging data as interpolations are made based on the precise distance between observed data points. PM2.5, TC, SO4, and AOD data are Kriged using a normal-score transformation to account for nonnormally distributed effects in our dataset. These models are optimized by adjusting maximum and minimum neighbors to reduce the root-mean-square error (RMSE) toward 0 and the standardized RMSE toward 1. SI Appendix, Table S2 shows validation results from 17 different Kriging methodologies and identifies the methodology chosen based on lowest overall error. Krige results can be found in Figs. 1 and 5 and SI Appendix, Fig. S4. To evaluate the influence from heterogeneous trend error estimates (each QR trend estimate has an associated SE), we use the GGS tool on the Krige-interpolated values. We run 500 simulations per figure and show convergence for each aggregated Krige output. The GGS tool calculates a mean Krige raster that incorporates the heterogeneous trend uncertainty into the final interpolated values. We also calculate prediction SE of each Krige to evaluate uncertainty of the interpolated product. GGS and SE plots for each Krige figure can be found in SI Appendix, Figs. S1–S3 and S5. Percentage probability vectors for Krige and GGS products are shown by solid black lines with triangles (indicating direction) in Figs. 1 and 5 and SI Appendix, Figs. S1–S5. Krige probability vectors show the boundary where interpolated PM2.5 trends have a 90% probability of being positive or negative based on the weighted combination of magnitude and binary assignment (i.e., trend values above or below 0) for observed values within the region. GGS probability vectors are drawn based on the boundary where 90% of the Krige-interpolated values inside are calculated to be positive or negative. Note that Kriging and GGS outputs are comprised of interpolated results between all sites and do not strictly contour observed data points.
Supplementary Material
Acknowledgments
We thank Roger Koenker, James Laing, Dee Ann Lommers-Johnson, Santiago Lopez, Beth Tully, and the University of Washington statistics department for their helpful comments and suggestions. The authors thank the three anonymous reviewers for their thoughtful and insightful suggestions, which allowed us to improve this paper. We also acknowledge the IMPROVE program for providing PM mass and chemical composition data throughout North America. Funding for this research was provided by National Science Foundation Grant 1447832 and National Oceanic and Atmospheric Administration Grant NA17OAR431001.
Footnotes
The authors declare no conflict of interest.
This article is a PNAS Direct Submission.
This article contains supporting information online at www.pnas.org/lookup/suppl/doi:10.1073/pnas.1804353115/-/DCSupplemental.
References
- 1.Liu JC, et al. Wildfire-specific fine particulate matter and risk of hospital admissions in urban and rural counties. Epidemiology. 2017;28:77–85. doi: 10.1097/EDE.0000000000000556. [DOI] [PMC free article] [PubMed] [Google Scholar]
- 2.Haikerwal A, et al. Fine particulate matter (PM2.5 ) exposure during a prolonged wildfire period and emergency department visits for asthma. Respirology. 2016;21:88–94. doi: 10.1111/resp.12613. [DOI] [PubMed] [Google Scholar]
- 3.Wegesser TC, Pinkerton KE, Last JA. California wildfires of 2008: Coarse and fine particulate matter toxicity. Environ Health Perspect. 2009;117:893–897. doi: 10.1289/ehp.0800166. [DOI] [PMC free article] [PubMed] [Google Scholar]
- 4.US EPA 2016 Particulate matter (PM2.5) trends. US EPA. Available at https://www.epa.gov/air-trends/particulate-matter-pm25-trends. Accessed September 6, 2017.
- 5.Westerling AL, Hidalgo HG, Cayan DR, Swetnam TW. Warming and earlier spring increase western U.S. forest wildfire activity. Science. 2006;313:940–943. doi: 10.1126/science.1128834. [DOI] [PubMed] [Google Scholar]
- 6.Aldersley A, Murray SJ, Cornell SE. Global and regional analysis of climate and human drivers of wildfire. Sci Total Environ. 2011;409:3472–3481. doi: 10.1016/j.scitotenv.2011.05.032. [DOI] [PubMed] [Google Scholar]
- 7.Dennison PE, Brewer SC, Arnold JD, Moritz MA. Large wildfire trends in the western United States, 1984–2011. Geophys Res Lett. 2014;41:2928–2933. [Google Scholar]
- 8.Kitzberger T, Brown PM, Heyerdahl EK, Swetnam TW, Veblen TT. Contingent Pacific-Atlantic Ocean influence on multicentury wildfire synchrony over western North America. Proc Natl Acad Sci USA. 2007;104:543–548. doi: 10.1073/pnas.0606078104. [DOI] [PMC free article] [PubMed] [Google Scholar]
- 9.Littell JS, McKenzie D, Peterson DL, Westerling AL. Climate and wildfire area burned in western U.S. ecoprovinces, 1916–2003. Ecol Appl. 2009;19:1003–1021. doi: 10.1890/07-1183.1. [DOI] [PubMed] [Google Scholar]
- 10.Miller JD, Safford H. Trends in wildfire severity: 1984 to 2010 in the Sierra Nevada, Modoc plateau, and southern Cascades, California, USA. Fire Ecol. 2012;8:41–57. [Google Scholar]
- 11.Westerling AL, Gershunov A, Brown TJ, Cayan DR, Dettinger MD. Climate and wildfire in the western United States. Bull Am Meteorol Soc. 2003;84:595–604. [Google Scholar]
- 12.Westerling AL. Increasing western US forest wildfire activity: Sensitivity to changes in the timing of spring. Philos Trans R Soc B Biol Sci. 2016;371:20150178. doi: 10.1098/rstb.2015.0178. [DOI] [PMC free article] [PubMed] [Google Scholar]
- 13.Abatzoglou JT, Williams AP. Impact of anthropogenic climate change on wildfire across western US forests. Proc Natl Acad Sci USA. 2016;113:11770–11775. doi: 10.1073/pnas.1607171113. [DOI] [PMC free article] [PubMed] [Google Scholar]
- 14.Harvey BJ. Human-caused climate change is now a key driver of forest fire activity in the western United States. Proc Natl Acad Sci USA. 2016;113:11649–11650. doi: 10.1073/pnas.1612926113. [DOI] [PMC free article] [PubMed] [Google Scholar]
- 15.Balch JK, et al. Human-started wildfires expand the fire niche across the United States. Proc Natl Acad Sci USA. 2017;114:2946–2951. doi: 10.1073/pnas.1617394114. [DOI] [PMC free article] [PubMed] [Google Scholar]
- 16.Moritz MA, et al. Climate change and disruptions to global fire activity. Ecosphere. 2012;3:49. [Google Scholar]
- 17.Val Martin M, et al. How emissions, climate, and land use change will impact mid-century air quality over the United States: A focus on effects at national parks. Atmos Chem Phys. 2015;15:2805–2823. [Google Scholar]
- 18.Spracklen DV, et al. Impacts of climate change from 2000 to 2050 on wildfire activity and carbonaceous aerosol concentrations in the western United States. J Geophys Res Atmos. 2009;114:D20301. [Google Scholar]
- 19.Pechony O, Shindell DT. Driving forces of global wildfires over the past millennium and the forthcoming century. Proc Natl Acad Sci USA. 2010;107:19167–19170. doi: 10.1073/pnas.1003669107. [DOI] [PMC free article] [PubMed] [Google Scholar]
- 20.Jaffe D, Hafner W, Chand D, Westerling A, Spracklen D. Interannual variations in PM2.5 due to wildfires in the Western United States. Environ Sci Technol. 2008;42:2812–2818. doi: 10.1021/es702755v. [DOI] [PubMed] [Google Scholar]
- 21.Hand J, et al. 2011. Spatial and seasonal patterns and temporal variability of haze and its constituents in the United States, IMPROVE Report V (Cooperative Institute for Research in the Atmosphere, Colorado State University, Fort Collins, CO), CIRA Report ISSN 0737-5352.
- 22.Rose KA. 2017 An Assessment of Wildfire Smoke in the Western U.S. National Parks Using IMPROVE Monitoring Data (Environmental Protection Agency, Region 10, Fort Colllins, CO). Available at vista.cira.colostate.edu/improve/Publications/GrayLit/036_Smoke_in_Western_Parks/Wildfire%20Smoke%20Contribution%20in%20Western%20National%20Parks_8-30-17.pdf. Accessed March 7, 2018.
- 23.Hallar AG, et al. Impacts of increasing aridity and wildfires on aerosol loading in the intermountain Western US. Environ Res Lett. 2017;12:014006. [Google Scholar]
- 24.Marais EA, Jacob DJ, Turner JR, Mickley LJ. Evidence of 1991–2013 decrease of biogenic secondary organic aerosol in response to SO2 emission controls. Environ Res Lett. 2017;12:054018. [Google Scholar]
- 25.Hand J, Schichtel B, Malm W, Pitchford M. Particulate sulfate ion concentration and SO 2 emission trends in the United States from the early 1990s through 2010. Atmos Chem Phys. 2012;12:10353–10365. [Google Scholar]
- 26.US EPA 2016 Regional haze guidance technical support document and data file. US EPA. Available at https://www.epa.gov/visibility/regional-haze-guidance-technical-support-document-and-data-file. Accessed September 7, 2017.
- 27.Clarke A, et al. Biomass burning and pollution aerosol over North America: Organic components and their influence on spectral optical properties and humidification response. J Geophys Res Atmos. 2007;112:D12S18. [Google Scholar]
- 28.Blanchard CL, Hidy GM, Shaw S, Baumann K, Edgerton ES. Effects of emission reductions on organic aerosol in the southeastern United States. Atmos Chem Phys. 2016;16:215–238. [Google Scholar]
- 29.Spracklen DV, et al. Wildfires drive interannual variability of organic carbon aerosol in the western U.S. in summer. Geophys Res Lett. 2007;34:L16816. [Google Scholar]
- 30.Kaulfus AS, Nair U, Jaffe D, Christopher SA, Goodrick S. Biomass burning smoke climatology of the United States: Implications for particulate matter air quality. Environ Sci Technol. 2017;51:11731–11741. doi: 10.1021/acs.est.7b03292. [DOI] [PubMed] [Google Scholar]
- 31.Koenker R. 2017 quantreg: Quantile Regression. Available at https://CRAN.R-project.org/package=quantreg. Accessed December 13, 2017.
- 32.Koenker R, Bassett G., Jr Regression quantiles. Econometrica. 1978;46:33–50. [Google Scholar]
- 33.Koenker R. Quantile Regression. Cambridge Univ Press; New York: 2005. [Google Scholar]
- 34.Koenker R, Hallock KF. Quantile regression. J Econ Perspect. 2001;15:143–156. [Google Scholar]
- 35.Lê Cook B, Manning WG. Thinking beyond the mean: A practical guide for using quantile regression methods for health services research. Shanghai Jingshen Yixue. 2013;25:55–59. doi: 10.3969/j.issn.1002-0829.2013.01.011. [DOI] [PMC free article] [PubMed] [Google Scholar]
Associated Data
This section collects any data citations, data availability statements, or supplementary materials included in this article.


