

Abstract
Objective
While depression and anxiety are common mental health issues, only a small segment of the population has access to standard one-on-one treatment. The use of smartphone apps can fill this gap. An app recommender system may help improve user engagement of these apps and eventually symptoms.
Methods
IntelliCare was a suite of apps for depression and anxiety, with a Hub app that provided app recommendations aiming to increase user engagement. This study captured the records of 8057 users of 12 apps. We measured overall engagement and app-specific usage longitudinally by the number of weekly app sessions (“loyalty”) and the number of days with app usage (“regularity”) over 16 weeks. Hub and non-Hub users were compared using zero-inflated Poisson regression for loyalty, linear regression for regularity, and Cox regression for engagement duration. Adjusted analyses were performed in 4561 users for whom we had baseline characteristics. Impact of Hub recommendations was assessed using the same approach.
Results
When compared to non-Hub users in adjusted analyses, Hub users had a lower risk of discontinuing IntelliCare (hazard ratio = 0.67, 95% CI, 0.62-0.71), higher loyalty (2- to 5-fold), and higher regularity (0.1–0.4 day/week greater). Among Hub users, Hub recommendations increased app-specific loyalty and regularity in all 12 apps.
Discussion/Conclusion
Centralized app recommendations increase overall user engagement of the apps, as well as app-specific usage. Further studies relating app usage to symptoms can validate that such a recommender improves clinical benefits and does so at scale.
Keywords: anxiety disorders, depression, mHealth, mobile health
Introduction
Depression and anxiety are common, debilitating, and the cause of enormous misery. While most people who experience depression and anxiety disorders want psychological treatments, 75% of these people experience barriers that prevent access and receive little or no treatment as a result.1,2 Behavioral intervention technologies, which harness mobile and web technologies to deliver psychological treatments, are increasingly argued to be a solution that can extend psychological treatments to more people.3 Computer-based internet interventions, which tend to be primarily psychoeducational covering a broad range of psychological strategies, have consistently shown efficacy. However, these interventions require the user to make time to sit at a computer to read or view videos, and often have low adherence rates.4–6
Preliminary studies show smartphone apps can be effective in reducing symptoms of depression and anxiety.7,8 However, mental health apps pose new design challenges, partly due to how people use their phones. People typically turn to their phones in spare moments and engage in brief bursts of activities to accomplish specific tasks due to resource competition.9,10 Research indicates that people tend to use their phones and phone apps in brief interactions with 70% of interactions <60 s.11 As such, phone apps that require more than a minute or 2 to use, or require complex navigation, are unlikely to be used repeatedly. At the same time, there are a wide variety of psychological strategies such as goal setting, cognitive restructuring, behavioral activation, and positive psychological interventions that can be useful for people with common mental health problems.12 Apps can also differ in terms of interactional elements (e.g., text vs photographic entry, daily tasks vs as needed tasks, etc.).
IntelliCare was based on the notion that people would be better served by a collection of simple apps, each with specific goals, psychological strategies, and simple interactional elements. IntelliCare was designed as a prototype for such a platform, providing users with 12 apps that would instantiate a variety of psychological strategies using several interactional styles to support acquisition of a set of skills related to depression or anxiety. Apps were designed using the Behavioral Intervention Technology Model,13 integrated behavior theory and design, and were optimized through user feedback and usability testing.14,15
While breaking the intervention into its constituent parts fits well with how people use apps, it creates potential navigation problems: how is a user to know which apps to use? IntelliCare addresses this problem using the Hub app, which organizes a user’s experience within the IntelliCare app suite. Notifications for all IntelliCare apps appear in a feed within the Hub. The Hub also provides links and recommendations for other apps within the IntelliCare suite such that users do not need to find these apps separately in other app marketplaces.
The aim of this study was to examine the impact of automated recommendations on engagement among users who downloaded the IntelliCare apps through its public deployment in the Google Play Store. Recommendations were made through the IntelliCare Hub app. Specifically, we examined whether the Hub was effective at improving the overall user engagement of the apps in the IntelliCare suite, and explored the Hub recommendations’ direct effects on app-specific usage.
Methods
IntelliCare Apps and Hub
The IntelliCare apps were designed by a multidisciplinary team using the Behavioral Intervention Technology model13 to improve symptoms of depression and anxiety. The IntelliCare Hub was designed to coordinate a user’s experience with the other IntelliCare apps, including managing messages and notifications from the other clinical apps within the IntelliCare suite and making weekly recommendations for new apps, not yet installed, to encourage app usage and exploration; see Figure 1.
Figure 1.
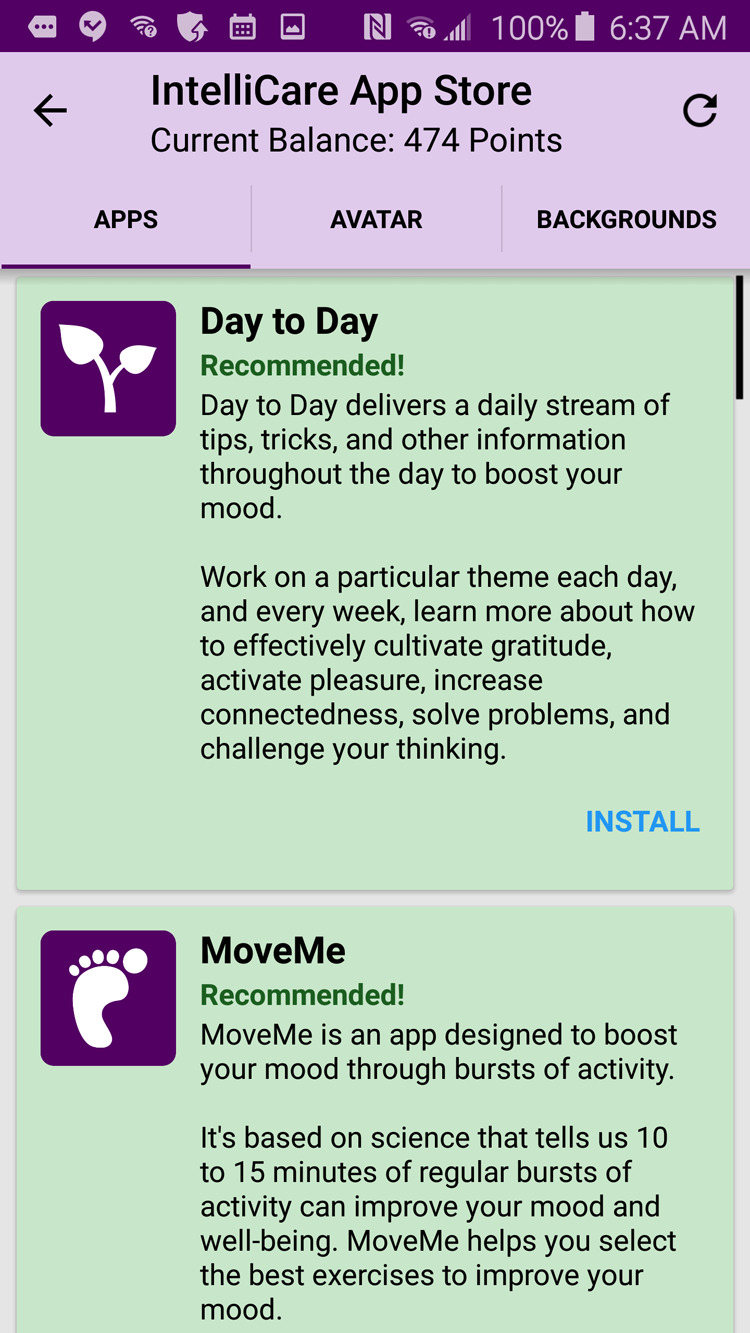
Screen shot of IntelliCare Hub making recommendations.
Data Source
The IntelliCare apps were made freely available to the public and were placed in stages on the Google Play Store starting September 22, 2014, and improved upon based on observed usage patterns and user feedback.14 Upon the first app download, users were presented with a user acknowledgment agreement. This agreement notified users that app usage information would be stored and analyzed for quality assurance purposes. This study analyzed data of the Hub and 12 other IntelliCare apps (Table 1). Specifically, this study included all users who downloaded their first IntelliCare app(s) during the period between April 1, 2015 and August 31, 2016, with the exception that Hub users who did not download Hub as their first app were excluded. Including these users in the analyses would otherwise have introduced bias favoring the Hub for 2 reasons. First, users who had downloaded another app and then decided to download the Hub were arguably motivated and had an inclination to continue exploring apps. This would introduce selection bias. Second, by including the time and usage occurring before the Hub download would artificially inflate the engagement duration of these Hub users. The start date was chosen to be around a press release by Northwestern University (April 7, 2015) that generated public interest and led to increases in downloads. The analyses included all app usage data up to December 31, 2016, so that we had at least 16-week of data for each user.
Table 1.
Description of the IntelliCare Apps Considered in This Study
| App | Description |
|---|---|
| Hub | Manages messages and notifications from the other apps within the IntelliCare collection. |
| Aspire | Guides user to identify the values that guide one's life and the actions (or “paths”) that one does to live those values. Helps keep track of those actions throughout the day and supports the user in living a more purpose-driven and satisfying life. |
| Day to Day | Delivers a daily stream of tips, tricks, and other information throughout the day to boost the user’s mood. Prompts the user to work on a particular theme each day, and every week; learn more about how to effectively cultivate gratitude, activate pleasure, increase connectedness, solve problems, and challenge one’s thinking. |
| Daily Feats | Encourages the user to incorporate worthwhile and productive activities into the day. Users add accomplishments to the Feats calendar, where they can track their positive activity streaks and level up by completing more tasks. Helps motivate users to spend their days in more meaningful, rewarding ways to increase overall satisfaction in life. |
| Worry Knot | Teaches the user to manage worry with lessons, distractions, and a worry management tool. Provides a guided tool to address specific problems that a user can’t stop thinking about, and provides written text about how to cope with “tangled thinking.” Presents statistics about progress as the user practices coping with worry, gives daily tips and tricks about managing worry, and provides customizable suggestions for ways to distract oneself. |
| Social Force | Prompts the user to identify supportive people in their lives, and provides encouragement for the user to get back in touch with those positive people. |
| My Mantra | Prompts the user to create mantras (or repeatable phrases that highlight personal strengths and values and can motivate one to do and feel good) and construct virtual albums to serve as encouragement and reminders of these mantras. |
| Thought Challenger | Guides the user through an interactive cognitive restructuring tool to examine thoughts that might exaggerate negative experiences, lead one to be overcritical, and bring down one’s mood. Teaches the user to get into the habit of changing perspective and moving toward a more balanced outlook on life. |
| iCope | Allows the user to send oneself inspirational messages and reassuring statements, written in their own words, to help the user get through tough spots or challenging situations. |
| Purple Chill | Provides users with a library of audio recordings to relax and unwind. Teaches a variety of relaxation and mindfulness practices to de-stress and worry less. |
| MoveMe | Helps the user select exercises to improve mood. Provides access to curated exercise videos and to written lessons about staying motivated to exercise. Allows the user to schedule motivational exercise time for oneself throughout the week. |
| Slumber Time | Prompts the user to complete sleep diaries to track sleep. Provides a bedtime checklist intended to clear one's mind before going to sleep. Provides audio recordings to facilitate rest and relaxation. Features an alarm clock function. |
| Boost Me | Encourages users to select and schedule positive activities (“boosts”) when they notice a drop in mood, and to track positive activities they note positively impacting their mood. Includes animated mood tracking for pre/post positive activities, calendar integration, and suggested activities that are auto-populated based on past mood improvement. |
These procedures and analyses were approved under quality assurance by the Institutional Review Boards at Columbia University and Northwestern University.
App Usage Metrics and Hub Recommendations
App usage data were collected passively. An app session was defined as a sequence of user-initiated actions or events within the app separated by <5 min between events; app usage occurring after 5 min (or longer) of no activity was counted as a new session; the length of an app session was the time from first use of an app to the last use separated by 5 min on either side.14,16
For each user, we measured the overall user engagement with IntelliCare using 3 metrics. First, to measure a user’s continued engagement, we calculated the duration between downloading the first IntelliCare app and the last use of any app. Second, we counted the number of sessions of any apps that a user launched in a week over a 16-week period. These weekly counts measured “loyalty” of the user to IntelliCare. Specifically, the loyalty index was first developed for Web analytics,17 and was later adapted for health apps18 to measure user engagement in terms of number of visits during a timeframe, and was calculated as
In this work, we considered the weekly count instead of the aggregate loyalty index so as to reflect the longitudinal trend of usage. Third, we measured the number of days with at least 1 app session launched within a week over the 16-week period. This produced a weekly measure of “regularity.” A user could have high weekly loyalty but low regularity if s/he used an IntelliCare app many times on a single day and at no times on other days.
App-specific usage was measured with similar metrics. For each user and each app, we calculated the number of app sessions in a week (app-specific loyalty) and the number of days during the week that the app was launched (app-specific regularity).
For users who had downloaded the Hub, we recorded the apps recommended by the Hub from weeks 2 through 6 after the Hub was downloaded. The Hub made app recommendations on a weekly basis to encourage the users to explore certain target apps. Thus, for each Hub user, we considered the recommendation status at 5 time points.
User Characteristics
Baseline demographic characteristics that were collected upon download of an app included age, gender, race, ethnicity, and education.
Statistical Analyses
Continued engagement experience of the users was summarized using Kaplan-Meier estimates for the Hub users and the non-Hub users separately. The 2 user groups were compared using the log-rank test. Cox proportional hazard models were used to adjust for baseline characteristics. The weekly number of app sessions (loyalty) was modeled using zero-inflated Poisson (ZIP) regression19 and was compared between Hub users and non-Hub users, with and without adjustment to their baseline characteristics. ZIP regression modeled 2 aspects of loyalty: First, logistic regression was used to model the probability of no activity (i.e., zero number of sessions). Second, Poisson regression with a log link was used to model the count data (i.e., number of sessions). ZIP models provided a much better fit than the Poisson models because of a large number of zero counts of the number of sessions in the data. The weekly regularity was compared using linear models.
Direct recommendation effects of the Hub were assessed using the app-specific usage metrics, which captured whether users had acted on the recommendations by downloading and using the recommended apps in the subsequent week. For each app, app-specific loyalty at week 2 was modeled using ZIP regression as described above: the regression models included Hub status (Hub recommending the app vs Hub not recommending the app vs no Hub) and week 1 loyalty as independent variables. App-specific regularity at week 2 was assessed using linear models analogously. The same analyses were repeated for each time point up to week 6 to examine consistency of effects over time. These time points were specified a priori, because the early time points were most important as users were establishing their usage patterns.
Results
We identified records of a total of 8253 users, with 5746 non-Hub users and 2507 Hub-users. Of the 2507 Hub-users, we excluded 196 users who did not download the Hub as their first app. Therefore, unadjusted comparisons were made in 8057 users between those who never used the Hub (n = 5746) and those who used the Hub from the beginning (n = 2311). To verify the robustness of the unadjusted analyses, adjusted analyses were performed in users who had baseline demographic characteristics available, resulting in 3047 non-Hub users and 1514 Hub users (Table 2).
Table 2.
Baseline Characteristics of Hub Users and Non-Hub Users
| Variable | Non-hub users | Hub first users |
|---|---|---|
| (N = 3047) | (N = 1514) | |
| Age (mean, SD) | 34 (13) | 36 (13) |
| Gender (n, %) | ||
| Female | 2038 (67) | 933 (62) |
| Male | 958 (31) | 567 (38) |
| Preferred not to answer | 51 (2) | 14 (1) |
| Race (n, %) | ||
| White | 2203 (72) | 1221 (81) |
| Black or African American | 222 (7) | 86 (6) |
| Asian | 242 (8) | 90 (6) |
| Others/unknown | 380 (13) | 117 (8) |
| Ethnicity (n, %) | ||
| Non-Hispanic | 2289 (75) | 1233 (81) |
| Hispanic | 368 (12) | 177 (12) |
| Others/unknown | 390 (13) | 104 (7) |
| Education (n, %) | ||
| Did not complete high school | 181 (6) | 57 (4) |
| Completed high school | 544 (18) | 201 (13) |
| Some college | 1005 (33) | 438 (29) |
| Bachelor’s degree | 770 (25) | 431 (29) |
| Graduate degree | 547 (18) | 387 (26) |
Hub Effect on Overall User Engagement
The Hub users had a higher rate of engagement over time than non-Hub users, and had a longer average duration of engagement (Figure 2). At week 16, 21% of Hub users were still using the apps compared to 11% of non-Hub users. The log-rank test had P < .001 indicating a statistically significant difference between the 2 groups. In adjusted analyses using Cox models, the risk ratio for Hub users stopping using any apps was 0.67 (95% CI, 0.62-0.71) compared to non-Hub users, after adjusting for age, gender, race, ethnicity, and education. The Cox models also identified that being female, having higher education, and being older in age were associated with lower risk of discontinuing IntelliCare.
Figure 2.
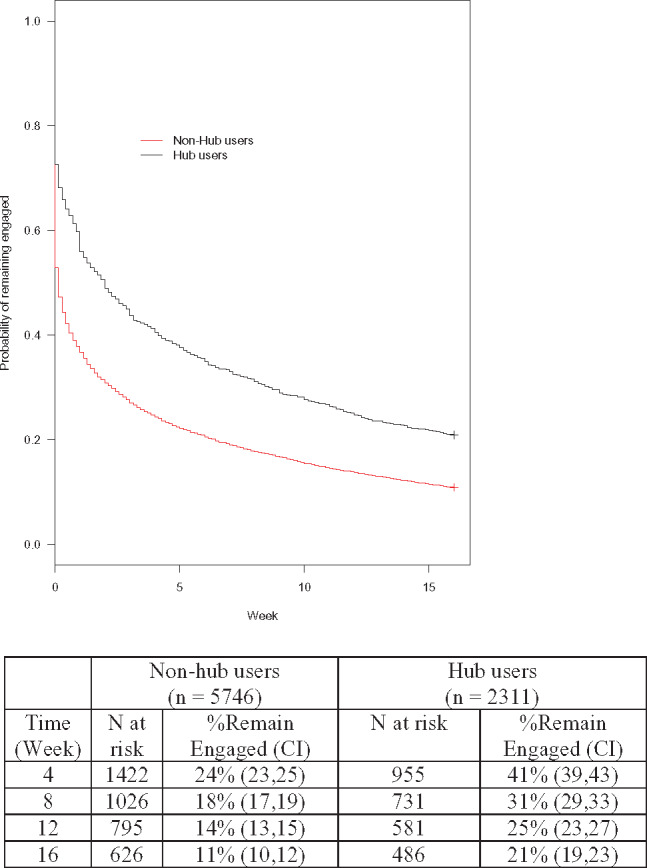
Kaplan-Meier estimates of continued engagement in Hub users and non-Hub users.
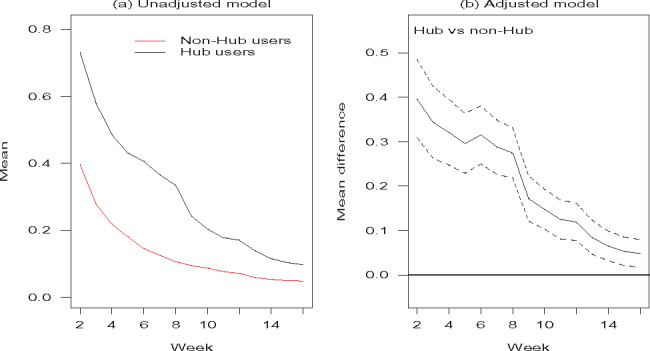
Hub users had higher loyalty than non-Hub users (Figure 3). Specifically, Hub users had a lower probability of having no weekly activity consistently over 16 weeks. The probabilities in Figure 3(A) were estimated using logistic regression fit in the ZIP model without adjustment for baseline demographics. We observed the same trend in the adjusted analyses (Figure 3[B]): Hub users had lower odds of no activity than the non-Hub users (i.e., an odds ratio <1) after accounting for user characteristics. The Poisson means in the ZIP model for the weekly number of app sessions, without adjustment to demographics, were plotted in Figure 3(C): non-Hub users had a mean between 2 and 4 sessions per week over 16 weeks, whereas Hub users had a mean between 4 and 10 sessions per week, which was substantially higher. In addition, Hub and non-Hub users were compared in the adjusted analyses in terms of the ratio (fold) of the means (Figure 3 [D]): Hub users launched on average at least twice as many sessions per week (and up to about 5 times as many) as the non-Hub users. The increase was statistically significant at all time points, indicated by the lower limits of the confidence intervals being uniformly above 1 in all weeks.
Figure 3.

Weekly loyalty IntelliCare of Hub users and non-Hub users over a 16-week period. Zero-inflated Poisson (ZIP) models were used to partition loyalty into a zero component (whether there is activity) as shown in (A) and (B), and a count component for the number of app sessions (how much activity there is) as shown in (C) and (D). Figure (B) and (D) on the right plot the Hub effects based on adjusted analyses accounting for baseline characteristics, with 95% confidence interval indicated by dotted lines.
Hub users had higher regularity and engaged in IntelliCare on more days than non-Hub users during a week (Figure 4). In the adjusted analyses (Figure 4 [B]) Hub users had higher regularity by 0.1–0.4 day per week with confidence intervals uniformly above 0.
Figure 4.
Weekly regularity of IntelliCare use by Hub users and non-Hub users over a 16-week period. Linear models were used to model the number of days when there was at least one app session during the week. Figure (B) plots the Hub effects based on adjusted analyses accounting for baseline characteristics, with 95% confidence interval indicated by dotted lines.
Effects of Hub Recommendations on App-specific Usage
In Table 3(a), specific app usage/nonusage at week 2 was compared between Hub users who received a recommendation for a specific app (“Target app recommended”) and who received a recommendation for another app (“Another app recommended”). For each app, Hub recommendations improved at least one aspect of app-specific loyalty (odds ratio of no activity and/or fold of number of sessions) among Hub users. In most apps, when a target app was recommended, the odds of no activity for that app were 21% or lower (OR ≤ 0.21) relative to when another app was recommended; the only exception was Slumber Time. In addition, a Hub recommendation generally increased the number of sessions for the recommended app in the following week (Fold > 1), and the increase was statistically significant for all apps except Daily Feats and iCope. A Hub recommendation also increased the number of days with activity in a week for all apps (Diff > 0).
Table 3.
Direct Effects of Hub Recommendations at Week 2 on App-specific Usage
| App | (a) Target app recommended vs another app recommended |
(b) Target app recommended vs Non-Hub users |
||||
|---|---|---|---|---|---|---|
| OR | Fold | Diff | OR | Fold | Diff | |
| Aspire | 0.23*** | 6.18*** | 0.41*** | 0.15*** | 6.50*** | 0.41*** |
| Boost Me | 0.07*** | 1.73*** | 0.58*** | 0.02*** | 1.78*** | 0.59*** |
| Daily Feats | 0.21* | 2.13 | 0.10*** | 0.03*** | 0.97 | 0.1*** |
| iCope | 0.05*** | 1.13 | 0.33*** | 0.02*** | 1.25 | 0.35*** |
| My Mantra | 0.12*** | 1.43*** | 0.36*** | 0.04*** | 2.48*** | 0.40*** |
| Day to Day | 0.16*** | 1.64*** | 0.41*** | 0.09*** | 2.03*** | 0.43*** |
| MoveMe | 0.16*** | 1.80* | 0.17*** | 0.10*** | 8.68*** | 0.18*** |
| Purple Chill | 0.11*** | 1.93*** | 0.32*** | 0.09*** | 3.58*** | 0.33*** |
| Slumber Time | 0.59 | 2.57* | 0.10*** | 0.14* | 1.81 | 0.11*** |
| Social Force | 0.11*** | 2.92*** | 0.33*** | 0.01*** | 5.51*** | 0.35*** |
| Thought Challenger | 0.18*** | 1.44* | 0.26*** | 0.21*** | 2.11*** | 0.29*** |
| Worry Knot | 0.20*** | 2.40*** | 0.39*** | 0.13*** | 2.29*** | 0.40*** |
*P < .05, **P < .01, ***P < .001
OR = Odds ratio of no activity in the week (loyalty). Fold = Fold of Poisson means for number of app sessions (loyalty). Diff = Mean difference in the number of days with use (regularity).
The comparison between Hub users who received recommendations and the non-Hub users in Table 3(b) depicted a very similar picture. In fact, when Hub users did not receive a recommendation for a specific app, their usage metrics were similar to non-Hub users, indicating the improvement in app usage was due to the recommendation.
The analyses at the other time points showed similar effects of the recommender. Table 4 presents the results of the Hub recommendation effects at week 4.
Table 4.
Direct Effects of Hub Recommendations at Week 4 on App-specific Usage
| App | (a) Target app recommended vs another app recommended |
(b) Target app recommended vs Non-hub users |
|||||
|---|---|---|---|---|---|---|---|
| OR | Fold | Diff | OR | Fold | Diff | ||
| Aspire | 0.13*** | 1.89** | 0.19*** | 0.14*** | 2.80*** | 0.19*** | |
| Boost Me | 0.06*** | 5.96*** | 0.72*** | 0.01*** | 4.49*** | 0.73*** | |
| Daily Feats | 0.18*** | 3.89*** | 0.17*** | 0.04*** | 2.32** | 0.17*** | |
| iCope | 0.09*** | 1.84*** | 0.26*** | 0.03*** | 2.15*** | 0.27*** | |
| My Mantra | 0.24** | 1.18 | 0.15*** | 0.09*** | 1.56** | 0.18*** | |
| Day to Day | 0.18*** | 1.66*** | 0.30*** | 0.07*** | 1.76*** | 0.32*** | |
| MoveMe | 0.12*** | 2.42*** | 0.46*** | 0.04*** | 7.09*** | 0.47*** | |
| Purple Chill | 0.18*** | 4.23*** | 0.32*** | 0.10*** | 6.28*** | 0.34*** | |
| Slumber Time | 0.21** | 6.05*** | 0.17*** | 0.05*** | 4.81*** | 0.18*** | |
| Social Force | 0.20*** | 2.27*** | 0.23*** | 0.01*** | 5.61* | 0.24*** | |
| Thought Challenger | 0.11*** | 0.73 | 0.11** | 0.15*** | 1.3 | 0.14*** | |
| Worry Knot | 0.13*** | 1.24 | 0.25*** | 0.10*** | 2.62*** | 0.27*** | |
*P < .05, **P < .01, ***P < .001.
OR = Odds ratio of no activity in the week (loyalty). Fold = Fold of Poisson means for number of app sessions (loyalty). Diff = Mean difference in the number of days with use (regularity).
Discussion
IntelliCare is a novel approach to digital mental health that, rather than providing a single comprehensive intervention app, provides a platform of apps, each of which represents a basic, elemental psychological strategy, and interaction method. This approach builds on a basic property of digital technologies, sometimes called remixing, in which functions are unbundled into more primitive parts, and then recombined to meet the needs of the user.20 IntelliCare unbundles the psychological intervention into its component parts, allowing the user to obtain the right tool for the specific goal that they have. This architecture has the potential to be highly adaptable to the needs of the individual. However, it presents another problem: how can the user navigate the numerous applications? IntelliCare addresses this need with the Hub app, which periodically recommends new apps for the individual user over time. Our results showed that users who downloaded the Hub app continued to engage with IntelliCare apps for a longer period of time and interacted with the apps more often (loyalty) and more regularly (regularity) over time than the non-Hub users. We also showed that recommendations for a specific app boosted engagement with that app.
The IntelliCare apps, when deployed with the Hub, enjoyed generally persistent usage with 21% of Hub users remaining engaged 16 weeks after initial downloads. This compares favorably to other analyses of long-term use of health and mental health apps freely available on public app stores, which range from under 3% of users showing any consistent engagement with a diet app, to between 9% and 15% of downloads of the highly acclaimed Post-Traumatic Stress Disorder Coach showing engagement in the 3rd month after download.21,22 It is worth noting that a field trial of IntelliCare showed >90% continuing to be engaged after 8 weeks, albeit, with engagement supported by regular coach interactions.16 Although human support is typically included as an engagement strategy, some research suggests that similar benefits can be achieved through persuasive features such as tailoring and personalization.23 More research is needed to understand exactly what about the recommendations was motivating for users, it is obvious that providing recommendations led to persistent engagement, and that there was a direct effect on increasing app-specific usage by the recommendations.
The present analyses have focused on the usage data rather than clinical outcomes. Although the eventual goals of the IntelliCare apps are to improve people’s lives and reduce symptoms of depression and anxiety, usage data are often used as proxy data in early studies, as clinical improvement first requires people to use the applications.24 Several studies have explored the link between usage of behavioral intervention technologies and clinical outcomes and have produced mixed results.25 Part of the reason for this may be that usage is measured in a variety of ways, some of which define usage as completing most or all of a multi-component intervention. Usage metrics included in our analyses are much more granular. We have defined 2 weekly metrics, namely user’s loyalty and regularity, which are summarized longitudinally over time. While further research is needed to examine the translation of increase in app usage into clinical benefits, these metrics create important conceptual benchmarks that allow for comparisons across users.
One benefit of using and analyzing app usage is that it is a pragmatic measure. App usage data can be collected passively, from all users, in real-world settings, with no additional burden.26 As such, it is less likely there will be missing data related to users failing to answer questionnaires, resulting in larger data sets for analysis. Changes in app usage can be observed and analyzed on a continuous, real-time basis. Although in the IntelliCare Hub, usage merely informs weekly updates to recommendations, other systems have incorporated information about engagement to lead to contextually-tailored, just-in-time interventions.27
Future Directions
This study serves as a proof-of-concept for the use of a centralized recommender app. The longer-term goal is to optimize the underlying recommender analytics so that the Hub app can intelligently recommend apps that an individual user is more likely to use. Motivated users might initially be willing to commit some energy to trying new apps. However, trial and error will likely result in frustration and eventual disengagement over time if users do not receive something useful. A recommendation system that can quickly get a user to the apps that are most useful and desirable to the individual is more likely to result in sustained engagement. Reinforcement learning techniques28,29 can be applied to develop the analytics for a recommender system aiming to maximize long-range cumulative improvement (reward) in terms of app usage metrics considered in this article. Such recommendations can be personalized based on user’s preference and past usage history. Indeed, we have envisioned an evaluation process for evolving behavioral intervention technologies,30 whereby the recommender analytics could be continuously updated and improved based on such systems.31 The app usage metrics considered in our analyses provide the basis for personalized optimization in this future endeavor.
It is worth noting that IntelliCare is a closed system in that all of the apps were developed specifically for the IntelliCare platform. Thousands of mental health apps are publicly available on app stores.32,33 The concept of a recommendation system for mental health apps can be extended to the app markets. Such a system will be highly valuable to users who are in need of treatments, and will enable them to identify useful apps without performing an extensive search. While attempts to do so have been limited34 or failed to find benefits for those receiving the recommendations,35 some of the principles and analytics behind the Hub recommendation system, if managed in a transparent and unbiased manner, could be a useful tool in the emerging efforts to help consumers navigate the large and complex mental health app marketplace.
Limitations
We note that we did not know whether app usage was associated with improvement. The IntelliCare apps did prompt users to complete brief, weekly symptom severity assessments, however compliance with these symptom assessments was so low that we did not feel any analyses would be meaningful.
These data were observational, making causal inference difficult. We saw that among Hub app users, recommendations increased usage metrics, strongly suggesting that recommendations increased the likelihood and frequency of usage. However, it was possible and indeed likely that the increased use associated with the Hub app was also related to the characteristics of the users. That is, people who downloaded the Hub app might well be more motivated, more likely to explore new apps, and more adherent than non-Hub users. While we could not determine the relative contribution of user characteristics and Hub recommendations given the nature of these data, our analyses of app-specific usage did suggest that making an app recommendation had a direct effect on usage of the target app.
Conclusion
The IntelliCare Hub and recommender system improved people’s engagement with the IntelliCare suite by driving the usage of recommended applications. This suggests that such recommender systems can be an effective method of helping users navigate a platform containing many apps. The next step will be to place intelligence behind the recommendations, so that users can be moved quickly and efficiently to apps that meet their needs and preferences. The principle of such a navigation system could be extended to help people navigate large numbers of health or mental health apps. IntelliCare is a useful starting point as previous research has demonstrated that those who receive the apps experience reductions in depression and anxiety.16 This study has demonstrated that the IntelliCare Hub recommendations were able to drive engagement even in the absence of human support and therefore might be a solution to delivering cost-effective and accessible mental health treatments at scale.
Funding
This work was supported by the US National Institutes of Health/National Institute of Mental Health grant numbers R01MH109496 and R01MH100482. The content is solely the responsibility of the authors and do not necessarily represent the views of the National Institutes of Health.
Competing interests
DCM has an ownership interest in Actualize Therapy, which has a license for IntelliCare from Northwestern University. He has also received honoraria from Optum Behavioral Health. The remaining authors have no conflicts of interest relevant to this article to disclose.
Contributors
KC and DCM were the primary authors of this paper. WL and SMS contributed substantially to the paper and provided critical revision and analyses for important intellectual content. CJK and KW contributed intellectual value and text to the paper regarding data acquisition and interpretation.
References
- 1. Mohr DC, Hart SL, Howard I et al. . Barriers to psychotherapy among depressed and nondepressed primary care patients. Ann Behav Med 2006;323:254–258. [DOI] [PubMed] [Google Scholar]
- 2. Mohr DC, Ho J, Duffecy J et al. . Perceived barriers to psychological treatments and their relationship to depression. J Clin Psychol 2010;664:394–409. [DOI] [PMC free article] [PubMed] [Google Scholar]
- 3. Kazdin AE, Blase SL. Rebooting psychotherapy research and practice to reduce the burden of mental illness. Perspect Psychol Sci 2011;6:21–37. [DOI] [PubMed] [Google Scholar]
- 4. Karyotaki E, Riper H, Twisk J et al. . Efficacy of self-guided internet-based cognitive behavioral therapy in the treatment of depressive symptoms: a meta-analysis of individual participant data. JAMA Psychiatry 2017;744:351–359. [DOI] [PubMed] [Google Scholar]
- 5. Richards D, Richardson T. Computer-based psychological treatments for depression: a systematic review and meta-analysis. Clin Psychol Rev 2012;324:329–342. [DOI] [PubMed] [Google Scholar]
- 6. Richards D, Richardson T, Timulak L, McElvaney J. The efficacy of internet-delivered treatment for generalized anxiety disorder: a systematic review and meta-analysis. Internet Interv 2015;2:272–282. [Google Scholar]
- 7. Firth J, Torous J, Nicholas J et al. . The efficacy of smartphone-based mental health interventions for depressive symptoms: a meta-analysis of randomized controlled trials. World Psychiatry 2017;163:287–298. [DOI] [PMC free article] [PubMed] [Google Scholar]
- 8. Firth J, Torous J, Nicholas J, Carney R, Rosenbaum S, Sarris J. Can smartphone mental health interventions reduce symptoms of anxiety? A meta-analysis of randomized controlled trials. J Affect Disord 2017;218:15–22. [DOI] [PubMed] [Google Scholar]
- 9. Oulasvirta A, Tamminen S, Roto V, Kuorelahti J. Interaction in 4-second bursts: the fragmented nature of attentional resources in mobile HCI. SIGCHI Conference on Human Factors in Computing Systems; 2005; Portland, Oregon, USA: ACM. [Google Scholar]
- 10. Vaish R, Wyngarden K, Chen J, Cheung B, Bernstein MS. Twitch crowdsourcing: crowd contributions in short bursts of time. SIGCHI Conference on Human Factors in Computing Systems; 2014; Toronto, ON, Canada: ACM. [Google Scholar]
- 11. Andrews S, Ellis DA, Shaw H, Piwek L. Beyond self-report: tools to compare estimated and real-world smartphone use. PLoS One 2015;1010:e0139004. [DOI] [PMC free article] [PubMed] [Google Scholar]
- 12. Institute of Medicine (IOM). Psychosocial Interventions for Mental and Substance Use Disorders: A Framework for Establishing Evidence-Based Standards. Washington DC: Institute of Medicine; 2015. [PubMed] [Google Scholar]
- 13. Mohr DC, Schueller SM, Montague E, Burns MN, Rashidi P. The behavioral intervention technology model: an integrated conceptual and technological framework for eHealth and mHealth interventions. J Med Internet Res 2014;166:e146. [DOI] [PMC free article] [PubMed] [Google Scholar]
- 14. Lattie EG, Schueller SM, Sargent E et al. . Uptake and usage of IntelliCare: a publicly available suite of mental health and well-being apps. Internet Interv 2016;4:152. [DOI] [PMC free article] [PubMed] [Google Scholar]
- 15. Stiles-Shields C, Montague E, Lattie EG, Schueller SM, Kwasny MJ, Mohr DC. Exploring user learnability and learning performance in an app for depression: usability study. JMIR Human Factors 2017;43:e18. [DOI] [PMC free article] [PubMed] [Google Scholar]
- 16. Mohr DC, Tomasin KN, Lattie EG et al. . IntelliCare: an eclectic, skills-based app suite for the treatment of depression and anxiety. J Med Internet Res 2017;191:e10. [DOI] [PMC free article] [PubMed] [Google Scholar]
- 17. Peterson ET, Carrabis J. Measuring the Immeasurable: Visitor Engagement. 2008; http://www.verticalstudio.com/hs-fs/hub/74398/file-15425996-pdf/docs/web_analytics_demystified_and_nextstage_global_-_measuring_the_immeasurable_-_visitor_engagement.pdf. Accessed March 21, 2018. [Google Scholar]
- 18. Taki S, Lymer S, Russell CG et al. . Assessing user engagement of an mHealth intervention: development and implementation of the growing healthy app engagement index. JMIR mHealth and uHealth 2017;5:e89. [DOI] [PMC free article] [PubMed] [Google Scholar]
- 19. Cameron AC, Trivedi PK. Regression Analysis of Count Data. New York: Cambridge University Press; 1998. [Google Scholar]
- 20. Kelly K. The Inevitable. New York: Viking Press; 2016. [Google Scholar]
- 21. Owen JE, Jaworski BK, Kuhn E, Makin-Byrd KN, Ramsey KM, Hoffman JE. mHealth in the wild: using novel data to examine the reach, use, and impact of PTSD coach. JMIR Ment Health 2015;21:e7. [DOI] [PMC free article] [PubMed] [Google Scholar]
- 22. Helander E, Kaipainen K, Korhonen I, Wansink B. Factors related to sustained use of a free mobile app for dietary self-monitoring with photography and peer feedback: retrospective cohort study. J Med Internet Res 2014;164:e109. [DOI] [PMC free article] [PubMed] [Google Scholar]
- 23. Kelders SM, Bohlmeijer ET, Pots WT, van Gemert-Pijnen JE. Comparing human and automated support for depression: fractional factorial randomized controlled trial. Behav Res Ther 2015;72:72–80. [DOI] [PubMed] [Google Scholar]
- 24. Klasnja P, Consolvo S, Pratt W. How to evaluate technologies for health behavior change in HCI research. Proceedings of SIGCHI Conference on Human Factors in Computing Systems, Vancouver, BC; 2011;3063–3072. [Google Scholar]
- 25. Donkin L, Christensen H, Naismith SL, Neal B, Hickie IB, Glozier N. A systematic review of the impact of adherence on the effectiveness of e-therapies. J Med Internet Res 2011;13:e52. [DOI] [PMC free article] [PubMed] [Google Scholar]
- 26. Glasgow RE. What does it mean to be pragmatic? Pragmatic methods, measures, and models to facilitate research translation. Health Educ Behav 2013;403:257–265. [DOI] [PubMed] [Google Scholar]
- 27. Klasnja P, Smith SN, Seewald NJ, Lee AJ, Hall K, Murphy SA. Effects of contextually-tailored suggestions for physical activity: the HeartSteps Micro-Randomized Trial. Ann Behav Med 2017;51:S902–3. [DOI] [PMC free article] [PubMed] [Google Scholar]
- 28. Sutton RS, Barto AG. Reinforcement Learning: An Introduction. Cambridge: MIT Press; 1998. [Google Scholar]
- 29. Hu X, Hsueh PYS, Chen CH, Diaz KM, Cheung YKK, Qian M. A first step towards behavioral coaching for managing stress: a case study on optimal policy estimation with multi-stage threshold Q-learning. AMIA 2017 Annual Symposium; November 2017, Washington DC. [PMC free article] [PubMed] [Google Scholar]
- 30. Mohr DC, Cheung K, Schueller SM, Brown CH, Duan N. Continuous evaluation of evolving behavioral intervention technologies. Am J Prev Med 2013;454:517–523. [DOI] [PMC free article] [PubMed] [Google Scholar]
- 31. Cheung YK, Chakraborty B, Davidson KW. Sequential multiple assignment randomized trial (SMART) with adaptive randomization for quality improvement in depression treatment programs. Biometrics 2015;712:450–459. [DOI] [PMC free article] [PubMed] [Google Scholar]
- 32. Torous J, Roberts LW. Needed innovation in digital health and smartphone applications for mental health: transparency and trust. JAMA Psychiatry 2017;745:437–438. [DOI] [PubMed] [Google Scholar]
- 33. Ameringen M, Turna J, Khalesi Z, Pullia K, Patterson B. There is an app for that! The current state of mobile applications (apps) for DSM‐5 obsessive‐compulsive disorder, posttraumatic stress disorder, anxiety and mood disorders. Depress Anxiety 2017;34:526–539. [DOI] [PubMed] [Google Scholar]
- 34. Christensen H, Murray K, Calear AL, Bennett K, Bennett A, Griffiths KM. Beacon: a web portal to high-quality mental health websites for use by health professionals and the public. Med J Aust 2010;19211:S40–4. [DOI] [PubMed] [Google Scholar]
- 35. Bidargaddi N, Musiat P, Winsall M et al. . Efficacy of a web-based guided recommendation service for a curated list of readily available mental health and well-being mobile apps for young people: randomized controlled trial. J Med Internet Res 2017;195:e141. [DOI] [PMC free article] [PubMed] [Google Scholar]