

Abstract
Objective
To develop a conceptual prediction model framework containing standardized steps and describe the corresponding open-source software developed to consistently implement the framework across computational environments and observational healthcare databases to enable model sharing and reproducibility.
Methods
Based on existing best practices we propose a 5 step standardized framework for: (1) transparently defining the problem; (2) selecting suitable datasets; (3) constructing variables from the observational data; (4) learning the predictive model; and (5) validating the model performance. We implemented this framework as open-source software utilizing the Observational Medical Outcomes Partnership Common Data Model to enable convenient sharing of models and reproduction of model evaluation across multiple observational datasets. The software implementation contains default covariates and classifiers but the framework enables customization and extension.
Results
As a proof-of-concept, demonstrating the transparency and ease of model dissemination using the software, we developed prediction models for 21 different outcomes within a target population of people suffering from depression across 4 observational databases. All 84 models are available in an accessible online repository to be implemented by anyone with access to an observational database in the Common Data Model format.
Conclusions
The proof-of-concept study illustrates the framework’s ability to develop reproducible models that can be readily shared and offers the potential to perform extensive external validation of models, and improve their likelihood of clinical uptake. In future work the framework will be applied to perform an “all-by-all” prediction analysis to assess the observational data prediction domain across numerous target populations, outcomes and time, and risk settings.
Keywords: Prediction model, prediction framework, prognostic model, observational data
Introduction
Observational healthcare data, such as administrative claims and electronic health records, are increasingly used for clinical characterization of disease progression, quality improvement, and population-level effect estimation for medical product safety surveillance and comparative effectiveness. Advances in machine learning for large dataset analysis have led to increased interest in applying patient-level prediction on this type of data. Patient-level prediction offers the potential for medical practice to move beyond average treatment effects and to consider personalized risks as part of clinical decision-making. Many published efforts in patient-level-prediction do not follow the model development guidelines,1,2 fail to perform extensive external validation,3,4 or provide insufficient model details5 that limits the ability of independent researchers to reproduce the models and perform external validation.1 This makes it hard to fairly evaluate the predictive performance of the models and reduces the likelihood of the model being used appropriately in clinical practice. To improve standards, several papers have been written detailing guidelines for best practices in developing and reporting prediction models. For example, the prognostic research strategy consists of 4 papers stating a variety of best practices aimed at general considerations,6 prognostic factor discovery,7 model development,8 and making clinical impacts by implementing the model to enable stratified medicine.9 The Transparent Reporting of a multivariable prediction model for Individual Prognosis Or Diagnosis statement provides clear recommendations for reporting prediction model development and validation5 and addresses some of the concerns related to transparency. However, data structure heterogeneity and inconsistent terminologies still make collaboration and model sharing difficult as different researchers are often required to write new code to extract the data from their databases and may define variables differently.
We propose to facilitate adherence to the best practices proposed in prognostic research strategy by forming collaborations between various data holders and researchers and developing a conceptual framework that standardises the process of developing, evaluating, and reporting predictive models. Such a strategy enables large-scale exploration of prediction problems and improves transparency and sharing of research within the prediction model community, but requires standardization of the observational data to a shared data model and terminology. Fortunately, there has already been a collaborative effort to standardise terminologies and develop a homogenous data structure for observational healthcare data via the Observational Health Data Sciences and Informatics (OHDSI) collaboration. OHDSI is an open science collaborative with an international network of researchers and data partners, who focus on methodological research, open-source analytics development, and clinical applications to advance the generation and dissemination of reliable medical evidence from observational data.10 The OHDSI community has adopted the Observational Medical Outcomes Partnership (OMOP) Common Data Model (CDM),11 an open community standard for standardizing the structure and content of observational data. Use of the OMOP CDM across participating researchers enables studies to be consistently developed, executed and replicated across collaborator sites. A recent investigation of treatment pathways for three diseases12 highlights the power of utilizing the OHDSI network, as collaborators efficiently replicated the study across numerous diverse datasets from around the world.
In this paper, we propose a standardised framework for patient-level prediction that utilizes the OMOP CDM and standardized vocabularies, and describe the open-source software that we developed implementing the framework’s pipeline. The framework is the first to support existing best practice guidelines and will enable open dissemination of models that can be extensively validated across the network of OHDSI collaborators. As a proof-of-concept we apply the framework to 4 different databases for the clinical problem of predicting the 1-year risk of 21 different medical outcomes for a target population of patients with pharmaceutically-treated depression.
Observational Healthcare Data and the OMOP CDM
In general, a prediction task can be defined as using a labeled dataset, consisting of a set of prediction variables paired with a label, to learn the function that maps as closely as possible the prediction variables to the correct label. In contrast, in observational healthcare data, patients yield a series of time-stamped clinical elements (termed clinical concepts) across a variety of concept domains (such as conditions, drugs, procedures, and measurements) based on their encounters with the health system or other reporting of their health information. A common strategy for transforming these data to the labeled analytic data need for prediction is to create a population of patients at risk of the health outcome being predicted (termed the target population) and selecting a single time point for each patient (target population index date) that provides the perspective for extracting the prediction variables; only clinical elements prior to or on the same day as the target population index date can be considered when extracting prediction variables. Finding which patients experience the health outcome during some time-at-risk period relative to the target population index date then determines the labels.
To ensure that such a transformation process is portable across multiple healthcare databases requires the use of a CDM. The OMOP CDM improves semantic and syntactic interoperability by standardizing both data structure and language.
Methods
Standardized Prediction Framework
Our proposed conceptual has 5 steps:
0. Map the raw observational healthcare data into the OMOP CDM
- 1. Specify the prediction problem
- Define the target population, the patients to whom you wish to apply to model. The target population is a set of patients who satisfy one or more inclusion criteria for a duration of time. For example, a target population could be patients who start depression treatment observed from the time of treatment initiation until treatment cessation.
- Define the outcome for which you wish to predict the risk. The outcome is also a population defined as a set of patients who satisfy one or more inclusion criteria for a duration of time. For example, an outcome population could be patients who experience stroke observed at the time of first diagnosis.
- Define the time-at-risk period; this is the time interval within which you wish to predict the outcome occurring. For example, patients with depression treatment may be at risk of stroke from the day following treatment initiation through 1 year following treatment initiation.
- 2. Select the dataset that will be used to develop the model
- Check that the target population is of sufficient size for model development.
- Check that there a sufficient number of outcomes in the target population during the time at risk.
- 3. Select from a set of standardized predictor variables (although we strongly recommend selecting all standardized variables).
- Can pick different time periods to construct variables prior to time-at-risk start date.
- Can pick from demographics, conditions, drugs, measurements, procedures and observations concepts.
- Can group concepts based on a hierarchy in the vocabulary.
4. Select the machine learning models that will be trained, training settings, and the hyper-parameter search strategy.
5. Generate and validate each model internally and externally.
Specifying the prediction problem
To standardize the prediction problem, we define the generic question in the form: “Among <target population>, which patients will develop <an outcome> during <a time-at-risk period>?” We define both target populations and outcomes as an index rule specifying the index date (e.g., the occurrence of some diagnosis), possibly accompanied by a set of inclusion rules. Rules can reference one or more clinical concepts, and because we adopt the OMOP CDM these concepts arise from standardized vocabularies. We have opted to define outcomes independently of the target population. This way, it is possible to reuse outcome definitions for different prediction problems as we determine the outcome not just for the target population, but for all possible populations. For example, we may create a definition of “stroke” to create predictive models both in a population of diabetics as well a population of patients suffering from depression. We recommend that both the definitions and the code implementing a definition be available on an online repository, for example, the OHDSI GitHub repository.
The final part of the prediction problem definition is to define the time-at-risk, an interval relative to the target population index date in which we wish to predict the occurrence of the outcome of interest. We then label each patient in the target population as having the outcome or not having the outcome in their time-at-risk. The result is a labeled analytic dataset that is used by a classifier to learn a predictive model. The prediction problem is illustrated in Figure 2.
Figure 2.
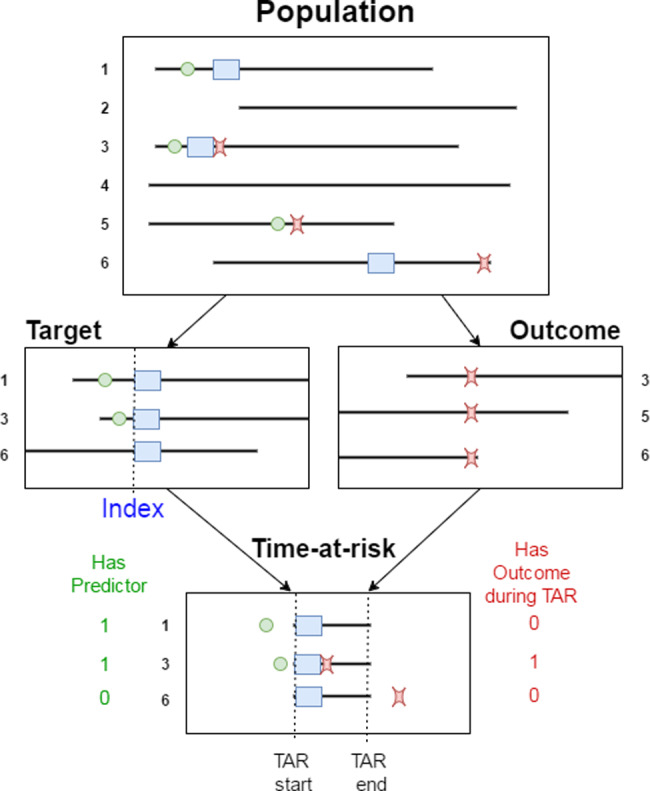
Illustration of the prediction problem. Patients enter the target population when they experience the index event (blue rectangle). For each patient, prediction variables are constructed using data recorded prior to the index date, and the presence of the outcome of interest is assessed during the time-at-risk.
Figure 1.

Illustration of how the homogeneous structure of the OMOP common data model enables sharing of model development code.
Selecting the observational dataset
The next step is to pick the observational dataset mapped to the OMOP CDM on which to learn a predictive model. Selection of a dataset can be driven by, for example, the number of people in the target population and the number of people that experience the outcome. Having too few people in the target population with the outcome is known to limit the prediction model’s performance; therefore, we address this in the framework by adding a minimum constraint on outcome counts that we check prior to model development.
Selecting from standardized predictor variables
One key aspect of the standardized patient-level prediction framework is its automated construction of predictor variables. The framework contains a library of potential predictor variables. The predictor variables are well-defined and, by utilizing the OMOP CDM data structure, their construction is readily replicated across datasets. The standard predictor variables that are assessed relative to the index date include:
Demographics: age, gender, index month
All conditions/drugs/measurements/procedures/observations recorded within n days prior to index (default n = 365)
All conditions/drugs/measurements/procedures/observations recorded anytime prior to index
Hierarchal groupings of the conditions/drugs/measurements/procedures/observations
All standard concept count variables
In addition, there is the flexibility to create custom predictor variables. The library of potential predictors will be extended considerably in the future based on our ongoing research efforts in advanced feature engineering.
The notion of “missing values” does not easily apply to longitudinal observational data. Conditions or drugs may or may not be recorded, but it is not possible to determine whether a count of 0 indicates the patient did not have the variable or whether it was missing. Effectively, by default the framework imputes 0 for missing values but there is also the opportunity to add custom covariates that perform imputation. Our framework would enable the evaluation of imputation methods at scale with respect to performance and computational cost. This is an interesting subject for our future work.
Selecting the classifier and settings
We split the labeled data created during the prior steps into a test set and train set. Within the package, the default split is 75% into the train set and 25% in the test set, but this can be modified. We then train a selection of suitable machine learning classifiers using the training dataset through n-fold cross validation to select the optimal hyper-parameters of the classifier. For each classifier, the framework returns the hyper-parameter setting that obtains the best performance (based on the objective function) as determined by cross-validation on the train set. As a best practice, we propose executing a wide array of machine learning algorithms for each prediction problem, comparing their performances, and then selecting the algorithm that is most suitable for the prediction problem.
Validating the predictive model
We internally validate the models on the test set and externally validate by applying them to new data extracted from different datasets (using the same extraction process). We use the area under the receiver operator characteristic curve (AUC) to measure discrimination, which calculates the probability that a randomly chosen patient with the outcome will be assigned a higher risk of the outcome by the model than a randomly chosen patient without the outcome. We generate the receiver operator characteristic curve by plotting the model’s sensitivity against 1-specificity. We also calculate model calibration, indicating how well the predicted risks match the observed true risk. The calibration is calculated by creating 10 bins based on predicted risk and for each bin calculating the average predicted risk and fraction of patients with the outcome. These values are then plotted to develop a standard calibration plot. In addition, a linear model is fitted to the 10 values and the intercept/slope is calculated to give a summary of the model calibration.
Implementation of the Standardized Prediction Framework
The framework is implemented as a set of R packages, which are available as open source (https://github.com/ohdsi). The central package is the PatientLevelPrediction which implements most steps of the framework described above. The package contains default covariates and classifiers, but users can readily add custom covariate construction code or add new classifiers. The cohort definitions, the model details, and model performance measures are all stored which enables full reproducibility and external validation. See Supplementary material SA for detailed information about the framework implementation.
Results
The Prediction Problem
We test the framework for the problem: “Amongst patients with pharmaceutically-treated depression, which patients will develop <an outcome> during the 1-year time interval following the start of the depression episode?.” The aim here was not to obtain the best possible model for this problem but to demonstrate the use of the framework.
We developed prediction models for 21 outcomes listed in Table 2.
Table 2.
Target Population Characteristics Across the Datasets
| Variable | CCAE | OPTUM | MDCR | MDCD |
|---|---|---|---|---|
| Mean (sd) prior obs in days | 1262.4 (944.3) | 1234.6 (886.3) | 1216.4 (881.6) | 973.4 (593.3) |
| Mean (sd) No. condition records 365 days | 12.7 (10.2) | 16.8 (13.3) | 20.1 (14.5) | 22.3 (16.7) |
| Mean (sd) No. drug ingredients 365 days | 9.4 (7.2) | 9.0 (6.8) | 12.5 (7.7) | 13.8 (9.8) |
| Mean No. visits in prior 365 days | 24.4 (21.1) | 26.3 (24.7) | 31.6 (24.7) | 54.7 (77.4) |
| (%) Gender = Male | 37.0 | 36.6 | 34.0 | 26.3 |
| (%) Age group: 0–4 | 0.0 | 0.0 | 0.0 | 0.0 |
| (%) Age group: 5–9 | 0.1 | 0.1 | 0.0 | 1.2 |
| (%) Age group: 10–14 | 2.0 | 1.8 | 0.0 | 8.7 |
| (%) Age group: 15–19 | 9.3 | 7.8 | 0.0 | 16.3 |
| (%) Age group: 20–24 | 7.0 | 5.4 | 0.0 | 5.2 |
| (%) Age group: 25–29 | 4.7 | 4.9 | 0.0 | 7.2 |
| (%) Age group: 30–34 | 7.6 | 7.5 | 0.0 | 7.7 |
| (%) Age group: 35–39 | 9.8 | 9.4 | 0.0 | 7.9 |
| (%) Age group: 40–44 | 11.5 | 10.6 | 0.1 | 8.5 |
| (%) Age group: 45–49 | 12.8 | 11.3 | 0.6 | 10.1 |
| (%) Age group: 50–54 | 13.8 | 11.0 | 1.6 | 10.6 |
| (%) Age group: 55–59 | 12.7 | 9.5 | 3.2 | 8.2 |
| (%) Age group: 60–64 | 8.8 | 6.8 | 4.0 | 5.0 |
| (%) Age group: 65–69 | 0.0 | 4.7 | 30.4 | 1.7 |
| (%) Age group: 70–74 | 0.0 | 3.5 | 23.2 | 0.8 |
| (%) Age group: 75–79 | 0.0 | 2.5 | 16.8 | 0.4 |
| (%) Age group: 80–84 | 0.0 | 2.3 | 11.7 | 0.3 |
| (%) Age group: 85–89 | 0.0 | 0.9 | 6.1 | 0.28 |
| (%) Age group: 90–94 | 0.0 | 0.0 | 1.9 | 0.0 |
| (%) Age group: 95–99 | 0.0 | 0.0 | 0.4 | 0.0 |
Target Population (Pharmaceutically-treated depression)
- Index rule defining the target population index dates:
- First condition record of major depressive disorder
- Target population end date: Same as target population index date
- Inclusion criteria:
- Antidepressant recorded within 30 days before to 30 days after the target population index date
- No history of psychosis
- No history of dementia
- No history of mania
- ≥365 days prior observation
See Supplementary material SD for a complete list of definitions used above.
Datasets Used to Develop the Model
We used the following datasets:
Truven MarketScan Medicare Supplemental Beneficiaries (MDCR)—a US insurance claims database containing 9 559 877 lives between the years January 1, 2000 and April 30, 2016,
Truven MarketScan Medicaid (MDCD)—a US insurance claims database containing 21 577 517 lives between the years January 1, 2006 and December 31, 2014,
OptumInsight’s de-identified ClinformaticsTM Datamart (Optum)—a US electronic healthcare database containing 73 969 539 lives between the years May 1, 2000 and March 31, 2016, and
Truven MarketScan Commercial Claims and Encounters (CCAE)—a US insurance claims database containing 131 533 722 lives between the years January 1, 2000 and April 30, 2016.
The use of Truven Health MarketScan® and Optum databases were reviewed by the New England Institutional Review Board and were determined to be exempt from broad Institutional Review Board approval.
Selected Standardized Predictor Variables
In this study we use the standardized variables described earlier, removing variables occurring in less than 10 patients. As a result we had approximately 10 000–17 000 variables, depending on the dataset.
Machine Learning Model
For this proof-of-concept, we train an L1-regularized logistic regression using 3-fold cross validation auto hyper-parameter selection as implemented in the R package Cyclops.15
Full details of the model development, specification and performance can be found in the supplementary material SA. In addition to the L1-regularized logistic regression we also trained gradient boosting machine, random forest, and naïve Bayes models.
Study Population
Table 1 presents the number of target population patients with each outcome recorded during their time-at-risk period.
Table 1.
The Number of Outcomes Within the Target Population for the Various Outcomes Across the Datasets.
| Outcome | CCAE (N = 660 k) [%] | OPTUM (N = 363 k) | MDCR (N = 58 k) | MDCD (N = 80 k) |
|---|---|---|---|---|
| Open-angle glaucoma | 249 [0.04] | 610 [0.17] | 113 [0.19] | 59 [0.07] |
| Gastrointestinal hemorrhage | 1153 [0.17] | 823 [0.23] | 534 [0.92] | 238 [0.30] |
| Acute myocardial infarction | 1000 [0.15] | 814 [0.22] | 578 [1.00] | 211 [0.26] |
| Stroke | 1351 [0.20] | 1183 [0.33] | 874 [1.51] | 356 [0.45] |
| Suicide and suicidal ideation | 17 992 [2.73] | 9530 [2.63] | 575 [0.99] | 4609 [5.76] |
| Insomnia | 34 838 [5.28] | 22 635 [6.24] | 2941 [5.07] | 5358 [6.70] |
| Diarrhea | 30 632 [4.64] | 20 169 [5.56] | 3667 [6.32] | 5431 [6.79] |
| Nausea | 38 686 [5.86] | 25 312 [6.97] | 3876 [6.68] | 8257 [10.32] |
| Hypothyroidism | 15 422 [2.34] | 10 123 [2.79] | 2079 [3.58] | 1822 [2.28] |
| Constipation | 22 636 [3.43] | 16 237 [4.47] | 3835 [6.61] | 5247 [6.56] |
| Seizure | 3594 [0.54] | 2377 [0.65] | 487 [0.84] | 1165 [1.46] |
| Delirium | 2440 [0.37] | 1861 [0.51] | 797 [1.37] | 569 [0.71] |
| Alopecia | 5087 [0.77] | 3234 [0.89] | 329 [0.57] | 451 [0.56] |
| Tinnitus | 6381 [0.97] | 4407 [1.21] | 938 [1.62] | 576 [0.72] |
| Vertigo | 6486 [0.98] | 4170 [1.15] | 1034 [1.78] | 657 [0.82] |
| Hyponatremia | 4539 [0.69] | 4861 [1.34] | 1789 [3.08] | 1463 [1.83] |
| Decreased libido | 2832 [0.43] | 1755 [0.48] | 91 [0.16] | 171 [0.21] |
| Fracture | 7532 [1.14] | 6273 [1.73] | 2606 [4.49] | 1371 [1.71] |
| Hypotension | 8525 [1.29] | 8185 [2.25] | 2888 [4.98] | 2603 [3.25] |
| Acute liver injury | 387 [0.06] | 306 [0.08] | 44 [0.08] | 114 [0.14] |
| Ventricular arrhythmia and sudden cardiac death | 806 [0.12] | 730 [0.20] | 355 [0.61] | 315 [0.39] |
Table 2 presents characteristics of the patients for each dataset’s target population. The target population obtained from the MDCD database appeared to have a shorter observation prior to the target population index date, a mean of 973.4 days compared to 1216.4–1262.4 for the other databases. MDCD also had a lower percentage of males (26.3%) in the target population compared to the other databases (ranging between 34% and 37%). MDCR consists of an older target population than the other databases and CCAE only contains people <65 years old. MDCR and MDCD had target populations consisting of people who had more drug and condition records in the prior 30 and 365 days than CCAE and OPTUM.
Internal Validation
Table 3 presents the performance of the models developed for the difference outcomes across the datasets. The discrimination performance differs over the outcomes and databases. For example, the framework led to highly discriminative models for the outcomes such as ventricular arrhythmia and sudden cardiac death and hypothyroidism across the 4 databases, with AUCs ranging between 0.732–0.808 and 0.763–0.845, respectively. However, for the outcomes diarrhea and tinnitus the discrimination was consistently poor across the dataset, ranging between 0.636–0.682 and 0.576–0.696, respectively. This suggests that observational databases could be utilized to develop clinically useful models that predict some outcomes, but certain types of outcomes may need more advanced methods or alternative datasets. In some cases there was inconsistency across databases, for example, predicting open-angle glaucoma in MDCD resulted in an AUC of 0.624, but the AUC for the same outcome in the other 3 databases was >0.7.
Table 3.
Discrimination Performance of the Models for Each Outcome Across the Datasets
| Outcome | Discrimination (AUC) |
Calibration |
||||||||||
|---|---|---|---|---|---|---|---|---|---|---|---|---|
| CCAE | OPTUM | MDCR | MDCD | CCAE |
OPTUM |
MDCR |
MDCD |
|||||
| Intercept | Slope | Intercept | Slope | Intercept | Slope | Intercept | Slope | |||||
| Open-angle glaucoma | 0.817 | 0.822 | 0.710 | 0.624 | 0.000 | 1.051 | 0.000 | 0.990 | −0.001 | 1.495 | 0.000 | 1.399 |
| Gastrointestinal hemorrhage | 0.824 | 0.797 | 0.677 | 0.754 | 0.000 | 0.868 | 0.000 | 1.009 | −0.001 | 0.952 | 0.000 | 0.633 |
| Acute myocardial infarction | 0.863 | 0.808 | 0.697 | 0.787 | 0.000 | 1.048 | 0.000 | 0.916 | −0.003 | 1.404 | 0.000 | 1.263 |
| Stroke | 0.797 | 0.813 | 0.661 | 0.803 | 0.000 | 0.783 | 0.000 | 0.750 | 0.001 | 0.833 | 0.000 | 1.082 |
| Suicide and suicidal ideation | 0.796 | 0.805 | 0.690 | 0.710 | 0.002 | 1.711 | −0.002 | 1.720 | 0.006 | 1.387 | −0.002 | 1.773 |
| Insomnia | 0.683 | 0.667 | 0.672 | 0.636 | 0.023 | 1.314 | 0.010 | 1.305 | 0.029 | 1.379 | 0.025 | 1.109 |
| Diarrhea | 0.682 | 0.674 | 0.636 | 0.680 | 0.012 | 1.095 | 0.005 | 1.116 | 0.023 | 1.083 | 0.009 | 1.253 |
| Nausea | 0.701 | 0.675 | 0.651 | 0.668 | 0.021 | 1.111 | 0.015 | 1.099 | 0.034 | 0.999 | 0.036 | 1.152 |
| Hypothyroidism | 0.842 | 0.792 | 0.839 | 0.763 | −0.002 | 1.343 | 0.000 | 1.051 | 0.002 | 1.557 | −0.001 | 1.261 |
| Constipation | 0.704 | 0.705 | 0.651 | 0.645 | 0.010 | 1.132 | 0.005 | 1.238 | 0.027 | 1.080 | 0.010 | 1.268 |
| Seizure | 0.753 | 0.757 | 0.649 | 0.696 | 0.000 | 1.216 | 0.000 | 0.984 | −0.001 | 1.212 | 0.001 | 1.107 |
| Delirium | 0.782 | 0.781 | 0.702 | 0.664 | 0.000 | 0.998 | 0.001 | 0.733 | 0.001 | 0.855 | 0.002 | 0.830 |
| Alopecia | 0.692 | 0.672 | 0.684 | 0.625 | 0.002 | 1.293 | −0.001 | 1.323 | −0.001 | 2.568 | 0.001 | 1.244 |
| Tinnitus | 0.696 | 0.672 | 0.576 | 0.638 | 0.003 | 1.152 | −0.001 | 1.368 | 0.006 | 1.372 | 0.002 | 1.292 |
| Vertigo | 0.714 | 0.705 | 0.619 | 0.679 | 0.002 | 1.214 | 0.000 | 1.229 | 0.006 | 1.251 | 0.002 | 1.242 |
| Hyponatremia | 0.808 | 0.809 | 0.690 | 0.795 | 0.001 | 1.073 | 0.001 | 1.141 | 0.002 | 1.298 | 0.002 | 1.137 |
| Decreased libido | 0.710 | 0.738 | 0.662 | 0.627 | 0.002 | 1.179 | 0.000 | 1.684 | −0.002 | 5.095 | 0.001 | 0.893 |
| Fracture | 0.674 | 0.734 | 0.679 | 0.657 | 0.001 | 1.037 | 0.001 | 1.119 | 0.007 | 1.019 | −0.002 | 1.553 |
| Hypotension | 0.761 | 0.793 | 0.709 | 0.749 | 0.003 | 1.112 | 0.002 | 1.116 | 0.011 | 1.195 | 0.004 | 1.191 |
| Acute liver injury | 0.703 | 0.743 | 0.516 | 0.534 | 0.000 | 0.998 | 0.000 | 0.919 | −0.003 | 5.698 | 0.001 | −0.036 |
| Ventricular arrhythmia and sudden cardiac death | 0.776 | 0.806 | 0.732 | 0.808 | 0.000 | 0.857 | 0.000 | 1.034 | 0.000 | 0.806 | −0.001 | 1.105 |
An AUC of 0.5 means the model discriminated as well as random guessing and an AUC of 1 means perfect discrimination. For calibration, and intercept of 0 and slope of 1 means perfect calibration.
The calibration plots for each model are available in Supplementary material SB and the reciever operating characteristic (ROC) plots in Supplementary material SC. The intercept and slope of the linear model fit to the average predicted risk against the observed fraction with the outcome in bins of 10 based on risk percentile are also presented in Table 3 as a summary of calibration. However, we recommend inspecting the calibration plots as the intercept and slope only present a limited perspective of calibration.
Discussion
The proposed framework succeeds in developing transparent predictive models that were developed in a consistent way across the datasets for predicting various outcomes within a target population of therapeutically treated depressed patients. As a proof-of-concept we shared results for lasso regression models (and 3 other classifiers) for 21 outcomes in patients with pharmaceutically treated depression. However, we believe that model selection is an empirical process and multiple model types should be assessed as a best practice. Our framework is built for this purpose, and is very flexible to accommodate unlimited model types, custom covariates, etc. In general, common prediction models that are clinically used tend to have a AUC ranging between 0.5 and 0.8,16–19 with many having a value <0.7,16 so the performance of our framework across the 21 outcomes is comparable, although the external validation discrimination is likely to be lower than the internal validation.
The implications of the proposed patient-level prediction framework are: (1) a common framework will encourage collaboration when developing patient-level prediction; (2) the standardizations present the opportunity to develop and validate predictive models using observational data at scale; and (3) insight in to the feasibility of model development for specific diseases can be investigated.
The patient-level prediction framework and software directly or indirectly address most of the best practices mentioned in the introduction. One best practice suggests choosing prediction problems that can make an impact, and this can be indirectly addressed as the framework does now present the opportunity to efficiently perform a large-scale exploration of various prediction problems (different target populations, outcomes, and times-at-risk) across numerous observational datasets. This enables identification of prediction problems where sufficiently good performance can be achieved, thus making for potentially impactful targets. A second consideration, collaboration, and sharing of research, follows immediately as the purpose of the proposed framework and software is to encourage collaboration. The Transparent Reporting of a multivariable prediction model for Individual Prognosis Or Diagnosis statement furthermore touches on research transparency, and the framework provides open-source software that is fully transparent and promotes model reproducibility. Researchers can even share their models by adding them via the OHDSI GitHub repository. Our framework also explicitly covers the consideration of terminology and methodology standardization, as the framework proposes a standard process that can be followed to develop prediction models and uses existing standard terminologies.
The main limitation of the framework is that it requires researchers to map their data into the OMOP CDM. Although there is minimum information lost,20 the mapping requires time and effort. However, the OHDSI community is already large and rapidly expanding, and the clear advantages of a common data model such as proposed in this research may prompt more researchers towards using a consistent data structure. The power of collaboration leading towards improved predictive models has been highlighted in recent literature. A pre-requisite to do this at large-scale is a uniform process to predictive model development, which we now support through the presented framework.
Our framework proposes a standardised process for model development and standard output, as these are important for both reproducibility and model comparisons. However, we understand that there is ongoing research in the field, so the framework has the flexibility to incorporate new modeling methods or metrics. It is important for the community to be consistent in the way model performances are presented, and this framework aims to ensure consistency, but the framework’s standard output will evolve with the field.
Conclusion
In this paper we propose a standardized framework and introduce open-source software that can work across computer environments to generate patient-level prediction models from observational healthcare data in a manner that is transparent and completely reproducible. As a proof-of-concept, we applied the framework to the problem of predicting 21 different outcomes for the target population of pharmaceutically-treated depression across 4 different databases. The framework succeeds in efficiently developing and evaluating 21 different models in 4 different databases, and standardizing those models so they can be directly applied to any observational data in the CDM structure.
Although several papers propose best practices for predictive model development,5–9 this work is the first to propose an implementation that can enable model transparency and reproducibility. The proposed framework addresses and implements key best practice considerations and encourages researchers to collaborate and share models. It facilitates transportability assessment at scale which will increase the likelihood of model implementation in clinical practice.
Funding
This work was supported by National Science Foundation grant number 1251151.
Competing interests
None.
Contributors
All authors contributed to the conception and design of the work, the analysis, and the interpretation of data for the work. All authors contributed in drafting, revising, and approving the final version.
SUPPLEMENTARY MATERIAL
Supplementary material is available at Journal of the American Medical Informatics Association online.
Supplementary Material
ACKNOWLEDGEMENTS
PR has received a research grant from Janssen Research and Development.
References
- 1. Collins GS, Mallett S, Omar O et al. Developing risk prediction models for type 2 diabetes: a systematic review of methodology and reporting. BMC Med 2011;9:103. [DOI] [PMC free article] [PubMed] [Google Scholar]
- 2. Collins GS, Omar O, Shanyinde M et al. A systematic review finds prediction models for chronic kidney were poorly reported and often developed using inappropriate methods. J Clin Epidemiol 2013;66:268–277. [DOI] [PubMed] [Google Scholar]
- 3. Collins GS, de Groot JA, Dutton S et al. External validation of multivariable prediction models: a systematic review of methodological conduct and reporting. BMC Med Res Methodol 2014;141:1. [DOI] [PMC free article] [PubMed] [Google Scholar]
- 4. Goldstein BA, Navar AM, Pencina MJ et al. Opportunities and challenges in developing risk prediction models with electronic health records data: a systematic review. J Am Med Inform Assoc 2017;241:198–208. [DOI] [PMC free article] [PubMed] [Google Scholar]
- 5. Collins GS, Reitsma JB, Altman DG et al. Transparent reporting of a multivariable prediction model for individual prognosis or diagnosis (TRIPOD): the TRIPOD statement. BMC Med 2015;131:1–9. [DOI] [PMC free article] [PubMed] [Google Scholar]
- 6. Hemingway H, Croft P, Perel P et al. Prognosis research strategy (PROGRESS) 1: a framework for researching clinical outcomes. BMJ 2013;346:e5595. [DOI] [PMC free article] [PubMed] [Google Scholar]
- 7. Riley RD, Hayden JA, Steyerberg EW et al. Prognosis Research Strategy (PROGRESS) 2: prognostic factor research. PLoS Med 2013;102:e1001380. [DOI] [PMC free article] [PubMed] [Google Scholar]
- 8. Steyerberg EW, Moons KG, van der Windt DA et al. Prognosis Research Strategy (PROGRESS) 3: prognostic model research. PLoS Med 2013;102:e1001381. [DOI] [PMC free article] [PubMed] [Google Scholar]
- 9. Hingorani AD, van der Windt DA, Riley RD et al. Prognosis research strategy (PROGRESS) 4: stratified medicine research. BMJ 2013;346:e5793. [DOI] [PMC free article] [PubMed] [Google Scholar]
- 10. Hripcsak G, Duke JD, Shah NH et al. Observational health data sciences and informatics (OHDSI): opportunities for observational researchers. Stud Health Technol Inform 2015;216:574–578. [PMC free article] [PubMed] [Google Scholar]
- 11. Overhage JM, Ryan PB, Reich CG et al. Validation of a common data model for active safety surveillance research. J Am Med Inform Assoc 2012;191:54–60. [DOI] [PMC free article] [PubMed] [Google Scholar]
- 12. Hripcsak G, Ryan PB, Duke JD et al. Characterizing treatment pathways at scale using the OHDSI network. PNAS 2016;11327:7329–7336. [DOI] [PMC free article] [PubMed] [Google Scholar]
- 13. Schuemie MJ, Suchard MA. SqlRender: Rendering Parameterized SQL and Translation to Dialects. R Package Version 1.2.0. 2017. https://CRAN.R-project.org/package=SqlRender. Accessed February 1, 2017. [Google Scholar]
- 14. Schuemie MJ, Suchard MA DatabaseConnector: A Wrapper Around RJDBC Containing Drivers for Various DBMSs. R Package Version 1.10.0. 2017. https://github.com/OHDSI/DatabaseConnector. Accessed February 1, 2017. [Google Scholar]
- 15. Suchard MA, Simpson SE, Zorych I et al. Massive parallelization of serial inference algorithms for complex generalized linear models. ACM Transact Model Comput Simulation 2013;231:10–32. [DOI] [PMC free article] [PubMed] [Google Scholar]
- 16. Deng H, Bai Y, Shantsila A et al. Clinical scores for outcomes of rhythm control or arrhythmia progression in patients with atrial fibrillation: a systematic review. Clin Res Cardiol 2017;10610:813–823. [DOI] [PMC free article] [PubMed] [Google Scholar]
- 17. Schnabel RB, Sullivan LM, Levy D et al. Development of a risk score for atrial fibrillation (Framingham Heart Study): a community-based cohort study. Lancet 2009;373.9665:739–745. [DOI] [PMC free article] [PubMed] [Google Scholar]
- 18. Empana JP, Ducimetière P, Arveiler D et al. Are the Framingham and PROCAM coronary heart disease risk functions applicable to different European populations? The PRIME Study. Eur Heart J 2003;24.21:1903–1911. [DOI] [PubMed] [Google Scholar]
- 19. Weng SF, Reps J, Kai J, Garibaldi JM, Qureshi N. Can machine-learning improve cardiovascular risk prediction using routine clinical data?. PLoS One 2017;12.4:e0174944. [DOI] [PMC free article] [PubMed] [Google Scholar]
- 20. Voss EA, Makadia R, Matcho A et al. Feasibility and utility of applications of the common data model to multiple, disparate observational health databases. J Am Med Inform Assoc 2015;223:553–564. [DOI] [PMC free article] [PubMed] [Google Scholar]
Associated Data
This section collects any data citations, data availability statements, or supplementary materials included in this article.