Abstract
Cerenkov luminescence imaging (CLI) is commonly performed using two-dimensional (2-D) conventional optical imaging systems for its cost-effective solution. However, quantification of CLI comparable to conventional three-dimensional positron emission tomography (PET) is challenging using these systems due to both the high attenuation of Cerenkov radiation (CR) on mouse tissue and nonexisting depth resolution of CLI using 2-D imaging systems (2-D CLI). In this study, we developed a model that estimates effective tissue attenuation coefficient and corrects the tissue attenuation of CLI signal intensity independent of tissue depth and size. To evaluate this model, we used several thin slices of ham as a phantom and placed a radionuclide (89Zr and 64Cu) inside the phantom at different tissue depths and sizes (2, 7, and 12 mm). We performed 2-D CLI and MicroPET/CT (Combined small animal PET and Computed Tomography (CT)) imaging of the phantom and in vivo mouse model after administration of 89Zr tracer. Estimates of the effective tissue attenuation coefficient (μeff) for 89Zr and 64Cu were ∼2.4 and ∼2.6 cm−1, respectively. The computed unit conversion factor to %ID/g from 2-D CLI signal was 2.74 × 10⁻³ μCi/radiance estimated from phantom study. After applying tissue attenuation correction and unit conversion to the in vivo animal study, an average quantification difference of 10% for spleen and 35% for liver was obtained compared to PET measurements. The proposed model provides comparable quantification accuracy to standard PET system independent of deep tissue CLI signal attenuation.
Keywords: molecular imaging, quantitative imaging, Cerenkov luminescence imaging (CLI), Cerenkov radiation, PET
Introduction
Nuclear biomedical imaging is a well-established technique in molecular imaging.1,2 Such techniques include positron emission tomography (PET) and single photon emission computed tomography (SPECT). These instruments through imaging measure the distribution of tracer administrated into a body and provide quantitative information of cellular function and molecular process in living organisms without perturbing their natural status. Hence, their role in biomedical research and clinical application is widespread including drug development, screening, diagnosis, tumor monitoring, and therapy.3-5 In particular, PET is very popular in various basic science research using small animal models standing next to the most frequently used optical in vivo imaging systems such as fluorescence and bioluminescence imaging. Optical imaging systems, in contrast to radionuclide-based imaging, have superior advantages in preclinical imaging due to their lower cost, high temporal resolution, and capability of imaging multiple animals for high-throughput imaging.6 For clinical applications, use of optical imaging systems is still very challenging due to high-light photon absorption and scatter in human body. Overcoming these challenges, some advances on optical imaging have been recently made by positioning the detection instrument near the optical sources as in endoscopy, intraoperative scanning, and breast imaging. Therefore, optical imaging systems may also play a key role in advancing molecular imaging for specific clinical applications.6,7
Cerenkov luminescence imaging (CLI) is potentially a cost-effective imaging system based on Cerenkov radiation (CR), which occurs when a charged particle travels through a dielectric medium at a speed that exceeds the phase velocity of light in that medium.8-11 Typically, these CR optical photons are produced during the initial decay process of some isotopes, many of which are used for PET or SPECT imaging. These CR optical photons can be detected with a sensitive charge-coupled device and converted into optical images (CLI).12-14 Radiotracer imaging with an already existing low-cost optical imaging system could be potentially a cost-effective modality supplementing the high-end PET or SPECT systems for preclinical drug development, screening and possibly also for clinical use. For this reason, CLI using two-dimensional (2-D CLI) systems is recently becoming a topic of interest to many researchers who have independently shown and validated its capability to measure the distribution of various radionuclide tracers, such as 89Zr, 64Cu, 18F, and 131I, for in vivo animal imaging.15-17 Quantitatively, CLI has shown a relatively good correlation with PET in cases of organs that show a high percentage uptake of the injected dose and in proximity to the outer surface of the animal such as kidney, spleen, thymus, and subcutaneous tumors in mouse models.18-20 However, the blue-weighted CR optical photons are highly attenuated by tissue, and thus, the quantitative accuracy of CLI on organs located deeper in tissue is relatively very poor. In addition, for its cost-effective solution, CLI is commonly performed using the existing optical imaging system that only images in 2-D. As a result, large organs such as liver show significantly higher signal due to the contribution of emission of light from thicker organs within the measured region of interest (ROI). These limitations prohibit accurate quantification of 2-D CLI and perform calibration of the CLI signal to be comparable with PET measurements. To overcome these limitations, we have developed a model that first estimates the effective tissue attenuation coefficient and computes tissue attenuation-corrected average signal intensity of 2-D CLI that is quantitatively comparable within the order of magnitude of PET measurements.
Material and Methods
Model Description
The model was used for this study assuming standard diffusion approximation of light propagation in a slab of material (tissue; Figure 1A and B). Light, in this case Cerenkov radiation, when propagating in biological tissue interacts with the tissue both in the form of elastic scattering and absorption. The combined effect of these interactions is expressed using the effective attenuation coefficient, μeff given as19:
| 1 |
Figure 1.
Rectangular slab illustrating sources depth location and depth dimensions within absorbing and scattering tissue medium, showing (A) source at arbitrary depth d with negligible thickness and (B) a source of thickness t at depth location d.
where μa and μ′s are absorption and reduced scattering coefficients, respectively.
Under this assumption and considering the multispectral characteristic, the total integrated radiance at the surface of the slab Is(λ), on the defined ROI, can be computed from the total integral radiance of the source, Io(λ), located at depth d as follows.
| 2 |
In Equation 2, the photon source, Io(λ), is assumed to have an infinite small thickness t (t << d) along the optical path.
For a source with finite depth thickness t (Figure 1B), and background signals, IBk, the total integral radiance measured at the surface results from the sum of Cerenkov radiation emitted at each source depth and is given as:
| 3 |
Assuming top and bottom depth measurements, d 1 and d 2, along the optical path (Figure 1B) and μeff are known a priori, an estimate of average radiance per unit depth of the target source can be determined from Equation 3 as follows:
| 4 |
μeff can be determined a priori experimentally from the phantom study. Thus, Equation 4 expresses background-corrected estimate of true average CLI ROI measurements over an organ independent of depth with the assumption that depth and thickness of the specific organ is estimated a priori. However, in vivo measurement or a priori estimates of depth and thickness of a specific organ along the optical path is slightly challenging. With added cost and imaging time, a more accurate estimate of depth and thickness of an organ of interest can be obtained by performing multimodality imaging such as three-dimensional (3-D) anatomical imaging using computed tomography, ultrasound, and/or magnetic resonance imaging before or after CLI scans. The added cost of these methods will defeat the purpose of 2-D CLI as a potentially cost-effective alternative to PET. Using existing optical imaging systems, in vivo depth estimates can also be performed by applying multispectral imaging techniques as described by Spinelli et al19 for a point source in a homogenous flat slab of tissue. But, the accuracy reported for this method is still very poor with an uncertainty that may range between 10% and 25%.21 Recent development on the 3-D tomography of CLI referred as “Cerenkov luminescence tomography” also indicated the possibility of obtaining relatively accurate depth information using various approaches.22
To simplify the estimates of depth and thickness of some of the typical organs of interest such as liver, heart, kidney, and spleen of mouse, we used an average organ size measurement from ex vivo studies. In this case with only single 2-D CLI scan, an estimate of total radiance at any depth can be measured without adding complexity to the standard low-cost 2-D CLI system. Since size variations of similar organs of an average size mouse is very small, these simplified depth estimates may provide within acceptable range of accuracy required for most of molecular imaging studies using CLI.
Phantom Study
To obtain optical absorption and scattering equivalent to the true biological tissue, we developed a phantom using a stack of slices of ham. The ham slices used as a phantom in this experiment consist of processed muscle and fat of swine, which were assumed to closely mimic the optical properties of the heterogeneous composition of tissue of live laboratory mouse.23 Each slice was cut with similar mouse dimensions of 2.5 cm wide by 10 cm long with a thickness of 1.5-1.7 mm, assumed to be uniform with each slice. For a typical 2 cm height of mouse, a stack consisting about 13 slices of ham was used as shown in Figure 2A. We implanted radioactive sources on the lower half of the ham stack using 2 mL plastic tubes cut into three depths (2, 7, and 12 mm) keeping the open top of the tube in the same depth level as shown in Figure 2B. We filled the tubes with a photon absorbing medium liquid (Liposyn II; Abbott Laboratories, North Chicago, IL) and radioisotopes (89Zr and 64Cu) and covered with a single slice of ham. We then performed MicroPET/CT (Siemens Preclinical Solutions, Knoxville, TN) imaging and CLI on the phantom sequentially. Cerenkov luminescence imaging was performed using IVIS Spectrum System (Perkin-Elmer, Waltham, MA). We performed repeated CLI scans at various depths of tissue (∼1.5, 3.0, 4.5, 6.0, and 7.5 mm) by adding slices of ham on the top of the phantom to estimate the effective attenuation coefficient (μeff). The computed μeff was used to estimate the source light intensity at each specific tissue depth on animal study (section “Animal Study”) from the measured CLI signal at the surface. For validation, we compared the PET and CLI measurements after performing corrections, partial volume correction (PVC) for PET and photon tissue attenuation for CLI, using the proposed model.
Figure 2.
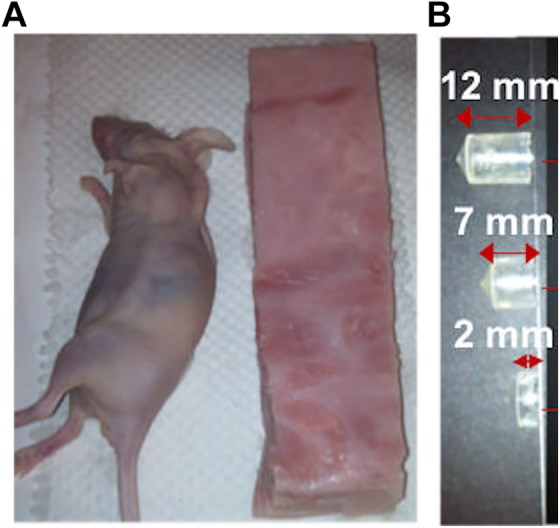
A, Slab of optical tissue equivalent phantom of mouse model consisting of slices of ham of thickness (1.5-1.8 mm). B, Radiotracer sources of 89Zr in Liposyn II absorbing media placed in three different cylindrical containers with an effective depth size of 12, 7, and 2 mm inside the phantom, respectively.
Animal Study
Animal studies were approved by the Stanford University Administrative Panel on Laboratory Animal Care. Transgenic mice expressing the human CD20 (huCD20) were purchased from Genentech (South San Francisco, CA) and housed in static microisolator cages in the Association for Assessment and Accreditation of Laboratory Animal Care-approved animal care facility. Prior to the animal study, huCD20 transgenic mice were screened to confirm the expression of CD20+ targets in the spleen by reverse transcription polymerase chain reaction. An anti-hCD20 tracer was prepared, 89Zr-rituximab.24 The tracer was administered in huCD20-expressing transgenic mice (n = 4). The tracer was expected to target specifically the spleen, where most CD20+ B cells were homing. After tracer, administration animals were scanned using both PET and CLI at various time points (24, 48, 72, 96, 120, and 140 hours). After imaging, ROI analysis was performed by drawing ROI on the spleen, liver, and background. We then applied the proposed model on the extracted ROI value to correct the CLI measurements using experimentally determined μeff (section “Estimate of Tissue Attenuation Coefficient”).
Results
Figure 1 illustrates the tissue attenuation model and Figure 2 describes the phantom used for this study, a stack of slices of ham emulating tissue attenuation in mouse models.
Estimate of Tissue Attenuation Coefficient
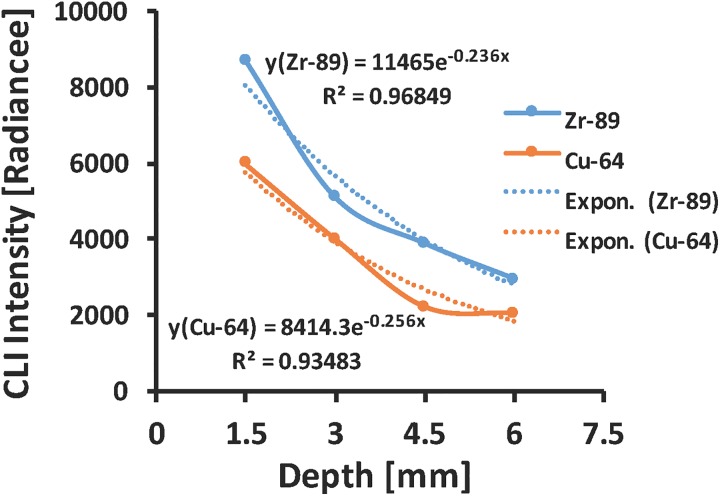
Attenuation of light in deep biological tissue depends on the combined effect of light absorption and scattering in tissue. This combined effect is expressed using inverse exponential power law that is usually referred to as Beer-Lambert Law given in Equation 1 above. Figure 3 shows the plot of CLI light intensity transmitted through layers of ham tissue forming different tissue depth thickness along the optical path of source and charge coupled device (CCD) camera. Exponential fit to the experimental data provides an estimate of the effective tissue attenuation coefficient (μeff) for both isotopes used in this study (∼2.4 cm−1 for 89Zr and ∼2.6 cm−1 for 64Cu).
Figure 3.
Exponential fit curve of Cerenkov luminescence imaging signal for 89Zr and 64Cu isotopes detected as a function of tissue depth used to estimate the average effective tissue attenuation coefficient.
Model Validation
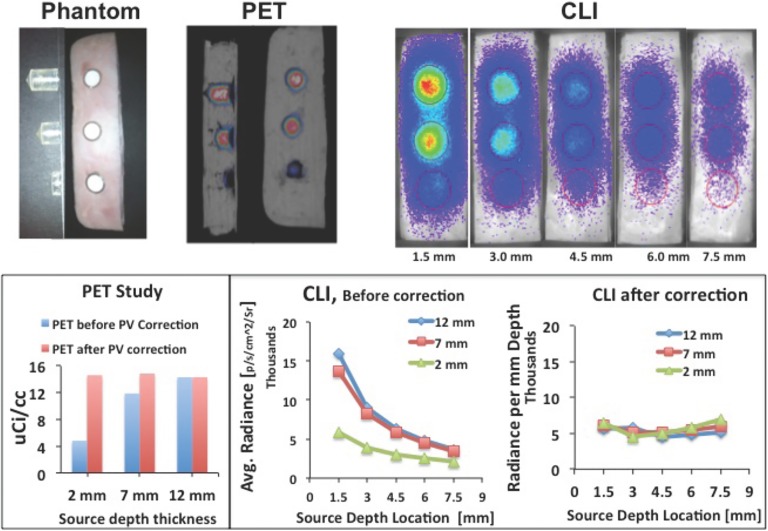
Comparison of PET and CLI analyses before and after correction is summarized in Figure 4. Due to low resolution and partial volume effect, PET shows (Figure 4, top) signal reduction for small thickness of sources, which have been corrected using a recovery coefficient method for PVC.25 CLI signal is highly attenuated by tissue, which also has been corrected using the proposed method (Figure 4, bottom). After correction, quantitative measurement for both PET and CLI shows relatively uniform signal intensity independent of tissue depth and source depth size (thickness). From this study, an estimate of unit conversion factor was also computed to convert the CLI measurements given in radiance (p/s/cm2/Sr) to the standard PET measurements given in units of μCi/cc (or %ID/g). The estimated unit conversion factor for this study using 89Zr radioisotope was 2.74 × 10⁻³μCi/radiance. Note that different isotopes give different CR light yields,7 which we should expect a different conversion factor for each isotope that must be computed separately.
Figure 4.
Top: Sample of MicroPET/CT images and PET quantitative measurements with and without partial volume correction, Bottom: Cerenkov luminescence imaging (CLI) at different depths and quantification of CLI signal before and after tissue attenuation correction using the proposed model.
Animal Study
Estimates of depth and thickness of each organ of interest (spleen and liver) were taken from ex vivo studies. Table 1 shows mean (n = 4) values of thickness and depth of spleen and liver as measured from the top surface of the mouse. The organs were harvested from each mice with a similar weight of 25 ± 2 g).
Table 1.
Mean (n = 4) Values of Thickness and Depth of Spleen and Liver Measured From the Top of a Mouse After Its Placement on the Scanner.
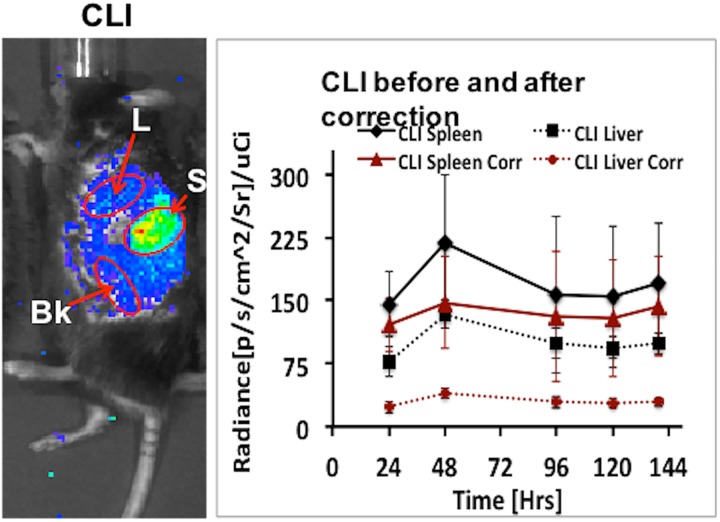
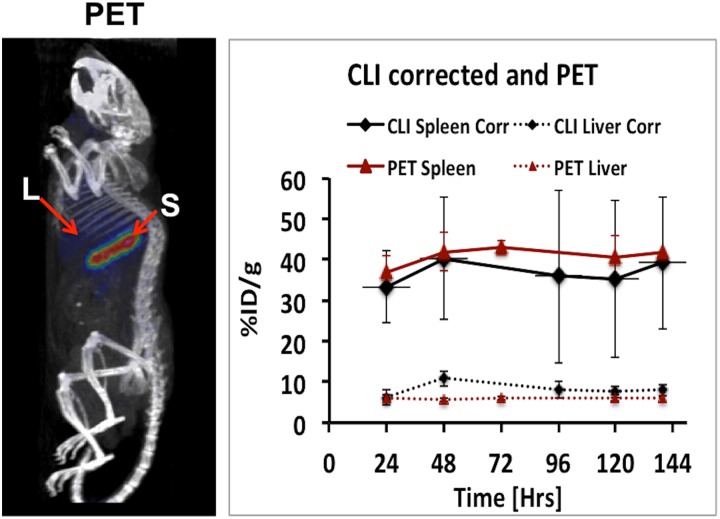
Figure 5 shows the result comparing the CLI measurements before and after correction. There is a notable difference in CLI signal before and after correction especially for liver due to its large organ depth size (thickness). Figure 6 shows the quantitative comparison between PET and CLI measurements. In order to compare CLI with PET, we converted the corrected CLI signal to %ID/g using the conversion factor computed in section “Model Validation” and dividing it by the decay-corrected injected dose at each time point. After correction, we obtained an average quantification difference between PET and CLI values of less than 10% for spleen and 35% for liver, respectively.
Figure 5.
Left: Cerenkov luminescence imaging (CLI) of mouse model for spleen vs liver uptake study, Right: CLI quantification at different time point before and after tissue attenuation correction using the proposed model.
Figure 6.
Left: positron emission tomography (PET) image of the same animal used for Cerenkov luminescence imaging (CLI). Right: Comparison of PET with tissue attenuation corrected CLI and after converted to %ID/g using the calibration factor obtained from phantom study.
Discussion and Conclusion
In previous studies, we presented the application of CLI for non-Hodgkin lymphoma imaging using the long half-life 89Zr-rituximab tracer developed for PET with a humanized transgenic mouse model that expresses human CD20 in the spleen.17 In the study, we also showed the correlation of CLI with PET quantitatively to evaluate its efficacy compared to PET. The result indicated that CLI with standard nontomography 2-D images could provide a good correlation with the 3-D tomography PET scans especially for organs located near the top surface of the mouse facing the CCD camera such as spleen. Similar other studies also confirmed the correlation of CLI with PET and its dynamic sensitivity for its capability to provide low-cost alternative to PET instrument,12,13,15,18 which is the main driving force for many research studies on this new emerging imaging modality. According to many of these studies, CLI has a good potential for many application supplementing the high-end PET instrument. One of the most common applications is to use CLI as a low-cost high-throughput precursor or validation for PET studies in vivo. Another major application is for cost-effective screening of a large variety of radiopharmaceuticals in the drug development research.26 Some clinical applications are also proposed, for example, in intraoperative or endoscopic imaging or therapy of targeted structures in human body.27 In order to fully take advantage of CLI as a high-throughput low-cost alternative to PET applications, it is also important for CLI to provide comparable quantitative measurements with PET beyond mere correlation.
In this study, a CLI signal attenuation model is developed to correct the CLI signal intensity emission from tissue depth quantitatively. We demonstrated that using this model, relatively accurate CLI signal intensity per unit depth could be estimated that inherently is difficult to measure from conventional ROI analysis performed by drawing ROIs on 2-D CLI images alone (Figures 4 and 5). The heterogeneity and variation of optical properties on different organs or tissue type of mouse such as skin, fat, muscle and bone, and optical boundaries along the light path, which is not considered on our simplified phantom (Figure 2), may limit the accuracy and applicability of this method. In addition, we observed a slight overcorrection at a deeper depth (Figure 4), which may be due to low light penetrating the tissue due total absorption and scattering outside the defined ROI. Since this was not properly considered on the model used, it also adds some limitations of the accuracy of the model at a deeper depth (>0.5 cm) from top surface.
CLI is limited in its scope applications compared to conventional PET imaging due to high tissue photon attenuation, hence the proposed or similar simplified methods may provide PET equivalent quantitative radiotracer distribution measurements within the limited CLI applications in small animal models such as tumor or other shallow tracer uptake monitoring. This ability to compute PET equivalent quantitative measurement combined with the advantage of long half-life radiotracers such as 89Zr and 64Cu may allow alternative quantitative CLI imaging to PET in places, where PET systems are not available due to high-cost or other logistic reasons.
Acknowledgments
We would like to acknowledge the small animal facility at Stanford for the imaging and data analysis support. We would like to thank also Dr. Timothy C. Doyle for helpful discussion and manuscript review.
Footnotes
Declaration of Conflicting Interests: The author(s) declared no potential conflicts of interest with respect to the research, authorship, and/or publication of this article.
Funding: The author(s) disclosed receipt of the following financial support for the research, authorship, and/or publication of this article: This work was supported by the National Cancer Institute grant support ICMIC P50CA114747 (SSG).
References
- 1. Ahn BC. Applications of molecular imaging in drug discovery and development process. Curr Pharm Biotechnol. 2011;12(4):459–468. [DOI] [PubMed] [Google Scholar]
- 2. kobayashi H, Longmire MR, Ogawa M, Choyke PL. Rational chemical design of the next generation of molecular imaging probes based on physics and biology: mixing modalities, colors and signals. Chem Soc Rev. 2011;40(9):4626. [DOI] [PMC free article] [PubMed] [Google Scholar]
- 3. Hillner BE, Siegel BA, Shields AF, et al. The impact of positron emission tomography (PET) on expected management during cancer treatment: findings of the national oncologic PET registry. Cancer. 2009;115(2):410–418. [DOI] [PubMed] [Google Scholar]
- 4. Matthews PM, Rabiner EA, Passchier J, Gunn RN. Positron emission tomography molecular imaging for drug development.Br J Clin Pharmacol. 2012;73(2):175–86. [DOI] [PMC free article] [PubMed] [Google Scholar]
- 5. Meng Q, Li ZCP. Molecular imaging probes for diagnosis and therapy evaluation of breast cancer. Int J Biomed Imaging. 2013;2013:230487. [DOI] [PMC free article] [PubMed] [Google Scholar]
- 6. Luker GD, Luker KE. Optical imaging: current applications and future directions. J Nucl Med. 2008;49(1):1–4. [DOI] [PubMed] [Google Scholar]
- 7. Beattie BJ, Thorek DL, Schmidtlein CR, Pentlow KS, Humm JL, Hielscher AH. Quantitative modeling of Cerenkov light production efficiency from medical radionuclides. PloS One. 2012;7(2):e31402. [DOI] [PMC free article] [PubMed] [Google Scholar]
- 8. Cerenkov P. Visible radiation produced by electron moving in a medium with velocities exceeding that of light. Phys Rev. 1937;52(4):378–379. [Google Scholar]
- 9. Mitchell GS, Gill RK, Boucher DL, Li C, Cherry SR. In vivo Cerenkov luminescence imaging: a new tool for molecular imaging. Philos Trans A Math Phys Eng Sci. 2011;369(1955):4605–4619. [DOI] [PMC free article] [PubMed] [Google Scholar]
- 10. Ackerman NL, Graves EE. The potential for cerenkov luminescence imaging of alpha-emitting radionuclides. Phys Med Biol. 2012;57(3):771–783. [DOI] [PMC free article] [PubMed] [Google Scholar]
- 11. Boschi F, Meo SL, Rossi PL, Calandrino R, Sbarbati A, Spinelli AE. Optical imaging of alpha emitters: simulations, phantom, and in vivo results. J Biomed Opt. 2011;16(12):126011. [DOI] [PubMed] [Google Scholar]
- 12. Ruggiero A, Holland JP, Lewis JS, Grimm J. Cerenkov luminescence imaging of medical isotopes. J Nucl Med. 51(7):1123–1130. [DOI] [PMC free article] [PubMed] [Google Scholar]
- 13. Robertson R, Germanos MS, Manfredi MG, Smith PG, Silva MD. Multimodal imaging with 18F-FDG PET and cerenkov luminescence imaging after MLN4924 treatment in a human lymphoma xenograft model. J Nucl Med. 2011;52(11):1764–1769. [DOI] [PubMed] [Google Scholar]
- 14. Xu Y, Liu H, Cheng Z. Harnessing the power of radionuclides for optical imaging: cerenkov luminescence imaging. J Nucl Med. 2011;52(12):2009–2018. [DOI] [PubMed] [Google Scholar]
- 15. Xu Y, Liu H, Chang E, Jiang H, Cheng Z. Cerenkov luminescence imaging (CLI) for cancer therapy monitoring. J Vis Exp. 2012;(69):e4341. [DOI] [PMC free article] [PubMed] [Google Scholar]
- 16. Zhong J, Qin C, Yang X, Zhu S, Zhang X, Tian J. Cerenkov luminescence tomography for in vivo radiopharmaceutical imaging. Int J Biomed Imaging. 2011;2011:641618. [DOI] [PMC free article] [PubMed] [Google Scholar]
- 17. Natarajan A, Habte F, Liu H, et al. Evaluation of 89Zr-rituximab tracer by Cerenkov luminescence imaging and correlation with PET in a humanized transgenic mouse model to image NHL. Mol Imaging Biol. 2013;15(4):468–475. [DOI] [PubMed] [Google Scholar]
- 18. Liu H, Ren G, Miao Z, et al. Molecular optical imaging with radioactive probes. PloS One. 2010;5(3):e9470. [DOI] [PMC free article] [PubMed] [Google Scholar]
- 19. Spinelli A, D’Ambrosio D, Calderan L, Marengo M, Sbarbati A, Boschi F. Cerenkov radiation allows in vivo optical imaging of positron emitting radiotracers. Phys Med Biol. 2009;55(2):483–495. [DOI] [PubMed] [Google Scholar]
- 20. Li C, Mitchell GS, Cherry SR. Cerenkov luminescence tomography for small animal imaging. Opt Lett. 2010;35(7):1109–1111. [DOI] [PMC free article] [PubMed] [Google Scholar]
- 21. Coquoz O, Troy TL, Jekic-McMullen D, Rice BW. Determination of depth of in vivo bioluminescent signals using spectral imaging techniques. Proc. SPIE 4967. 2003;37–45. [Google Scholar]
- 22. Spinelli AE, Kuo C, Rice BW, et al. Multispectral Cerenkov luminescence tomography for small animal optical imaging. Opt Express. 2011;19(13):12605–12618. [DOI] [PubMed] [Google Scholar]
- 23. Pogue BW, Patterson MS. Review of tissue simulating phantoms for optical spectroscopy, imaging and dosimetry. 2006;11(4):041102 (1083-3668 (Print)). [DOI] [PubMed] [Google Scholar]
- 24. Spinelli AE, Boschi F. Optimizing in vivo small animal Cerenkov luminescence imaging. J Biomed Opt. 2012;17(4):040506. [DOI] [PubMed] [Google Scholar]
- 25. Srinivas S, Dhurairaj T, Basu S, Bural G, Surti S, Alavi A. A recovery coefficient method for partial volume correction of PET images. Ann Nucl Med. 2009;23(4):341–348. [DOI] [PubMed] [Google Scholar]
- 26. Lewis MA, Kodibagkar VD, Öz OK, Mason RP. On the potential for molecular imaging with Cerenkov luminescence. Opt Lett. 2010;35(23):3889–3891. [DOI] [PMC free article] [PubMed] [Google Scholar]
- 27. Grootendorst MR, Cariati M, Kothari A, Tuch DS, Purushotham A. Cerenkov luminescence imaging (CLI) for image-guided cancer surgery. Clin Transl Imaging. 2016;4(5):353–366. [DOI] [PMC free article] [PubMed] [Google Scholar]


