

SUMMARY
Noroviruses can establish chronic infections with active viral shedding in healthy humans but whether persistence is associated with adaptive immune dysfunction is unknown. We used genetically engineered strains of mouse norovirus (MNV) to investigate CD8+ T cell differentiation during chronic infection. We found that chronic infection drove MNV-specific tissue-resident memory (Trm) CD8+ T cells to a differentiation state resembling inflationary effector responses against latent cytomegalovirus with only limited evidence of exhaustion. These MNV-specific Trm cells remained highly functional yet appeared ignorant of ongoing viral replication. Pre-existing MNV-specific Trm cells provided partial protection against chronic infection but largely ceased to detect virus within 72 hours of challenge, demonstrating rapid sequestration of viral replication away from T cells. Our studies revealed a strategy of immune evasion by MNV via the induction of a CD8+ T cell program normally reserved for latent pathogens and persistence in an immune-privileged enteric niche.
Keywords: Norovirus, enteric viral persistence, T cell inflation, T cell exhaustion, tissue-resident memory T cells
IN BRIEF
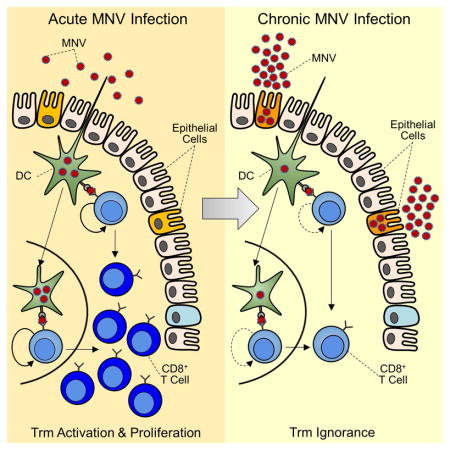
Chronic infections often cause T cell dysfunction, but how noroviruses (NV) evade immunity is unknown. Tomov et al. show that gut-resident T cells against NV remain functional but ignorant of chronic viral replication, suggesting that NV persists in an immune-privileged enteric niche.
INTODUCTION
Noroviruses (NVs) are major global pathogens that cause an estimated 267 million infections and 200,000 deaths each year (Debbink et al., 2012). Vaccine efforts have shown promise, but complete protection against homologous challenge has not been achieved (Atmar et al., 2011). Moreover, volunteer and epidemiologic studies have generated conflicting data regarding the durability and protective capacity of NV immunity, while recent reports of persistent NV shedding by immunocompetent individuals have challenged the traditional view of NVs as acute and self-limited pathogens (Karst et al., 2014). These data suggest the existence of viral mechanisms of immune evasion, however the immunological determinants of NV clearance versus persistence remain poorly understood. Most studies have used antibodies as markers of pre-existing NV immunity and have shown that, depending on the setting, such responses are neither necessary nor sufficient for protection (Atmar et al., 2011). In contrast, cellular immunity, particularly at mucosal sites, remains largely unexplored.
We and others have used the mouse model of NV infection (MNV) to study MNV clearance versus persistence (Tomov et al., 2013). Early studies showed that all aspects of adaptive immunity are required for clearance of the non-persisting strain MNV-CW3 (Karst et al., 2014). On the other hand, a related strain, MNV-CR6, causes chronic infection even in immunocompetent mice. Recent studies have shown that MNV-CR6 persistence depends on the enteric microbiota and can be prevented by pre-treating mice with antibiotics (Baldridge et al., 2015; Jones et al., 2014). Whether these findings reflect direct bacterial-viral interactions (Kuss et al., 2011) or commensal modulation of the host antiviral immune response (Abt et al., 2012) remains to be defined. In addition, persistent MNV-CR6 infection can be cleared by exogenous interferon-lambda (Nice et al., 2015), however this phenomenon is mediated by innate immunity and does not afford protection against subsequent re-challenge with the same strain. Thus, adaptive immune responses will be necessary to achieve durable immunity against MNV.
A key challenge to understanding MNV persistence is our limited knowledge of the host-pathogen interactions responsible for immune failure during chronic infection. Myeloid cells, B cells, and epithelial cells can support mouse and/or human NV replication in cell culture (Ettayebi et al., 2016; Jones et al., 2014), but the relevance of these cell types to persistence in vivo is unclear, and the precise cellular identity and anatomical location of the viral reservoir remain unknown. The identification of CD300lf as an MNV cellular receptor is a major step towards addressing this issue (Orchard et al., 2016). However, it is unclear whether CD300lf is sufficient to explain viral replication during established chronic infection as CD300lf expression is largely restricted to dendritic cells (DCs) (Gasiorowski et al., 2013) but persisting MNV-CR6 replicates in nonhematopoietic cells in vivo (Nice et al., 2015).
In previous studies, we demonstrated that the non-persisting strain MNV-CW3 induces robust virus-specific CD8+ T cell responses in the intestine (Tomov et al., 2013). In contrast, infection with the persisting strain MNV-CR6 is associated with substantially fewer and less-functional virus-specific CD8+ T cells, suggesting that suboptimal T cell responses may contribute to viral persistence (Tomov et al., 2013). However, as the sequence of the immunodominant P1519 epitope differs between these two MNV strains, it was unclear whether the weak CD8+ T cell response to MNV-CR6 was due to intrinsic CD8+ T cell dysfunction or suboptimal epitope binding. In the current study, we have addressed this issue by engineering acute and chronic MNV strains that share the same immunodominant CD8+ T cell epitope. Using these strains, we demonstrate that improving the magnitude of the primary CD8+ T cell response did not prevent viral persistence. Moreover, virus-specific CD8+ T cells from chronic MNV infection developed a distinct transcriptional and phenotypic signature compared to memory CD8+ T cells generated during acutely-resolved infection. These cells showed strong similarity to inflationary effector CD8+ T cells responding to mouse cytomegalovirus (MCMV) infection. Consistent with these transcriptional features, virus-specific CD8+ T cells from chronic MNV infection remained responsive to antigen upon re-exposure, indicating that they retained functionality. MNV-specific memory CD8+ T cells mediated initial protection from challenge with a persisting MNV strain but in most cases this protection was short-lived. Analysis of early events following challenge of immunized mice revealed a marked deficiency in the ability of MNV-specific CD8+ T cells to respond to the chronic strain of MNV. Rather, during chronic infection, MNV-specific CD8+ T cells were largely ignorant of ongoing viral replication in vivo. Moreover, MNV-specific CD8+ T cells also failed to respond in vitro when co-cultured with intestinal cells from chronically infected mice unless the intestinal cells were first lysed to release antigen. Collectively our findings show that MNV persistence was associated with a unique differentiation state of virus-specific CD8+ T cells. While such cells could, in some settings, confer protection against MNV, T cell ignorance emerged early during chronic infection, likely due to the establishment of an immunoprivileged enteric niche that supported long-term viral replication. These findings further provide an explanation for the emergence of chronic NV infections and may help explain heterogeneous responses in humans.
RESULTS
Single amino acid determines the magnitude and function of MNV-specific CD8+ T cells
We previously mapped a conserved immunodominant epitope (P1519) that accounts for ~80% of the total CD8+ T cell response against MNV (Figure S1A, and (Tomov et al., 2013)). However, P1519 differs at position 7 between strains CW3 (Tyr) and CR6 (Phe), preventing direct comparison of epitope-specific CD8+ T cell responses. To address this issue, we changed position 7 in P1519 from Tyr to Phe (Y→F) or Phe to Tyr (F→Y) in MNV-CW3 and MNV-CR6, respectively, generating recombinant strains CR6F→Y and CW3Y→F (Figure 1A). These reverse engineered viruses grew with normal kinetics in the mouse macrophage-like RAW-264.7 cell line indicating that the changes in P1519 did not affect viral fitness in vitro (Figure 1B).
Figure 1. CD8+ T cell responses are generated against wild-type and mutant MNV strains.

(A) Sequence of epitope P1519 in the wild-type and mutant MNV strains used in this study. (B) RAW-264.7 cells were infected with the indicated MNV strains at a multiplicity of infection (MOI) of 0.1 and viral load in the culture medium was measured by qPCR at the indicated time points. Representative of 3 experiments with 2 replicates per experiment. (C) Mice were infected orally with the indicated MNV strains and P1519-specific CD8+ T cells enumerated on day 8 p.i. in the indicated tissues. (D) Summary of data from (C). Representative of 3 experiments with 5 mice per group. (E) Percent of Tet+CD8+ T cells among splenic CD44hiCD62LloCD8+ T cells responding to MNV. Error bars indicate standard error of the mean (SEM). *Unpaired t-test (p<0.05). (F) Magnitude and (G–H) cytokine production and coproduction by intestinal Tet+CD8+ T cells at day 41 p.i. with MNV-CR6WT or MNV-CR6F→Y. Colors in (H) represent number of chemokines or cytokine coproduced. (I) Shedding and (J) tissue titers of wild-type and mutant viruses measured by qPCR. Error bars show SEM. Representative of 3 experiments with 5 mice per group. (K) Granzyme B expression and (L) in vitro cell killing by Tet+CD8+ T cells induced by MNV-CW3WT or MNV-CR6F→Y. (M) P1519 sequences from stool of chronically infected mice. See also Figures S1 and S2.
At day 8 p.i., mice infected with MNV-CW3Y→F had significantly fewer P1519 Tetramer-positive (Tet+) CD8+ T cells in the intestine compared to MNV-CW3WT-infected mice (Figure 1C). Conversely, infection with MNV-CR6F→Y resulted in a substantial boost in virus-specific CD8+ T cell responses with numbers of Tet+CD8+ T cells in the intestine approaching those from MNV-CW3WT infection (Figure 1C–D). Similar changes were observed in the spleen where P1519-specific CD8+ T cells accounted for ~50–75% of the MNV-induced CD44hiCD62Llo CD8+ T cells for MNV-CW3WT and MNV-CR6F→Y, compared to 20–30% for MNV-CR6WT and MNV-CW3Y→F (Figure 1E). Moreover, the difference in the Tet+CD8+ T cell response between MNV-CR6WT and MNV-CR6F→Y persisted long-term (Figure 1F). Tet+CD8+ T cells responding to MNV-CR6F→Y produced more cytokine and were more polyfunctional (i.e. co-produced cytokines more efficiently) compared to Tet+CD8+ T cells from MNV-CR6WT-infected mice (Figures 1G, H; Figure S1B). Conversely, MNV-CW3Y→F induced Tet+CD8+ T cells with less polyfunctionality compared to MNV-CW3WT (Figure S1B). Moreover, the changes in P1519 did not inadvertently create a CD4+ T cell epitope (Figure S1C) or affect the overall antibody response (Figure S1D). Thus, position 7 of P1519 determines both the magnitude and quality of the CD8+ T cell response without affecting other aspects of adaptive immunity against MNV.
MNV persistence versus clearance is independent of the CD8+ T cell response
To determine the effect of P1519-specific CD8+ T cells on MNV persistence, viral RNA was measured in the stool and intestine following infection with the parental and epitope-swap strains. MNV-CW3WT and MNV-CW3Y→F were efficiently cleared by ~day 10 p.i. (Figure 1I, J). By contrast, MNV-CR6F→Y established chronic infection indistinguishably from the parental CR6WT strain (Figure 1I, J). Moreover, Tet+CD8+ T cells responding to persisting MNV-CR6F→Y maintained high expression of granzyme B and retained their cytotoxic potential at day 30 p.i. (Figure 1K, L), suggesting that exhaustion did not contribute to MNV persistence. Changes in P1519 did not impact CD4+ or regulatory T cell (Treg cell) responses (Figure S2A–C). Thus, MNV-CW3WT and CR6F→Y elicit similar adaptive immune responses and can be used to directly compare CD8+ T cells against the same epitope in acute versus chronic infection. Moreover, epitope reversion did not explain MNV-CR6F→Y persistence as the F→Y mutation was maintained even after 6 months of chronic infection (Figure 1M). Together these observations indicated that an augmented primary CD8+ T cell response did not exert immune pressure on MNV-CR6F→Y and was not sufficient to prevent persistence.
Distinct transcriptional profiles of Tet+CD8+ T cells in acute versus chronic MNV infection
We compared the transcriptional profiles of intestinal Tet+CD8+ T cells from mice infected with MNV-CW3WT or MNV-CR6F→Y where the same epitope was being targeted. At day 30 p.i., 423 genes were differentially expressed by at least 2-fold (ANOVA p value <0.05). Among genes upregulated during MNV-CR6F→Y infection were some with known roles in CD8+ T cell differentiation such as Itga2, Il12rb2, Cxcl10, and Fas, and others encoding the inhibitory molecules 2B4, Tim-3 and KLRG1 (Figure 2A). Genes that were downregulated during MNV-CR6F→Y infection included Il2, Sipr1, Tcf7, Lef1, Btla, Cxcr4, Slamf6, Ly6c2, Cd40lg, Klrk1, and Pdcd1 (Figure 2A).
Figure 2. Distinct transcriptional profiles of MNV-specific CD8+ T cells arise in acute versus chronic infection.

Mice were infected orally with MNV-CW3WT or MNV-CR6F→Y and at day 30 p.i. Tet+CD8+ T cells were sorted from intestinal epithelium and analyzed by microarray. (A) Genes differentially expressed by at least 2-fold in Tet+CD8+ T cells from the 2 infections (ANOVA P value <0.05). (B–C) Enrichment of gene sets defined by Gene Ontology (GO) term in Tet+CD8+ T cells. Parts A–C represent 3–4 biological replicates per group, and each biological replicate consists of pooled cells from 5 individual mice. (D) Protein expression for several differentially expressed genes from (A). Representative of 2 independent experiments with 4 mice per group.
Gene set enrichment analysis (GSEA) using gene ontology (GO) terms indicated that Tet+CD8+ T cells from chronically-infected mice were mitotically and metabolically active and upregulated genes involved in cell division, aerobic respiration, and lipid metabolism (Figure 2B). On the other hand, Tet+ memory CD8+ cells from resolved MNV-CW3WT infection upregulated genes associated with adaptive immune responses, T cell receptor (TCR) signaling, and cytokine production (Figure 2C). Thus, despite responding to the same epitope, CD8+ T cells induced during MNV-CW3WT versus MNV-CR6F→Y infection developed distinct metabolic and proliferative transcriptional programs.
Consistent with previous analyses (Tomov et al., 2013), expression of Pdcd1 encoding the inhibitory receptor PD-1, was lower in Tet+CD8+ T cells from chronic compared to resolved MNV infection. Another gene associated with T cell exhaustion, Btla, showed a similar pattern of relative expression (Figure 2A). On the other hand, genes for the inhibitory receptors 2B4 (Cd244) and Tim3 (Havcr2) were upregulated in Tet+CD8+ T cells from MNV-CR6F→Y infection, as was KLRG-1 (Figure 2A). Moreover, protein expression correlated with transcriptional differences for a number of differentially transcribed genes (Figure 2D). In sum, these data indicate an unusual differentiation state of MNV-specific CD8+ T cells compared to typical exhausted CD8+ T cells defined in studies of chronic LCMV and HIV infection (Wherry and Kurachi, 2015).
Distinct tissue resident CD8+ T cell subsets exist in acute versus chronic MNV infection
We have previously noted differences in the expression of several integrins on Tet+CD8+ T cells from acute versus chronic MNV infection (Tomov et al., 2013). Gene expression analysis confirmed 1.97-fold higher expression of Itgae (encoding CD103) in Tet+CD8+ T cells from MNV-CR6F→Y infection (ANOVA P value <0.05). As CD103 is a marker of tissue residence (Carbone et al., 2013), we conducted additional analyses for expression of tissue residence memory (Trm) cell genes and proteins. At day 30 post MNV-CW3WT infection, a significant fraction of Tet+CD8+ T cells from the lamina propria (LP) and intraepithelial (IEL) compartments remained CD103lo (Figure 3A). By contrast, most Tet+CD8+ T cells from the small intestine and colon of mice infected with MNV-CR6F→Y were CD103hi (Figure 3A–B) consistent with previous observations for MNV-CR6WT (Tomov et al., 2013). The ratio of CD103hi to CD103lo Tet+ CD8+ T cells remained constant during MNV-CW3WT infection, but shifted to a predominantly CD103hi phenotype with MNV-CR6F→Y (Figure 3C). In contrast to CD103, CD11a and CD49d were more highly expressed on Tet+CD8+ T cells from MNV-CW3WT compared to MNV-CR6F→Y infection (Figure 3D), consistent with differences between the WT strains (Tomov et al., 2013). Therefore, the distinct pattern of α-integrin expression by Tet+CD8+ T cells responding to MNV-CR6F→Y is attributable to chronic infection rather than the F→Y change in P1519.
Figure 3. Virus-specific Trm cells are generated following infection with acute or chronic strains of MNV.

(A–B) Expression of CD103 and CD69 on Tet+CD8+ T cells in the small intestine and colon at day 30 p.i. with MNV-CW3WT or MNV-CR6F→Y. (C) Summary of data from (A). Error bars show SEM. (D) Expression of CD11a and CD49d on Tet+CD8+ T cells at day 30 p.i. with MNV-CW3WT or MNV-CR6F→Y. A–D are representative of 3 experiments with 5 mice per group. (E) MNV-CW3WT-infected mice were injected i.v. with anti-CD8α to label blood accessible cells. Three minutes later, tissues were harvested and labeled (blood-accessible) and unlabeled (tissue) CD8α+ T cells analyzed. The fraction of CD8+ T cells inaccessible to i.v. staining is shown in the green gates and numbers. (F) The fraction of CD103lo Tet+CD8+ T cells among non-circulating CD8+ T cells was enumerated. Gated on CD8α−(green gate) cells from (E). E–F are representative of 2 experiments with 5 mice per group. (G–I) Enrichment for Trm cell signature genes in Tet+CD8+ Tells from MNV-CW3WT versus MNV-CR6F→Y infection at indicated times p.i. (J) Core enrichment genes for (G) and (I). (K) Viral shedding and (L) titers in mice infected with MNV-CW3WT, MNV-CR6F→Y, or both. (M) Mean fluorescence intensity of CD103 on Tet+ cells from the LP in (K). K–M are representative of 2 experiments with 5 mice per group. *Unpaired t-test (p<0.05). Error bars show SEM. See also Figure S3.
Upregulation of CD103 is not an absolute requirement for tissue residence and CD103lo Trm cells are critical for control of some enteric pathogens (Bergsbaken and Bevan, 2015). Alternatively, the CD103lo Tet+CD8+ T cells from MNV-CW3WT-infected mice might be recirculating T cells rather than true Trm cells (Carbone et al., 2013). To distinguish between these possibilities, we used intravascular staining for CD8α (Beura et al., 2015), which distinguished between anatomic compartments with different access to the circulation (Figure 3E, CD8α+ vs. CD8α− cells). In the intestine, 99% of CD8+ LPL and IEL were inaccessible to the i.v. administered antibody indicating that they were not from blood contamination (Figure 3E, green gates). Furthermore, these gut-associated lymphocytes contained both CD103lo and CD103hi Tet+ cells, suggesting that both CD103-defined subsets were Trm cells (Figure 3F).
To further investigate MNV-specific CD8+ T cell tissue residence, we applied GSEA using a Trm cell signature (Mackay et al., 2013). As expected, Trm cell genes were enriched in intestinal relative to splenic Tet+CD8+ T cells at all time points for both viruses (Figure S3). Comparison of enteric Tet+CD8+ T cells from MNV-CW3WT versus MNV-CR6F→Y showed a more prominent Trm cell program induced early during acutely-cleared infection (Figure 3G). By day 15, this enrichment bias was no longer evident (Figure 3H), while by day 30 p.i., the Trm cell signature was more highly enriched in Tet+CD8+ T cells from MNV-CR6F→Y infection (Figure 3I). Although at day 8 p.i. Trm cell signature enrichment was driven by 12 core genes, only 5 genes contributed at day 30 p.i. (Figure 3J). Therefore Tet+CD8+ T cells from either infection upregulated Trm cell-associated genes but in the case of MNV-CR6F→Y induction of the Trm cell program appeared to be delayed.
Next, we used a MNV-CW3WT and MNV-CR6F→Y coinfection model. We reasoned that if the timing of Trm cell differentiation was important for the outcome of infection, either MNV-CW3WT would induce early Trm cells leading to control of the co-infecting MNV-CR6F→Y or co-infection with MNV-CR6F→Y would suppress Trm cell differentiation. Coinfected mice developed chronic infection with indistinguishable kinetics from mice infected with MNV-CR6F→Y alone indicating that MNV-CW3WT failed to induce a protective CD8+ T cell response (Figure 3K, L). Moreover, at day 30 both persistently infected mice from the MNV-CR6F→Y alone and the co-infected group had higher expression of CD103 on Tet+CD8+ cells compared to resolved MNV-CW3WT infection (Figure 3M). Thus, although CD8+ T cells are necessary for clearance of MNV-CW3WT (Chachu et al., 2008), these cells failed to prevent viral persistence in the setting of coinfection. Moreover, the persisting MNV strain determined the long-term phenotype of Tet+CD8+ T cells. Thus, a distinct viral mechanism of immune evasion, rather than intrinsic CD8+ T cell dysfunction enables MNV-CR6F→Y persistence.
Persistent MNV infection induces a unique transcriptional program in Tet+CD8+ T cells
Next, we defined transcriptional signatures of CD8+ T cells responding to persisting or resolved MNV infection using differentially expressed genes at day 30 p.i. (Figure 2A). We tested for enrichment of these MNV signatures in the transcriptional profiles of CD8+ T cells from acute versus chronic lymphocytic choriomeningitis virus (LCMV) infection (Doering et al., 2012). Indeed, GSEA revealed enrichment for the MNV-CR6F→Y signature in CD8+ T cells from chronic LCMV infection (Figure S4A). Conversely, the MNV-CW3WT signature was enriched in functional memory CD8+ T cells from resolved LCMV infection (Figure S4B). The transcriptional similarity between CD8+ T cells responding to chronic MNV and LCMV infections was driven, in part, by genes encoding exhaustion markers Tim3 and 2B4, integrin CD49b, and cytokine CXCL10 (Figure S4A). However, genes for other key markers of exhaustion, such as Pdcd1, were not part of the MNV-CR6F→Y CD8+ T cell signature and did not contribute to core enrichment in Figure S4A. To investigate this question further, we used published immunologic signatures to perform comprehensive GSEA of Tet+CD8+ T from day 30 MNV-CR6F→Y infection. There was significant enrichment of several exhaustion signatures derived from the LCMV model (Figure 4A) consistent with Figure S4A (Doering et al., 2012; West et al., 2011). However, the transcriptional profile of Tet+CD8+ T was also enriched for effector signatures (Figure 4B), defined as genes upregulated on day 8 versus 30 of LCMV or vaccinia virus infection. As effector and exhausted CD8+ T cells share features of activation (Doering et al., 2012; Singer et al., 2016), we used leading edge analysis to determine whether the same core genes contributed to enrichment for both types of signatures during MNV-CR6F→Y infection. Of the 489 genes driving enrichment for the exhaustion and effector signatures in Figure 4A–B, only 38 contributed to enrichment of both an exhaustion and an effector (Figure 4C). Moreover, only Litaf, encoding lipopolysaccharide (LPS)-induced tumor necrosis factor (TNF), contributed to more than one of the exhaustion and effector signatures used in the comparison. Thus, Tet+CD8+ T cells from chronic MNV-CR6F→Y infection had features of both exhausted and effector CD8+ T cells and these characteristics were largely driven by non-overlapping sets of genes, possibly reflecting recent activation and/or heterogeneity in the populations analyzed. By contrast, the transcriptome of Tet+CD8+ T cells from resolved MNV-CW3WT infection enriched for signatures of memory and/or quiescence, consistent with viral clearance (Figure S4C).
Figure 4. The transcriptional program of Tet+CD8+ T cells from chronic MNV-CR6F→Y infection has features of effector and inflationary T cells.

Gene set enrichment of published (A) exhaustion and (B) effector CD8+ T cell signatures in Tet+CD8+ T cells at day 30 p.i. with MNV-CR6F→Y versus MNV-CW3WT. (C) Genes contributing simultaneously to enrichment of exhaustion and effector signatures from (A) and (B) identified by leading edge analysis. (D) Enrichment of MCMV inflationary effector genes in Tet+CD8+ T cells from day 30 MNV-CR6F→Y versus MNV-CW3WT infection. (E) MNV-CR6F→Y normalized enrichment scores for the exhaustion and effector signatures from (A–B) and (D). (F) Genes contributing to enrichment of both effector signatures from (B) and the MCMV inflationary effector signature from (D). (G) PD-1 expression and abundance of Tet+CD8+ T cells at day 60 p.i. with MNV-CW3WT or MNV-CR6F→Y. Part G is representative of 2 experiments with 5 mice per group. See also Figure S4.
Given the preserved effector features of Tet+CD8+ T cells from chronic MNV infection, we considered the murine cytomegalovirus (MCMV) model of viral persistence that is characterized latency and reactivation. These viral dynamics give rise to inflationary virus-specific CD8+ T cells that maintain an effector phenotype and do not become exhausted despite repeated antigenic stimulation (Snyder, 2011). GSEA showed enrichment of an inflationary effector CD8+ T cell signature (Quinn et al., 2015) in the transcriptional profile of CD8+ T cells responding to persistent MNV-CR6F→Y infection (Figures 4D and S4D), suggesting long-term maintenance of a functional effector CD8+ T cell (Teff cell) response. Indeed, the normalized enrichment scores (NES) for effector signatures in Figure 4B and 4D were higher than the NES for exhaustion signatures in Figure 4A (Figure 4E). Moreover, of the 45 genes that contributed to core enrichment of the MCMV Teff cell signature (Figure S4D), 18 (40%) also contributed to enrichment of other effector signatures (Figure 4F) while none contributed to enrichment of exhaustion signatures. Therefore, the transcriptional similarities between CD8+ T cells responding to chronic MNV and latent MCMV infection can be largely attributed to effector genes.
Phenotypic features of inflationary CD8+ T cells include upregulation of granzyme and CX3CR1 and downregulation of the co-stimulatory molecules CD27, CD28, and GITR (Snyder, 2011; van de Berg et al., 2012; Welten et al., 2013). Indeed, at day 30 of MNV-CR6F→Y compared to MNV-CW3WT infection Tet+CD8+ T cells had higher expression of granzyme B and lower expression of CD28 and GITR proteins (Figure S4E). Consistent with their inflationary differentiation pattern, Tet+CD8+ T cells during chronic MNV-CR6F→Y infection persisted long-term and comprised a significant fraction of intestinal CD8+ T cells at day 60 p.i. (Figure 4G). Thus, Tet+CD8+ T cells from chronic MNV-CR6F→Y infection share transcriptional and phenotypic features with inflationary Teff CD8+ T cells from latent MCMV infection.
Tet+CD8+ T cells from chronic MNV infection respond to antigen in vivo
To define in vivo functionality, Tet+CD8+ T cells from chronic MNV-CR6F→Y infection were isolated, labeled with cell trace violet (CTV), and adoptively transferred into congenic recipients. These recipients were either naïve, acutely infected with MNV-CW3WT (day 4 p.i.) or chronically infected with MNV-CR6F→Y (day 60 p.i.) (Figure 5A–C). As expected, 5 days post transfer, donor Tet+CD8+ T cells had not divided in naïve hosts (Figure 5A). However, in mice acutely infected with MNV-CW3WT, donor Tet+CD8+ T cells divided extensively, expanded in number, and homed to the spleen, mesenteric lymph nodes (MLNs), and intestine (Figure 5B). Donor Tet+CD8+ T cells were particularly abundant in the intestine where they accounted for up to 80% of all donor-derived CD8+ T cells (Figure 5D). Thus, MNV-specific CD8+ T cells isolated even after 60 days of chronic infection were still capable of mounting robust responses to viral antigen in vivo during acute infection.
Figure 5. Tet+CD8+ T cells from chronic MNV infection retain in vivo responsiveness.

(A–C) Splenic CD8+ T cells were isolated from mice chronically infected with MNV-CR6F→Y (day 60 p.i.), labeled with CTV, and adoptively transferred into congenic recipients (9×10⁶ CD8+ T cells/recipient). Recipients were (A) naïve, or (B–C) at the indicated time point p.i. with MNV-CW3WT or MNV-CR6F→Y. (A–C) Frequency and proliferative history (CTV dilution) of donor Tet+CD8+ T cells 5 days post adoptive transfer in the indicated tissues. (D) Summary of (A–C) showing percent Tet+ among donor CD8+ T cells. Error bars show SEM. Representative of 2 independent experiments with 4 mice per group. (E–G) Adoptive transfer was carried out as above using Thy1.1 and Thy1.2 as congenic markers. Splenic CD8+ T cells were isolated from mice chronically infected with MNV-CR6F→Y (day 30 p.i.), labeled with CTV, and adoptively transferred into congenic recipients (5×10⁶ CD8+ T cells/recipient). Recipients were (E) naïve, or (F–G) at the indicated time point p.i. with MNV-CR6F→Y or MNV-CW3WT. In (E) and (F) some recipient groups were pretreated with anti-Thy1.1 antibody prior to transfer. Gates in green show frequency of adoptively transferred donor cells. Plots in green show Tet staining and CTV dilution of transferred donor cells. (H) Summary of (E–G) showing percent Tet+ among donor CD8+ T cells. Error bars show SEM for four mice per group. Representative of 2 independent experiments with 4 mice per group. *Unpaired t-test (p<0.05). See also Figure S5.
However, when the same Tet+CD8+ T cells were adoptively transferred to recipients that were chronically infected with MNV-CR6F→Y, these cells did not expand in number and were difficult to detect 5 days post transfer (Figure 5C). In a few chronically infected recipients, donor Tet+CD8+ T cells could be found in the intestine but these cells had not divided and accounted for less than 10% of all donor CD8+ T cells (Figure 5D), suggesting they had not encountered antigen. Consistent with this conclusion, viral loads in these mice remained unchanged after the adoptive transfer (data not shown).
The failure of adoptively transferred Tet+CD8+ T cells to respond to MNV-CR6F→Y suggested that these cells were ignorant of persisting antigen. Alternatively, poor donor responses might be due to competition from pre-existing host CD8+ T cells (Quinn et al., 2015). Therefore, we repeated the adoptive transfer experiment in Figure 5A–C using Thy1.1 (recipients) and Thy1.2 (donors) as congenic markers, and used an anti-Thy1.1 antibody to selectively deplete host T cells from recipients prior to the adoptive transfer (Figure S5A–B). Five days post transfer, donor Thy1.2+CD8+ T cells were detected in all tissues examined but had not proliferated significantly in most mice (Figure S5C). Depletion of host T cells did enhance overall donor cell survival, especially in MLN, however this effect was modest and observed in both naïve and chronically-infected mice, suggesting homeostatic proliferation rather than an antigen-specific response (Figure S5C). Indeed, most CTV-low donor CD8+ T cells were not Tet+ in either naïve or CR6F→Y-infected mice (Figure 5E–G). Adoptively-transferred CD8+ T cells were most abundant in the MLN of 2 out of 5 persistently infected Thy1.1-depleted recipients (Figure S5C, blue circles in MLN plot), however even in these mice Tet+ cells accounted for less than 0.5% of total donor cells (Figure 5H). Similarly, Tet+ cells accounted for at most 11% of donor CD8 T cells in the IEL and this was seen in just 1 out of 5 recipients (Figure 5H). Thus, even when depletion of host T cells gave an overall survival advantage, Tet+ cells failed to respond to chronic MNV-CR6F→Y infection.
Consistent with Figure 5B, when Thy1.2+CD8+ T cells were adoptively transferred into mice acutely infected with MNV-CW3WT, Tet+ donor cells proliferated robustly even without host T cell depletion (Figure 5G). By day 5 post transfer, virtually all Tet+ donor cells had diluted CTV and accounted for nearly half of donor cells in the gut (Figure 5H). Compared to Figure 5B, donor Tet+ cell expansion was less robust (red bars in Figure 5H versus 5D), consistent with the different timing of these adoptive transfers (recipient mice day 4 p.i. in Figure 5B versus day 1 p.i. in Figure 5H) and the fact that MNV-CW3WT viral titers peak at ~day 4 (data not shown). Collectively, these data demonstrate that despite having the capacity to respond to antigen in vivo, virus-specific CD8+ T cells fail to do so during chronic MNV-CR6F→Y infection and this defect is not due to T cell competition. Therefore, Tet+CD8+ T cells in persistently infected mice might be limited by an inability to efficiently detect viral antigen.
Preexisting CD8+ T cell immunity confers partial protection against chronic MNV
Given the response of Tet+CD8+ T cells to MNV-CW3WT (Figure 5C), we tested the effectiveness of pre-existing immunity against MNV-CR6F→Y. Mice that had previously cleared MNV-CW3WT or MNV-CW3Y→F were challenged with MNV-CR6F→Y or MNV-CR6WT and protection was measured by viral shedding and tissue titers. We carried out both “matched” and “mismatched” experiments in which the prime and challenge strains had the same or different P1519 epitopes. When taken together, there was no consistent pattern for priming strain related to control upon challenge (data not shown). Therefore, we combined data for MNV-CW3WT and MNV-CW3Y→F-immune mice and report all outcomes based on the chronic strain used in the challenge.
As expected, all non-immunized mice became chronically infected when challenged with MNV-CR6WT or MNV-CR6F→Y (Figure 6A–B, circles). Mice immunized with MNV-CW3WT or MNV-CW3Y→F and then challenged with MNV-CR6WT also developed chronic infection (Figure 6A–B, solid squares). By contrast, all immune mice challenged with MNV-CR6F→Y had decreased viral shedding for the first 48–96 hours p.i. (Figure 6A, open squares; time points in blue box), although in most cases replication of the challenge MNV-CR6F→Y virus eventually rebounded. However, ~1/3 of animals achieved long-term viral control with undetectable titers in the stool for at least ~30 days despite being co-housed with mice who remained infected and shedding virus (Figure 6A). At day 30 post challenge these protected mice also had undetectable viral titers in the proximal colon (Figure 6B).
Figure 6. Pre-existing Tet+CD8+ T cells can mediate protection against chronic MNV.

Mice were immunized with MNV-CW3WT or MNV-CW3Y→F and 30 days later challenged with MNV-CR6F→Y or MNV-CR6WT. (A) Viral shedding and (B) tissue titers were measured in challenged mice. (C) Summary of 3 independent experiments as outlined in (A–B). (D) P1519 sequences from the proximal colon of 6 immunized mice that became chronically infected after MNV-CR6F→Y challenge (box in (B). (E) Mice were immunized with MNV-CW3WT, then challenged with MNV-CR6F→Y as above. The effect of CD8+ T cell depletion on protection against MNV-CR6F→Y was tested on the indicated days post challenge by measuring viral titers in the colon. *Unpaired t-test (p<0.05). See also Figure S6.
These data showed that early viral control following MNV-CR6F→Y challenge was universal, whereas long-term protection was sporadic (Figure 6C). Long-term viral control did not correlate with the number or functionality of Tet+CD8+ T cells (data not shown), and boosting MNV-CW3WT-immune mice with a recombinant vaccinia virus expressing the P1519Y epitope did not improve outcomes to MNV-CR6F→Y challenge (data not shown) despite significantly augmenting the P1519-specific CD8+ T cell response (see Figure S6A, B). Taken together, these observations suggested that long-term protection was likely due to events that occurred early after viral challenge and prevented establishment of a niche for MNV-CR6F→Y persistence. Consistent with this interpretation, in 4 out of 6 primed mice that had developed chronic MNV-CR6F→Y infection (see box in Figure 6B) the F→Y mutation was preserved at day 30 post challenge (Figure 6D). Similarly, MNV-CR6F→Y sequences from the fecal pellets of 4 other primed and chronically-infected mice also contained the F→Y mutation (data not shown). These findings further suggested that CD8+ T cells failed to exert immune pressure on MNV-CR6F→Y in the chronic phase of infection. In 2 of the primed and chronically infected mice, the P1519Y epitope had, in fact, mutated back to P1519F (Figure 6D). Moreover, this was a true reversion since the Phe codon in these mutant sequences was TTC, whereas it is TTT in the wild-type CR6 strain (compare to Figure 1M). We hypothesize that this sequence change represents an alternative pathway of viral escape early after challenge when CD8+ T cells exerted some degree of control over viral replication.
As partial protection against chronic MNV was observed for MNV-CR6F→Y but never for MNV-CR6WT or in unimmunized mice, we surmised that such protection was mediated by CD8+ T cells. To directly test this conclusion, a subset of immunized mice was depleted of CD8+ T cells (Figure S6C) and viral titers were measured at early time points post MNV-CR6F→Y challenge. Consistent with our previous observations, immunized mice with intact CD8+ T cells controlled viral replication at early time points (Figure 6E, squares). By contrast, most mice treated with anti-CD8β had high viral titers in the proximal colon at days 4 and 6 post challenge (Figure 6G, triangles). Of note, we did not detect MNV in the liver or spleen of these CD8-depleted mice, consistent with the gut-specific tropism of MNV-CR6 (Nice et al., 2013). Thus, CD8+ T cells were necessary for early enteric control of MNV-CR6F→Y in immunized mice.
Inconsistent detection of antigen by Tet+CD8+ T cells early after MNV-CR6F→Y challenge
Prime-challenge data indicated a narrow window for Tet+ CD8+ T cells to clear MNV-CR6F→Y (Figure 6A), while the adoptive transfers suggested that these cells were ignorant of viral replication during chronic infection (Figure 5C). To investigate these dynamics further, we generated a recombinant vaccinia virus expressing the P1519Y epitope (rVV519Y) and used it to boost the P1519-specific CD8+ T cell response in MNV-CW3WT-immune mice (Figure S6A–B). We used this prime-boost strategy to generate large numbers of Tet+CD8+ T cells, labeled these cells with CTV, and adoptively transferred them to congenic recipients. Recipients mice were either naïve or at different time points of MNV-CW3WT (day 1 or 7) or MNV-CR6F→Y (day 1, 7, or 30) infection.
As expected, no proliferation of donor Tet+CD8+ T cells was observed in naïve recipients 5 days after adoptive transfer (Figure 7A). By contrast, donor Tet+CD8+ T cells divided extensively in all recipients at day 1 p.i. with MNV-CW3WT (Figure 7B). These, donor Tet+CD8+ T cells homed to the spleen and MLN, as well as to the intestinal mucosa and LP where they accumulated to the highest frequency (Figure 7G). Consistent with the viral clearance kinetics for MNV-CW3WT (see Figure 1) there was little division or accumulation of donor Tet+CD8+ T cells in MNV-CW3WT-infected recipients at day 7 p.i., though occasional CTV dilution likely reflected presence of residual antigen (Figure 7C).
Figure 7.

In vivo and in vitro detection of MNV by Tet+CD8+ T cells is inefficient after the initial week of infection.
Donor mice were infected with MNV-CW3WT and 30 days later boosted with recombinant vaccinia virus expressing epitope P1519Y (rVV519Y) to generate a large pool of MNV-specific CD8+ T cells. Donor splenocytes were labeled with CTV and adoptively transferred into congenic recipients (10×106 splenocytes/recipient). Recipients were (A) naive or (B–F) at the indicated time points p.i. with MNV-CW3WT or MNV-CR6F→Y. Frequency of proliferated donor Tet+CD8+ T cells was analyzed 5 days post transfer in the LP. (G) Summary of (A–F) showing percent Tet+ among donor CD8+ T cells in the indicated tissues. Error bars show SEM. Representative of 2 independent experiments with 4 mice per group. *Unpaired t-test (p<0.05). (H–J) CD8+ T cells from day 30 MNV-CR6F→Y-infected mice (“Responders”) were labeled with CTV and incubated with total intestinal cells isolated from congenic “Presenter” mice. Presenters were (H) naïve or (I–J) chronically infected with MNV-CR6F→Y. In (J), intestinal preps were lysed and supplemented with APC from a naïve mouse. Tet+CD8+ T cell responses were assessed by CTV dilution after 72 hours. Eight biological replicates were pooled to enable detection of rare Tet+ events. In each biological replicate, 1×10⁶ Responders were incubated with 5×10⁵ Presenters. In (J), the culture was supplemented with 1×10⁶ naïve splenocytes. Representative of 2 independent experiments. See also Figure S7.
When Tet+CD8+ T cells were adoptively transferred to MNV-CR6F→Y-infected recipients at days 1 or 7 p.i., we observed heterogeneous responses (representative plots in Figure 7D–E). In some recipients, essentially no division of donor Tet+CD8+ T cells took place, while in others Tet+ donor cells divided extensively, although not to the same extent as with MNV-CW3WT (Figure 7B versus D–E). When donor Tet+ cells responded to MNV-CR6F→Y, they accumulated primarily in the intestine where P1519-specific cells accounted for at most 30% of total donor CD8+ T cells (compared to 80% for MNV-CW3WT) (Figure 7G). At day 5 post transfer, all MNV-CR6F→Y infected mice had detectable virus in the colon and there was no correlation between the extent of donor Tet+CD8+ T cell proliferation and intestinal viral titers in individual mice (data not shown). This was expected since the number of MNV-specific CD8+ T cells following adoptive transfer was low compared to intact MNV immune mice and these mice lacked preexisting CD4+ T cell and B cell immunity.
Despite ongoing viral replication (and consistent with Figure 5C), no significant division of donor CD8+Tet+ cells took place in recipients at day 30 post MNV-CR6F→Y infection and few donor cells were detected at this late time point (Figure 7F, G). Collectively, these data suggested that although MNV-specific CD8+ T cells could sense and respond to MNV-CR6F→Y early after infection, these responses were sporadic and less robust than for MNV-CW3WT. Moreover, the ability of Tet+CD8+ T cells to detect ongoing MNV-CR6F→Y replication waned over time and was nearly absent in established chronic infection.
Failure of antigen presentation by chronically infected intestinal cells
The preserved functionality and progressive inability of Tet+CD8+ T cells to detect ongoing viral replication suggested that MNV-CR6F→Y was inaccessible to CD8+ T cells during established chronic infection. Alternatively, MNV-CR6F→Y might directly antagonize immune cell function via virally-encoded proteins (Zhu et al., 2016; Zhu et al., 2013). To distinguish between these possibilities, we designed an in vitro experiment to “force” interactions between Tet+CD8+ T cells and cells infected with MNV-CR6F→Y. CD8+ T cells from the spleens of day 30 MNV-CR6F→Y-infected mice were labeled with CTV and incubated with single-cell intestinal suspensions from congenic mice that were either naïve or also persistently infected with MNV-CR6F→Y. These “intestinal preps” contained multiple cell types including epithelial cells, fibroblasts, and immune subsets from the intraepithelial and LP compartments (data not shown). Although the cellular reservoir of persisting MNV-CR6F→Y is currently unknown, we reasoned that cells harboring virus were likely to be present in intestinal preps.
Intestinal preps from naïve mice did not stimulate Tet+CD8+ T cell division (Figure 7H). Preps from persistently-infected mice also failed to induce an MNV-specific CD8+ T cell response (Figure 7I), consistent with in vivo observations (Figure 5C). To determine whether host or viral factors prevented Tet+CD8+ T cell responses, intestinal preps from chronically infected mice were lysed via freeze-thaw to release potentially inaccessible intracellular viral antigens and mixed with splenocytes from naïve mice to act as antigen presenting cells (APC). In this case, Tet+CD8+ T cells responded by dilution of CTV consistent with antigen release from a cellular viral reservoir and presentation by splenic APC (Figure 7J). Similar results were obtained when bone marrow-derived DCs were used as APC (Figure S7). Moreover, proliferation of Tet+ CD8+ T cells in these in vitro assays was antigen-specific, as it was not observed with lysed intestinal preps from naïve mice (Figure S7A). These data suggested restricted availability and/or release of viral antigen from the intestinal cellular reservoir despite continued replication of MNV-CR6F→Y in vivo. Taken together, our in vivo and in vitro experiments support a mechanism of CD8+ T cell evasion by MNV based on persistence in an immune-privileged enteric niche.
DISCUSSION
Two challenging aspects of NV biology have recently been appreciated. First, NVs cause chronic infections in some immunocompetent individuals thereby creating a potential reservoir for viral evolution and spread (Karst et al., 2014). Second, NVs evade adaptive immune responses even in previously vaccinated individuals who have robust NV-specific antibody titers (Atmar et al., 2011). Understanding why adaptive immunity fails to prevent or clear NV infections can facilitate future vaccine and public health efforts.
CD8+ T cells are critical for control of many mucosal pathogens including NVs (Chachu et al., 2008). However, the impact of chronic enteric infection on Trm cell responses and differentiation remains poorly understood. As chronic viral infections are often facilitated by T cell dysfunction, defining the features of T cell failure could have implications for therapeutic interventions and preventative vaccines. Using the MNV model we discovered two key features of the CD8+ T cell response and protective immunity during chronic infection. First, MNV-specific CD8+ T cells retained functional responsiveness and did not display typical features of exhaustion. Indeed, MNV-specific CD8+ T cells maintained transcriptional features of activation resembling inflationary effector CD8+ T cells from herpesvirus infections. Second, there was a narrow window of opportunity for CD8+ T cells to exert protection against chronic MNV infection, leading to an apparent paradox of continued robust viral replication despite a largely functional antiviral CD8+ T cell response. Our findings point to a mechanism of largely immunologically undetectable persistence of an RNA virus in the intestinal tract.
While pathogen persistence is not unique to MNV, our data suggest an unusual pattern of immune evasion. First, the immunodominant P1519Y epitope did not revert to the less immunogenic 519F variant following primary and most secondary infections, suggesting that antigenic escape is not a major pathway facilitating MNV persistence. Second, CD8+ T cell exhaustion or senescence did not develop in P1519Y-specific CD8+ T cells, as these cells remained functional even after 30 days of chronic infection. Third, overt tolerance to MNV-CR6F→Y also appears unlikely given the absence of Treg cell expansion and the robust response of P1519Y-specific CD8+ T cells when adoptively transferred to MNV-CW3WT-infected mice.
A fourth possibility is that Tet+CD8+ T cells fail to clear MNV-CR6F→Y due to limited access to viral antigen during chronic infection. True CD8+ T cell ignorance is thought to arise from insufficient anatomical access to antigen and/or lack of costimulatory signals (Woodham et al., 2016). However, in the case of established chronic MNV-CR6F→Y infection, the effector properties of P1519-specific CD8+ T cells and their transcriptional similarity to inflationary MCMV-specific responses suggest that these cells do, at least occasionally, encounter and respond to antigen in vivo, but such interactions may be transient and/or inefficient.
How does a virus persistently replicating at high levels induce a CD8+ T cell transcriptional program normally reserved for latent pathogens? MNV cellular tropism may be at the core of this question and while the identity of the in vivo cellular reservoir remains poorly understood, our data may be relevant for elucidating the pathogenesis of this chronic enteric infection. Although we demonstrate a role of CD8+ T cells in preventing chronic MNV infection, at least in some mice, our data also show that these cells have a narrow window of opportunity to prevent persistence. This observation suggests a possible “switch” in tropism associated with the transition to viral persistence. CD300lf+ DCs can support MNV-CR6 infection in vitro and may be necessary for at least the initial establishment of infection in vivo (Orchard et al., 2016). Thus, one possibility is that initial DC infection allows priming and early control of MNV-CR6F→Y infection by CD8+ T cells, but subsequently viral persistence is established in a cell type that is relatively inaccessible or unrecognizable by Tet+CD8+ T cells. The transcriptional program of MNV-specific CD8+ T cells from chronic infection does, however, implicate occasional re-stimulation with antigen in vivo perhaps due to low-level release from the viral reservoir. Moreover, the CD103 status of MNV-specific CD8+ T cells in acutely resolved versus chronic infection may be relevant. For example, data from the Yersinia model show that the physical proximity of CD103lo Trm cells to antigen-presenting cells is critical for successful pathogen clearance (Bergsbaken and Bevan, 2015). Whether the distinct patterns of CD103 expression on Tet+CD8+ T cells from resolved versus chronic MNV infection reflect differences in viral tropism and local immune environment, and whether modulating this axis could have antiviral effects will be interesting to interrogate in the future.
We have shown that a robust and functional CD8+ T cell response fails to prevent MNV persistence. The behavior of MNV-specific CD8+ T cells during chronic infection suggests a “blind spot” in their ability to perceive antigen. Whether such ignorance is the result of a maladaptive CD8+ T cell differentiation pattern or viral replication inside an immunoprivileged enteric niche remains to be determined and will have important implications for the design of future NV vaccines.
STAR METHODS
Contact for Reagent and Resource Sharing
Further information and requests for reagents may be directed to Vesselin Tomov (tomovv@pennmedicine.upenn.edu)
Experimental Model and Subject Details
Mice
Wild type C57Bl/6J female mice age 6–8 weeks were obtained from Jackson Laboratory, Bar Harbor, ME. MNV-free status of mice from Jackson Laboratory was confirmed by serology testing and qPCR. After arrival, mice were maintained MNV-free in designated cages with bedding and food changes done separately from other mice by the investigators. Periodic monitoring of naïve controls was carried out to confirm MNV-free status. Mice were infected by oral gavage with 1×10⁶ PFU of MNV delivered in 200 μl culture medium (RPMI with 10% fetal bovine serum). For vaccinia virus boost experiments, mice were injected intraperitoneally with 1×10⁶ PFU of rVV519Y in 200 μl culture medium. All mice were used in accordance with Institutional Animal Care and Use Committee guidelines for the University of Pennsylvania.
Mouse noroviruses
MNV strains CW3Y→F and CR6F→Y were generated from the parental strains MNV-1.CW3 (GenBank accession # EF014462) and MNV-1.CR6 (GenBank accession # EU004676). Overlap extension PCR was used to generate fragments containing the Y→F or F→Y mutations as previously described (Higuchi et al., 1988). For MNV-CW3Y→F, primers (5′-CCCCTTGCCCCCCCAATTGGTCCC-3′) and (5′-GGCCAATTGAAAAAGGCGAGGAACCCAACTGACGACC-3′) were used to generate the first fragment, and primers (5′-CCTCGCCTTTTTCAATTGGCCTCTGTGGGAAGTTTGGC-3′) and (5′-GGAGTGAATTCTAGCGGCCGCTAGAATTCCG-3′) were used to generate the second fragment. The product from the overlap extension step was cloned into the MNV-CW3 backbone between endonuclease restriction sites ApaL1 and Not1. For MNV-CR6F→Y, primers (5′-CCCCTTGCCCCACCCCTAGGCCCC-3′) and (5′-CGGAGGCCAATTGGTAGAGGCGGGGGACCCAGCTGACAACC-3′) were used to generate the first fragment, and primers (5′-GCCTCTACCAATTGGCCTCCGTGGGAAGCTTGG-3′) and (5′-GGAGTGAATTCTAGCGGCCGCTAGAATTCCG-3′) were used to generate the second fragment. The product from the overlap extension step was cloned into the MNV-CR6 backbone between endonuclease restriction sites Pvu1 and Not1. All constructs were sequenced to confirm successful insertion of the mutant sequences. Viral stocks of the wild type and mutant viruses were generated by transfecting virion-encoding plasmids into 293T cells and transferring supernatant onto RAW 264.7 cells as previously described (Tomov et al., 2013). Briefly, 293T cells were transfected using FuGENE-HD reagent (Promega, Madison, WI) according to the manufacturer’s protocol (FuGENE:DNA ratio of 5:2). After 48 hours, transfected 293T cells were lysed by freeze-thaw, cellular debris was removed by centrifugation (10 minutes, 3,000 g, 4°C), and the supernatant was transferred onto RAW 264.7 cells that had been plated at 2×10⁶ cells/well in 6-well plates 24 hours earlier. After 48 hours, RAW 264.7 cells were freeze-thawed and supernatant was purified from cellular debris as above. Viral stock titers were determined by plaque assay on RAW264.7 cells.
Recombinant vaccinia virus
Recombinant vaccinia virus rVV519Y was generated by cloning an insert containing the P1519Y sequence between restriction sites EcoR1 and Nhe1 in vector pRB21 (Blasco and Moss, 1995). Top (5′-AATTCATGAGTTGGGTTCCTCGCCTTTACCAATTGTAG-3′) and bottom (5′-CTAGCTACAATTGGTAAAGGCGAGGAACCCAACTCATG-3′) oligonucleotides were annealed and 5′ phosphate groups were added using T4 polynucleotide kinase prior to cloning into the pRB21 vector. Successful insertion was confirmed by DNA sequencing. Recombinant vaccinia virus was produced by homologous recombination in CV-1 cells and triple plaque purification on 143B cells in the presence of 5mg/ml 5′-bromo-2′-deoxyuridine as previously described and additional stocks were prepared in BSC40 cells (Wherry et al., 2001).
Method Details
Lymphocyte isolation and flow cytometry
Lymphocyte isolation from spleens, mesenteric lymph nodes, intestinal epithelium, and intestinal lamina propria was performed as previously described (Tomov et al., 2013). Briefly, spleens, and mesenteric lymph nodes were harvested in 2 ml cold (4°C), sterile culture media (RPMI with 10% fetal bovine serum), and homogenized through 70 μm cell strainers. In the case of spleens, red blood cells were lysed with ammonium-chloride-potassium (ACK) lysing buffer (Life Technologies, Grand Island, NY) for 2 minutes, and washed in cell culture media. Small intestines were dissected free of fat and Peyer’s patches, cut open longitudinally, washed clean of fecal material in PBS, and placed in 10 ml cold culture media. To remove epithelial cells, intestines were incubated in stripping buffer (PBS containing 5 mM EDTA, 1 mM dithiothreitol, 5% fetal bovine serum, 100 IU/ml penicillin, and 100 μg/ml streptomycin) and shaken at 160 rpm for 10 minutes at 37°C. After discarding the supernatant, intestines were incubated again in stripping buffer and shaken at 160 rpm for 20 minutes at 37°C. The supernatant containing intestinal epithelial cells (IEL) was passed through a 70 μm cell strainer, washed in culture media, re-suspended in culture media containing 40% Percol, and subjected to centrifugation at 600g, room temperature, for 20 minutes (without break). Following centrifugation, the supernatant was carefully removed and cell pellets were washed in culture media. After IEL stripping, lamina propria lymphocytes (LPL) were isolated by incubating intestines in cell media containing 0.5 mg/ml collagenase/dispase (Genetech, South San Francisco, CA) and 20 μg/ml DNaseI (Sigma-Aldrich, St. Louis, MO) for 20 minutes at 37°C and shaking at 160 rpm. LPL were passed through a 70 μm cell strainer, washed, and centrifuged in 40% Percol as described above. LPL and IEL were isolated from the small intestine except in Figure 3B where they were isolated from the colon. In vitro stimulation with peptides P1519F and P1519Y was carried out for 5 hours at 37°C with 0.4 μg/ml of peptide in the presence of GolgiStop and GolgiPlug (BD Biosciences, San Diego, CA) as previously described (Tomov et al., 2013). Cells were fixed and permeabilized using a Cytofix/Cytoperm kit (BD Biosciences, San Diego, CA) or FoxP3 Fixation/Permeabilization kit (eBioscience, San Diego, CA) according to the manufacturer’s protocol. MHC Class I-peptide tetramers used in this study have been previously described (Tomov et al., 2013). Antibodies used are documented in the Key Resource Table. Data analysis was performed using FlowJo (version 10.3) software (LLC, Ashland, OR). Dead cells were removed by gating on a LIVE/DEAD Aqua kit (Invitrogen, Carlsbad, CA) versus forward scatter (FSC-H).
KEY RESOURCES TABLE.
| REAGENT or RESOURCE | SOURCE | IDENTIFIER |
|---|---|---|
| Antibodies | ||
| Anti CD8β-PerCP-Cy5.5 (clone YTS156.7.7) | Biolegend | Cat# 126609 |
| Anti PD-1-PE-Cy7 (clone RMP1-30) | Biolegend | Cat# 109109 |
| Anti CD103-PacificBlue (clone 2E7) | Biolegend | Cat# 121417 |
| Anti CD44-BV785 (clone IM7) | Biolegend | Cat# 103041 |
| Anti CD45.2-BV785 (clone 104) | Biolegend | Cat# 109839 |
| Anti CXCR4-BV421(clone L276F12) | Biolegend | Cat# 146511 |
| Anti Ly6c-BV785 (clone HK1.4) | Biolegend | Cat# 128041 |
| Anti KLRG-1-BV605 (clone 2F1) | Biolegend | Cat# 138419 |
| Anti CD62L-BV605 (clone MEI-14) | Biolegend | Cat# 104438 |
| Anti TNFa-PacificBlue (clone MP6-XT22) | Biolegend | Cat# 506318 |
| Anti CD107a-AF488 (clone 1D4B) | Biolegend | Cat# 121607 |
| Anti CD28-PE-Cy7 (clone 37.51) | Biolegend | Cat# 102126 |
| Anti CX3CR1-PE (clone SA011F11) | Biolegend | Cat# 149006 |
| Anti CD11a-PE (clone 2D7) | Biolegend | Cat# 101008 |
| Anti FOXP3-PE (clone MF-14) | Biolegend | Cat# 126404 |
| Anti CD90.1 (Thy-1.1)-BV605 (clone OX-7) | Biolegend | Cat# 202537 |
| Anti CD25-PE-Cy5 (clone PC61) | Biolegend | Cat# 102010 |
| Anti CD8a-PE-eF610 (clone 53.6) | eBioscience | Cat# 61-0081-80 |
| Anti CD69-PE-Cy7 (clone H1.2F3) | eBioscience | Cat# 25-0691-82 |
| Anti 2B4-FITC (clone eBio244F4) | eBioscience | Cat# 11-2441-82 |
| Anti CD49b-PE-Cy5 (clone DX5) | eBioscience | Cat# 15-5971-82 |
| Anti CD49d-FITC (clone R1-2) | eBioscience | Cat# 11-0492-81 |
| Anti CD90.2 (Thy1.2)-FITC (clone 30-H12) | eBioscience | Cat# 11-0903-82 |
| Anti CD27-APC-eFluor 780 (clone LG.7F9) | eBioscience | Cat# 47-0271-82 |
| Anti CD45.1-APC-R700 (clone A20) | BD Biosciences | Cat# 565814 |
| Anti IFN -AlexaFluor700 (clone XMG1.2) | BD Biosciences | Cat# 557998 |
| Anti GITR-FITC (clone DTA-1) | BD Biosciences | Cat# 558139 |
| Anti Granzyme-B-PE (clone GB11) | Invitrogen | Cat# GRB04 |
| Anti MIP-1a-APC (clone 39624) | R&D Systems | Cat# 1C450A |
| Anti IL-12Rβ2-PRCP (clone 305719) | R&D Systems | Cat# FAB1959C |
| Anti-CD8β (Lyt 3.2) (clone 53-5.8) | Bio X Cell | Cat # BE0223 |
| Anti-Thy1.1 (clone 19E12) | Bio X Cell | Cat # BE0214 |
| Bacterial and Virus Strains | ||
| MNV-CW3 | Tomov et al., 2013 | GenBank EF014462 |
| MNV-CR6 | Tomov et al., 2013 | GenBank EU004676 |
| MNV-CW3Y→F | This study | N/A |
| MNV-CR6F→Y | This study | N/A |
| rVV519Y | This study | N/A |
| Biological Samples | ||
| N/A | N/A | N/A |
| Chemicals, Peptides, and Recombinant Proteins | ||
| Deoxyribonuclease I from Bovine Pancreas | Sigma-Aldrich | Cat # D5025 |
| Collagenase/Dispase | Roche | Cat # 11097113001 |
| DTT (dithiothreitol) | Thermo Fisher | Cat # R0861 |
| RPMI 1640 | Corning | Cat # 15-040-CM |
| GemCell U.S. Origin Fetal Bovine Serum | Gemini | Cat # 100-500 |
| UltraPure 0.5M EDTA, pH 8.0 | Invitrogen | Cat # 15575-038 |
| Penicillin-Streptomycin (10,000 U/mL) | Gibco | Cat # 151401-22 |
| ACK Lysing Buffer | Thermo Fisher | Cat # A1049201 |
| L-Glutamine (200mM) | Lonza | Cat # 17605E |
| Dulbecco’s Phosphate-Buffered Saline, 1X | Corning | Cat # 21-031-CM |
| Percoll | Sigma-Aldrich | Cat # P4937 |
| Critical Commercial Assays | ||
| RNeasy Mini Kit | Qiagen | Cat # 74106 |
| High-Capacity cDNA Reverse Transcription Kit | Applied Biosystems | Cat # 4368814 |
| TaqMan Gene Expression Master Mix | Applied Biosystems | Cat # 4369016 |
| iTaq Universal SYBR Green SuperMix | Bio-Rad | Cat # 1725120 |
| Fixation and Permeabilization Solution/Wash | BD Biosciences | Cat # 554722/554723 |
| Brefeldin A Protein Transport Inhibitor | BD Biosciences | Cat # 555029 |
| Monensin Protein Transport Inhibitor | BD Biosciences | Cat # 554724 |
| Dynal CD8 Negative Isolation Kit | Invitrogen | Cat # 113.190 |
| CellTrace CFSE Cell Proliferation Kit | Invitrogen | Cat # C34554 |
| LIVE/DEAD Fixable Aqua Dead Stain Kit | Invitrogen | Cat # L34957 |
| Fixation/Permeabilization Concentrate | eBioscience | Cat # 00-5123-43 |
| Fixation/Permeabilization Diluent | eBioscience | Cat # 00-5223-56 |
| MoGene 2.0 ST Microarray | Affymetrix | Cat # 902118 |
| GeneChip WT PLUS Reagent Kit | Affymetrix | Cat # 902280 |
| FuGENE-HD | Promega | Cat # E2311 |
| Deposited Data | ||
| Raw microarray data | NCBI GEO | GSE101429 |
| Experimental Models: Cell Lines | ||
| RAW 264.7 | ATCC | Cat # TIB-71 |
| 293T | ATCC | Cat # CRL-3216 |
| 143B | ATCC | Cat # CRL-8303 |
| CV-1 | ATCC | Cat # CCL-70 |
| BSC40 | ATCC | Cat # CRL-2761 |
| Experimental Models: Organisms/Strains | ||
| C57BL/6J | Jackson Laboratory | Stock 000664 |
| B6.SJL-Ptprca Pepcb/BoyJ | Jackson Laboratory | Stock 002014 |
| B6.Thy1.1 (B6.PL-Thy1a/Cy) | Jackson Laboratory | Stock 000406 |
| Oligonucleotides | ||
| CW3 Y→F 1st fragment forward primer CCCCTTGCCCCCCCAATTGGTCCC |
This paper | N/A |
| CW3 Y→F 1st fragment reverse primer GGCCAATTGAAAAAGGCGAGGAACCCAACTGACGACC |
This paper | N/A |
| CW3 Y→F 2nd fragment forward primer CCTCGCCTTTTTCAATTGGCCTCTGTGGGAAGTTTGGC |
This paper | N/A |
| CW3 Y→F 2nd fragment reverse primer GGAGTGAATTCTAGCGGCCGCTAGAATTCCG |
This paper | N/A |
| CR6 F→Y 1st fragment forward primer CCCCTTGCCCCACCCCTAGGCCCC |
This paper | N/A |
| CR6 F→Y 1st fragment reverse primer CGGAGGCCAATTGGTAGAGGCGGGGGACCCAGCTGACAACC |
This paper | N/A |
| CR6 F→Y 2nd fragment forward primer GCCTCTACCAATTGGCCTCCGTGGGAAGCTTGG |
This paper | N/A |
| CR6 F→Y 2nd fragment reverse primer GGAGTGAATTCTAGCGGCCGCTAGAATTCCG |
This paper | N/A |
| rVV-519Y top primer AATTCATGAGTTGGGTTCCTCGCCTTTACCAATTGTAG |
This paper | N/A |
| rVV-519Y bottom primer CTAGCTACAATTGGTAAAGGCGAGGAACCCAACTCATG |
This paper | N/A |
| Recombinant DNA | ||
| Vaccinia virus vector pRB21 | This paper | N/A |
| Software and Algorithms | ||
| FlowJo | LLC | Version 10.3 |
| GraphPad Prism | GraphPad | Version 7 |
| GSEA | Broad Institute | Version 3.0 |
| Transcriptome Analysis Console | Affymetrix | Version 3.0.0.466 |
| Other | ||
| P1-519Y Tetramer | This paper | N/A |
| P1-519F Tetramer | This paper | N/A |
Adoptive transfers
Splenocytes from donor mice were harvested and isolated as described in the lymphocyte isolation and flow cytometry section above. Where indicated, enrichment for CD8+ T cells was performed using a Dynal Mouse CD8+ Negative Isolation Kit (Invitrogen, Carlsbad, CA) per manufacturer’s instructions. Cells were counted and 1×10⁸ cells were labeled in 5 ml of 15 μM Cell Trace Violet (CTV) (Invitrogen, Carlsbad, CA). Labeling with CTV was done at room temperature for 10 minutes in the dark. Cells were then washed 3 times in cold PBS with 0.1% BSA, counted, and injected i.v. into recipient mice as indicated.
Immune cell depletion
Depletion of CD8+ T cells was performed using anti-mouse CD8β (Lyt 3.2) antibody, clone 53-5.8 from Bio X Cell, Lebanon, NH. Mice received 2 injections of 200 μg and 2 injections of 500 μg of the antibody i.v. on days -7, -5 and then -3 and 0 relative to challenge infection. For Thy1.1 depletion, anti-mouse Thy1.1 antibody, clone 19E12 was used. Mice received 3 injections of 200 μg IP on days -7, -4, and -2 prior to adoptive transfer.
In vitro cytotoxicity
The cell killing assay was carried out as previously described (Odorizzi et al., 2015). Briefly, cells from MLN of naïve CD45.1 mice were labeled with 50 nM CTV (“dim” cells) or 1 μM CTV (“bright” cells). The CTVdim cells were incubated with 4 μg/ml of P1519Y peptide, whereas CTVbright cells were incubated with 4 μg/ml of GP33 peptide for 2 hours at 37°C. After two hours, the pulsed cells were washed and 2×10³ CTVdim cells were mixed with 2×10³ CTVbright cells. CD8+ T cells were isolated from the spleen of day 30 MNV-CR6F→Y and day 30 MNV-CW3WT CD45.2 mice. These CD8+ T cells were analyzed by flow cytometry to determine the fraction of Tet+ cells. CD8+ T cells from MNV-CR6F→Y or MNV-CW3WT containing the same number of Tet+ cells were added to wells with CTVdim and CTVbright target cells. After 18 hours at 37°C, target cells were analyzed by flow cytometry and the percent-specific lysis was calculated as 100 × [1 − (%CTVdim/%CTVbright)].
In vitro MNV-CR6F→Y detection
Enrichment for CD8+ T cells was carried out using a Dynal Mouse CD8+ Negative Isolation Kit (Invitrogen, Carlsbad, CA) according to manufacturer instructions. Lysis of intestinal preps was carried out via freeze-thaw followed by centrifugation of the sample to remove cell debris. Bone marrow-derived DCs were isolated from the femurs of naïve mice and incubated in RPMI 1640 (Corning-Cellgro, Corning, NY) containing 10% fetal bovine serum, 2mM L-glutamine, 50 μM 2-mercaptoethanol, 100 IU/ml penicillin, 100 μg/ml streptomycin, and 20 ng/ml GM-CSF for 6 days with addition of fresh medium every 3 days.
Cell sorting for gene expression studies
Mice were infected with MNV-CW3WT or MNV-CR6F→Y as described above and splenocytes (SPL) and intestinal epithelial lymphocytes (IEL) were isolated at days 8, 15, and 30 p.i. For each time point 3 or 4 independent biological replicates were used, where a “replicate” was defined as pooled IELs or SPLs from 5 individual mice. For SPL, a Dynal Mouse CD8+ Negative Isolation Kit (Invitrogen, Carlsbad, CA) was used to enrich for CD8+ T cells. Cells were counted and stained for viability, CD8, tetramer (Tet), and “dump” markers CD19, CD14, and NK1.1. All samples were maintained at 4°C. Sorting for live CD8+Tet+Dump− cells was done on a FACS Aria II cytometer (BD Immunocytometry Systems, San Jose, CA). Each biological replicate contained an average of 30,000 Tet+CD8+ T cells from the spleen or 10,000 Tet+CD8+ T cells from IELs. Sample purity ranged from 92 to 99%. Sorted cells were resuspended in 700 μl Trizol vortexed for 1 minute, and stored at −80°C pending genomic analysis.
RNA from sorted cells was isolated, processed, amplified, labeled, and hybridized to MoGene 2.0 Micorarrays (Affymetrix, Santa Clara, CA) at the Molecular Profiling Facility at the University of Pennsylvania. Affymetrix Expression Console 1.4 software was used to process, quality control, and quantile normalize fluorescent hybridization signals with the Robust Multichip Averaging method as described (Doering et al., 2012). Transcripts were log2 normalized. Hierarchical Clustering was performed with Gene Pattern, and Gene Set Enrichment Analysis was performed with GSEA software (Subramanian et al., 2005).
Viral titer measurement
Viral titer in fecal pellets and tissues was measured by qPCR using methods and primers previously described (Tomov et al., 2013).
Quantification and Statistical Analysis
Statistical parameters including number of biological replicates and repeat experiments, data dispersion and precision measures (mean and SEM), and P values for statistical significance by Student’s T test and Fisher’s exact 2-tailed test are reported in the Figures and Figure Legends. Statistical analysis was performed using GraphPad Prism 7.
Data and Software Availability
Raw data files for the Gene Array expression analysis have been deposited in the NCBI Gene Expression Omnibus (accession # GSE101429).
Supplementary Material
HIGHLIGHTS.
MNV-specific Trm cells during chronic infection are largely functional
MNV Trm cells are transcriptionally similar to inflationary T cells seen in herpes
MNV-specific CD8+ T cells can be protective, but this protection wanes after ~3 days
CD8+ T cell ignorance in chronic MNV infection is due to poor antigen presentation
Acknowledgments
We thank R. Staupe and E. Stelekati for helpful discussions and critically reading the manuscript. We thank K. Pauken, J. Schenkel, R. Herati, J. Johnnidis, M. and J. Kurachi for technical advice and/or help with flow cytometry and cell sorting. This work was supported by the following grants: NIH/NIDDK T32-DK007066 Training Program in Gastrointestinal Sciences; NIH/NIDDK P30DK050306 Center for Molecular Studies in Digestive and Liver Diseases; NIH U01-AI-095608, U19 AI AI082630, and P01 AI AI112521 to E.J.W.; NIH/NIDDK K08-DK097301 to V.T.T.; German Research Foundation Fellowship BE5496/1-1 to B.B.; and NIH U19-AI109725 to H.W.V. The authors also thank the Abramson Cancer Center Flow Cytometry and Cell Sorting Resource Laboratory. The ACC Flow Cytometry and Cell Sorting Shared Resource are partially supported by NCI Comprehensive Cancer Center Support Grant (P30 CA016520). E.J.W. is a member of the Parker Institute for Cancer Immunotherapy, which supports the UPenn Cancer Immunotherapy Program.
Footnotes
AUTHOR CONTRIBUTIONS
V.T., E.J.W., H.W.V., and T.J.N. designed the study. V.T., O.P, C.W.L., A.P., Y.S., and R.T. performed experiments. V.T., B.B., and S.M. analyzed the data. G.L.C., L.E., T.J.N., and H.W.V. contributed reagents. V.T. and E.J.W. wrote the paper. All authours edited the paper.
Publisher's Disclaimer: This is a PDF file of an unedited manuscript that has been accepted for publication. As a service to our customers we are providing this early version of the manuscript. The manuscript will undergo copyediting, typesetting, and review of the resulting proof before it is published in its final citable form. Please note that during the production process errors may be discovered which could affect the content, and all legal disclaimers that apply to the journal pertain.
References
- Abt MC, Osborne LC, Monticelli LA, Doering TA, Alenghat T, Sonnenberg GF, Paley MA, Antenus M, Williams KL, Erikson J, et al. Commensal bacteria calibrate the activation threshold of innate antiviral immunity. Immunity. 2012;37:158–170. doi: 10.1016/j.immuni.2012.04.011. [DOI] [PMC free article] [PubMed] [Google Scholar]
- Atmar RL, Bernstein DI, Harro CD, Al-Ibrahim MS, Chen WH, Ferreira J, Estes MK, Graham DY, Opekun AR, Richardson C, Mendelman PM. Norovirus vaccine against experimental human Norwalk Virus illness. N Engl J Med. 2011;365:2178–2187. doi: 10.1056/NEJMoa1101245. [DOI] [PMC free article] [PubMed] [Google Scholar]
- Baldridge MT, Nice TJ, McCune BT, Yokoyama CC, Kambal A, Wheadon M, Diamond MS, Ivanova Y, Artyomov M, Virgin HW. Commensal microbes and interferon-lambda determine persistence of enteric murine norovirus infection. Science. 2015;347:266–269. doi: 10.1126/science.1258025. [DOI] [PMC free article] [PubMed] [Google Scholar]
- Bergsbaken T, Bevan MJ. Proinflammatory microenvironments within the intestine regulate the differentiation of tissue-resident CD8(+) T cells responding to infection. Nat Immunol. 2015;16:406–414. doi: 10.1038/ni.3108. [DOI] [PMC free article] [PubMed] [Google Scholar]
- Beura LK, Anderson KG, Schenkel JM, Locquiao JJ, Fraser KA, Vezys V, Pepper M, Masopust D. Lymphocytic choriomeningitis virus persistence promotes effector-like memory differentiation and enhances mucosal T cell distribution. J Leukoc Biol. 2015;97:217–225. doi: 10.1189/jlb.1HI0314-154R. [DOI] [PMC free article] [PubMed] [Google Scholar]
- Blasco R, Moss B. Selection of recombinant vaccinia viruses on the basis of plaque formation. Gene. 1995;158:157–162. doi: 10.1016/0378-1119(95)00149-z. [DOI] [PubMed] [Google Scholar]
- Carbone FR, Mackay LK, Heath WR, Gebhardt T. Distinct resident and recirculating memory T cell subsets in non-lymphoid tissues. Curr Opin Immunol. 2013;25:329–333. doi: 10.1016/j.coi.2013.05.007. [DOI] [PubMed] [Google Scholar]
- Chachu KA, LoBue AD, Strong DW, Baric RS, Virgin HW. Immune mechanisms responsible for vaccination against and clearance of mucosal and lymphatic norovirus infection. PLoS Pathog. 2008;4:e1000236. doi: 10.1371/journal.ppat.1000236. [DOI] [PMC free article] [PubMed] [Google Scholar]
- Debbink K, Lindesmith LC, Donaldson EF, Baric RS. Norovirus immunity and the great escape. PLoS Pathog. 2012;8:e1002921. doi: 10.1371/journal.ppat.1002921. [DOI] [PMC free article] [PubMed] [Google Scholar]
- Doering TA, Crawford A, Angelosanto JM, Paley MA, Ziegler CG, Wherry EJ. Network analysis reveals centrally connected genes and pathways involved in CD8+ T cell exhaustion versus memory. Immunity. 2012;37:1130–1144. doi: 10.1016/j.immuni.2012.08.021. [DOI] [PMC free article] [PubMed] [Google Scholar]
- Ettayebi K, Crawford SE, Murakami K, Broughman JR, Karandikar U, Tenge VR, Neill FH, Blutt SE, Zeng XL, Qu L, et al. Replication of human noroviruses in stem cell-derived human enteroids. Science. 2016;353:1387–1393. doi: 10.1126/science.aaf5211. [DOI] [PMC free article] [PubMed] [Google Scholar]
- Gasiorowski RE, Ju X, Hart DN, Clark GJ. CD300 molecule regulation of human dendritic cell functions. Immunol Lett. 2013;149:93–100. doi: 10.1016/j.imlet.2012.10.005. [DOI] [PubMed] [Google Scholar]
- Higuchi R, Krummel B, Saiki RK. A general method of in vitro preparation and specific mutagenesis of DNA fragments: study of protein and DNA interactions. Nucleic Acids Res. 1988;16:7351–7367. doi: 10.1093/nar/16.15.7351. [DOI] [PMC free article] [PubMed] [Google Scholar]
- Jones MK, Watanabe M, Zhu S, Graves CL, Keyes LR, Grau KR, Gonzalez-Hernandez MB, Iovine NM, Wobus CE, Vinje J, et al. Enteric bacteria promote human and mouse norovirus infection of B cells. Science. 2014;346:755–759. doi: 10.1126/science.1257147. [DOI] [PMC free article] [PubMed] [Google Scholar]
- Karst SM, Wobus CE, Goodfellow IG, Green KY, Virgin HW. Advances in norovirus biology. Cell Host Microbe. 2014;15:668–680. doi: 10.1016/j.chom.2014.05.015. [DOI] [PMC free article] [PubMed] [Google Scholar]
- Kuss SK, Best GT, Etheredge CA, Pruijssers AJ, Frierson JM, Hooper LV, Dermody TS, Pfeiffer JK. Intestinal microbiota promote enteric virus replication and systemic pathogenesis. Science. 2011;334:249–252. doi: 10.1126/science.1211057. [DOI] [PMC free article] [PubMed] [Google Scholar]
- Mackay LK, Rahimpour A, Ma JZ, Collins N, Stock AT, Hafon ML, Vega-Ramos J, Lauzurica P, Mueller SN, Stefanovic T, et al. The developmental pathway for CD103(+)CD8+ tissue-resident memory T cells of skin. Nat Immunol. 2013;14:1294–1301. doi: 10.1038/ni.2744. [DOI] [PubMed] [Google Scholar]
- Nice TJ, Baldridge MT, McCune BT, Norman JM, Lazear HM, Artyomov M, Diamond MS, Virgin HW. Interferon-lambda cures persistent murine norovirus infection in the absence of adaptive immunity. Science. 2015;347:269–273. doi: 10.1126/science.1258100. [DOI] [PMC free article] [PubMed] [Google Scholar]
- Nice TJ, Strong DW, McCune BT, Pohl CS, Virgin HW. A single-amino-acid change in murine norovirus NS1/2 is sufficient for colonic tropism and persistence. J Virol. 2013;87:327–334. doi: 10.1128/JVI.01864-12. [DOI] [PMC free article] [PubMed] [Google Scholar]
- Odorizzi PM, Pauken KE, Paley MA, Sharpe A, Wherry EJ. Genetic absence of PD-1 promotes accumulation of terminally differentiated exhausted CD8+ T cells. J Exp Med. 2015;212:1125–1137. doi: 10.1084/jem.20142237. [DOI] [PMC free article] [PubMed] [Google Scholar]
- Orchard RC, Wilen CB, Doench JG, Baldridge MT, McCune BT, Lee YC, Lee S, Pruett-Miller SM, Nelson CA, Fremont DH, Virgin HW. Discovery of a proteinaceous cellular receptor for a norovirus. Science. 2016;353:933–936. doi: 10.1126/science.aaf1220. [DOI] [PMC free article] [PubMed] [Google Scholar]
- Osborne LC, Monticelli LA, Nice TJ, Sutherland TE, Siracusa MC, Hepworth MR, Tomov VT, Kobuley D, Tran SV, Bittinger K, et al. Coinfection. Virus-helminth coinfection reveals a microbiota-independent mechanism of immunomodulation. Science. 2014;345:578–582. doi: 10.1126/science.1256942. [DOI] [PMC free article] [PubMed] [Google Scholar]
- Quinn M, Turula H, Tandon M, Deslouches B, Moghbeli T, Snyder CM. Memory T cells specific for murine cytomegalovirus re-emerge after multiple challenges and recapitulate immunity in various adoptive transfer scenarios. J Immunol. 2015;194:1726–1736. doi: 10.4049/jimmunol.1402757. [DOI] [PMC free article] [PubMed] [Google Scholar]
- Singer M, Wang C, Cong L, Marjanovic ND, Kowalczyk MS, Zhang H, Nyman J, Sakuishi K, Kurtulus S, Gennert D, et al. A Distinct Gene Module for Dysfunction Uncoupled from Activation in Tumor-Infiltrating T Cells. Cell. 2016;166:1500–1511e1509. doi: 10.1016/j.cell.2016.08.052. [DOI] [PMC free article] [PubMed] [Google Scholar]
- Snyder CM. Buffered memory: a hypothesis for the maintenance of functional, virus-specific CD8(+) T cells during cytomegalovirus infection. Immunol Res. 2011;51:195–204. doi: 10.1007/s12026-011-8251-9. [DOI] [PubMed] [Google Scholar]
- Tomov VT, Osborne LC, Dolfi DV, Sonnenberg GF, Monticelli LA, Mansfield K, Virgin HW, Artis D, Wherry EJ. Persistent enteric murine norovirus infection is associated with functionally suboptimal virus-specific CD8 T cell responses. J Virol. 2013;87:7015–7031. doi: 10.1128/JVI.03389-12. [DOI] [PMC free article] [PubMed] [Google Scholar]
- van de Berg PJ, Yong SL, Remmerswaal EB, van Lier RA, ten Berge IJ. Cytomegalovirus-induced effector T cells cause endothelial cell damage. Clin Vaccine Immunol. 2012;19:772–779. doi: 10.1128/CVI.00011-12. [DOI] [PMC free article] [PubMed] [Google Scholar]
- Welten SP, Redeker A, Franken KL, Benedict CA, Yagita H, Wensveen FM, Borst J, Melief CJ, van Lier RA, van Gisbergen KP, Arens R. CD27–CD70 costimulation controls T cell immunity during acute and persistent cytomegalovirus infection. J Virol. 2013;87:6851–6865. doi: 10.1128/JVI.03305-12. [DOI] [PMC free article] [PubMed] [Google Scholar]
- West EE, Youngblood B, Tan WG, Jin HT, Araki K, Alexe G, Konieczny BT, Calpe S, Freeman GJ, Terhorst C, et al. Tight regulation of memory CD8(+) T cells limits their effectiveness during sustained high viral load. Immunity. 2011;35:285–298. doi: 10.1016/j.immuni.2011.05.017. [DOI] [PMC free article] [PubMed] [Google Scholar]
- Wherry EJ, Kurachi M. Molecular and cellular insights into T cell exhaustion. Nat Rev Immunol. 2015;15:486–499. doi: 10.1038/nri3862. [DOI] [PMC free article] [PubMed] [Google Scholar]
- Wherry EJ, Rajagopal D, Eisenlohr LC. Use of vaccinia virus expression vectors to investigate antigen processing and presentation. Methods Mol Biol. 2001;156:89–109. doi: 10.1385/1-59259-062-4:89. [DOI] [PubMed] [Google Scholar]
- Woodham AW, Yan L, Skeate JG, van der Veen D, Brand HH, Wong MK, Da Silva DM, Kast WM. T cell ignorance is bliss: T cells are not tolerized by Langerhans cells presenting human papillomavirus antigens in the absence of costimulation. Papillomavirus Res. 2016;2:21–30. doi: 10.1016/j.pvr.2016.01.002. [DOI] [PMC free article] [PubMed] [Google Scholar]
- Zhu S, Jones MK, Hickman D, Han S, Reeves W, Karst SM. Norovirus antagonism of B-cell antigen presentation results in impaired control of acute infection. Mucosal Immunol. 2016;9:1559–1570. doi: 10.1038/mi.2016.15. [DOI] [PMC free article] [PubMed] [Google Scholar]
- Zhu S, Regev D, Watanabe M, Hickman D, Moussatche N, Jesus DM, Kahan SM, Napthine S, Brierley I, Hunter RN, 3rd, et al. Identification of immune and viral correlates of norovirus protective immunity through comparative study of intra-cluster norovirus strains. PLoS Pathog. 2013;9:e1003592. doi: 10.1371/journal.ppat.1003592. [DOI] [PMC free article] [PubMed] [Google Scholar]
Associated Data
This section collects any data citations, data availability statements, or supplementary materials included in this article.