

Abstract
Background
The aim of this study was to evaluate the relationship between P wave and QT dispersions (PWD and QTD) during the course of severe peripheral artery disease (PAD).
Material/Methods
We recruited 163 patients who underwent peripheral angiography (PA) between August 2011 and March 2017, and they were divided into 2 groups according to the severity of PAD on PA. PWD and QTD were investigated using 12-lead electrocardiograms. Group One consisted of patients diagnosed with <70% stenosis on PA, who eventually received medical treatment; Group Two consisted of patients diagnosed with ≥70% stenosis on PA, who eventually underwent surgery.
Results
ROC curve analysis of the 2 groups demonstrated that PWD was significantly higher in Group Two (AUC: 0.913505; 95% confidence interval (CI): 0.859365 to 0.951788; p<0.0001). The Youden index showed that a cut-off PWD value of >35 msn predicted a peripheral artery stenosis of ≥70% with a sensitivity of 88.89% and a specificity of 85.37% (+LR: 6.07, −LR: 0.13). Moreover, QTD was significantly higher in Group Two (AUC: 0.884749; 95% CI: 0.825489 to 0.929391; p<0.0001). Youden index showed that a cut-off QTD value of >75 msn predicted a peripheral artery stenosis of ≥70% with a sensitivity of 76.54% and a specificity of 85.37% (+LR: 5.23, −LR: 0.27). Comparison of ROC curves showed no difference in terms of predicting peripheral artery stenosis of ≥70% between PWD and QTD (p=0.3308).
Conclusions
Interpreting PWD and QTD offers a non-invasive and cost-effective assessment method for detecting patients at high risk for coronary artery disease in the context of severe PAD.
MeSH Keywords: Coronary Artery Disease, Electrocardiography, Peripheral Arterial Disease
Background
Cardiovascular disease common in the general population, leading to significant morbidity and mortality [1]. It includes peripheral artery disease (PAD) and coronary artery disease (CAD); both are general diseases of the arterial system and are often encountered together. P wave and QT dispersions (PWD and QTD) are novel electrocardiographic parameters that signify inhomogeneous and discontinuous atrial conduction and heterogeneity of ventricular repolarization, respectively [2,3]. The presence of a prolonged PWD has been shown to be more frequent among patients with a previous history of idiopathic paroxysmal atrial fibrillation (PAF) and stable CAD [4,5]. Previously conducted studies demonstrated that PWD has a predictive value for PAF in patients with different clinical conditions [6,7]. QTD, on the other hand, appears to increase in patients with acute myocardial infarction and significant stable coronary stenosis [8,9].
In daily practice, it is important for a heart team to make decisions about which patients should be screened for CAD, particularly for patients diagnosed with PAD without a prior history of ischemic heart disease. In this study, we investigated the relationship between PWD-QTD and the severity of PAD, in order to predict patients with a concealed CAD.
Material and Methods
This was a single-center, retrospective study. The study protocol was approved by the local Non-Invasive Ethics Committee. We screened 203 patients who underwent peripheral angiography (PA) between August 2011 and March 2017. Those with previously known CAD, echocardiographic regional wall motion abnormalities, pathologic Q waves on electrocardiogram, and idiopathic PAF that may already have increased PWD and QTD were excluded; the remaining 163 patients were enrolled in the study.
Standard 12-lead electrocardiograms (ECG) of each patient was analyzed for PWD and QTD. P wave intervals were evaluated in all derivations and the difference between the longest and the shortest P wave (Pmax and Pmin, respectively) was calculated as PWD. The QT interval was described as a measure of the time between the initiation of the Q wave and the end of the T wave [6], and QTD was defined as the difference between the longest and the shortest QT interval (QTmax and QTmin, respectively) on the ECG [7]. In order to achieve better precision in measuring PWD and QTD, all 12 ECG leads were recorded digitally and onscreen measurement of the P wave and QT interval was performed. Three repeated measurements were performed by 3 investigators.
The PA was performed only when patients were symptomatic and diagnosed with >50% narrowing of their lower-extremity arteries via Doppler ultrasound. Symptomatic patients were defined as patients with peripheral occlusive disease with resting pain, severe intermittent claudication, and critical limb ischemia. A high-frequency (around 8–15 MHz) linear array was used for tibial/pedal arteries, a lower-frequency linear array (approximately 4–9 MHz) was used for femoral and popliteal arteries, and a curvilinear array (1–4 MHz) was used for iliac arteries, the aorta, and femoral arteries in larger patients. The severity of the stenosis was described by the change in peak systolic velocity (PSV). An increased severity of stenosis is reflected by an increase in the PSV ratio; a PSV ratio of 2 was used to indicate >50% stenosis. The PA images were reviewed by 3 investigators who were blinded to the results of the Doppler ultrasound. Peripheral artery bypass surgery (PABS) was typically indicated for symptomatic patients with a stenosis greater than 70% in lower-extremity arteries. Three repeated measurements for each patient were used for calculating intraobserver and interobserver variability. The interclass correlation coefficient (ICC) was the statistical tool used for estimating the strength of concordance. Table 1 indicates ICC values of each parameter.
Table 1.
The interclass correlation coefficient (ICC) values of PWD, QTD and PAD.
| Interobserver ICC (concordance) | Intraobserver ICC (concordance) | |
|---|---|---|
| PWD | 94.3% (very good) | 92.7% (very good) |
| QTD | 93.4% (very good) | 91.8% (very good) |
| PAD | 92.1% (very good) | 92.9% (very good) |
PWD – P wave dispersion, QTD – QT dispersion, PAD – peripheral artery disease.
The participants were divided into 2 groups according to the severity of their PAD. Group One consisted of patients diagnosed with <70% stenosis on PA, who eventually received medical treatment. Group Two consisted of patients with ≥70% stenosis on PA, on whom PABS was eventually performed.
Statistical analysis
Statistical analysis was performed using the MedCalc Software program (Ostend, Belgium). Data are presented as mean, standard deviation, median, minimum, maximum, percentage, and number. The normality of distribution for continuous variables was confirmed with the Kolmogorov-Smirnov test; the Mann-Whitney U test was also used, according to the distribution pattern of the continuous variables. Receiver operating characteristic (ROC) curve analysis and the Youden index were used to determine the optimum cut-off PWD and QTD values that predict a peripheral artery stenosis of ≥70%. A two-tailed P-value smaller than 0.05 was considered as a statistical significant difference between groups.
Results
The study group consisted of 163 patients, with a mean age of 62.36±11.27 years. There were 140 male (85.9%) and 23 female (14.1%) participants; their demographic characteristics are presented in Table 2. Group Two had significantly more diabetic patients and smokers (p=0.001) than Group One, and its members were significantly older (p<0.001).
Table 2.
Demographic characteristics of the study group.
| Group 1 (Medical follow-up) (n: 82) | Group 2 (Peripheral artery bypass surgery) (n: 81) | P value | |
|---|---|---|---|
| Age (years) | 57.5±11.76 | 67.27±8.29 | p<0.001 |
|
| |||
| Diabetes mellitus | (n: 20 vs. n: 62) | (n: 41 vs. n: 40) | p=0.001 |
| (positive vs. negative) | 24.4% vs. 75.6% | 50.6% vs. 49.6% | |
|
| |||
| Hyperlipidemia | (n: 27 vs. n: 55) | (n: 30 vs. n: 51) | p=0.582 |
| (positive vs. negative) | 32.9% vs. 67.1% | 37.0% vs. 63.0% | |
|
| |||
| Hypertension | (n: 33 vs. n: 49) | (n: 39 vs. n: 42) | p=0.310 |
| (positive vs. negative) | 40.2% vs. 59.8% | 48.1% vs. 51.9% | |
|
| |||
| Smoking | (n: 52 vs. n: 30) | (n: 70 vs. n: 11) | P<0.001 |
| (positive vs. negative) | 63.4% vs. 36.6% | 86.4% vs. 13.6% | |
|
| |||
| COPD | (n: 6 vs. n: 76) | (n: 4 vs. n: 77) | p=0.746 |
| (positive vs. negative) | 7.3% vs. 92.7% | 4.9% vs. 95.1% | |
|
| |||
| Gender | (n: 70 vs. n: 12) | (n: 70 vs. n: 11) | p=0.847 |
| (Male vs. Female) | 85.4% vs. 14.6% | 86.4% vs. 13.6% | |
COPD – chronic obstructive pulmonary disease.
ROC Curve analysis of the 2 groups demonstrated that PWD was significantly higher in Group Two (AUC: 0.913505; 95% Confidence Interval: 0.859365 to 0.951788; p<0.0001) (Figure 1). The Youden index showed that a cut-off PWD value of >35 msn predicted a peripheral artery stenosis of 70% or more, with a sensitivity of 88.89% and a specificity of 85.37% (+LR: 6.07, −LR: 0.13) (Figure 2). Additionally, the ROC Curve analysis demonstrated that QTD was significantly higher in Group Two (AUC: 0.884749; 95% Confidence Interval: 0.825489 to 0.929391; p<0.0001) (Figure 3). A cut-off QTD value of >75 msn predicted a peripheral artery stenosis of ≥70% with a sensitivity of 76.54% and a specificity of 85.37% (+LR: 5.23, −LR: 0.27), according to the Youden index (Figure 4). Comparison of ROC curves showed no difference between PWD and QTD in terms of predicting peripheral artery stenosis of ≥70%(p=0.3308) (Figure 5).
Figure 1.
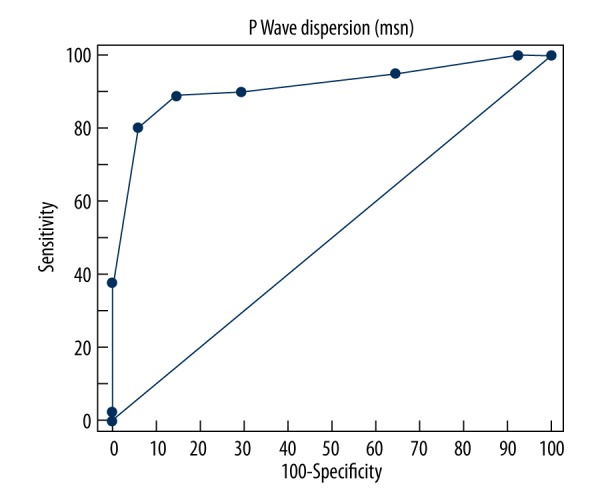
ROC Curve analysis of P wave dispersion in patients in whom peripheral artery bypass surgery was performed (AUC: 0.913505; 95% confidence Interval: 0.859365 to 0.951788; p<0.0001).
Figure 2.
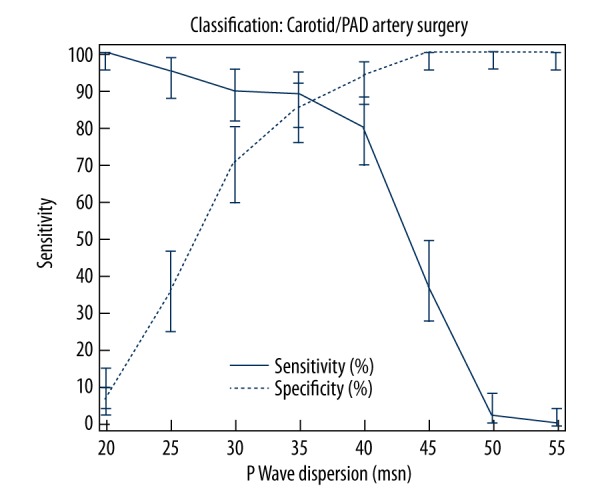
Youden index showing that a cut-off P Wave Dispersion value of >35 msn predicted a peripheral artery stenosis of ≥70% with a sensitivity of 88.89% and a specificity of 85.37% (+LR: 6.07, −LR: 0.13).
Figure 3.
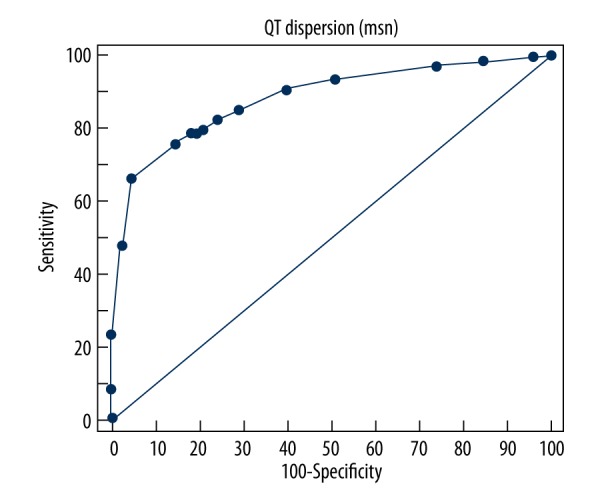
ROC Curve analysis of QT dispersion in patients in whom peripheral artery bypass surgery was performed (AUC: 0,884749; 95% confidence interval: 0.825489 to 0.929391; p<0.0001).
Figure 4.

Youden index showing that a cut-off QTD value of >70 msn predicted a peripheral artery stenosis of ≥70% with a sensitivity of 76.54% and a specificity of 85.37% (+LR: 5.23, −LR: 0.27).
Figure 5.

Comparison of ROC curves of P wave dispersion (PWD) and QT dispersion (QTD) indicating that there was no difference in terms of predicting peripheral artery stenosis of ≥70% between PWD and QTD (p=0.3308).
Discussion
Previous studies indicated that CAD patients are at high risk for postoperative myocardial complications [4,5]. Given the systemic nature of atherosclerosis, there is a high prevalence of CAD in the patient population scheduled for PABS. Recent studies have shown that coronary angiography and revascularization as needed prevent postoperative cardiac complications during and after noncardiac surgery [8,9]. In daily practice, it is a common approach for surgeons to monitor patients undergoing PABS for underlying obstructive CAD when they have a history of CAD or signs of ischemia on ECG or echocardiography. On the other hand, the question of whether routine coronary angiography should be performed before PABS in asymptomatic patients still remains.
PWD and QTD are novel ECG parameters that have recently started to take their places in daily practice. Signs of ischemia on ECG include ST segment depression, T wave flattening or inversion, and pathological Q waves. Atrial ischemia results in slow conduction in the ischemic zone, and conduction in the atrium becomes more heterogeneous. The difference in the conduction properties between normal tissue and ischemic atrial myocardium may cause discontinuous distribution of sinus impulses [10,11]. Yilmaz et al. found that PWD was greater in patients with stable CAD than in controls, and that it was associated with the severity of disease [11]. Hemodynamic and anatomic alterations in the left atrium, such as left atrial dilatation, left atrial fibrosis, and increased left atrial pressure, caused by both left ventricular dysfunction and ischemia, may be possible underlying causes of increased PWD in patients with CAD [12]. In patients with severe chronic CAD, however, increased left atrial overload due to changes in left ventricular relaxation caused by regional fibrosis and ischemic areas may be associated with increased PWD [13].
QTD also indicates heterogeneity of ventricular repolarization. Repolarization impairments caused by ischemia and regional fibrosis due to chronic ischemia may be the reasons for the increased QTD detected in patients with CoAD [9]. QTD may increase the incidence of sudden death and ventricular tachycardia in various cardiovascular conditions and noncardiac diseases [7,14]. Zareba et al. suggested that a prolonged QTD was common in patients with CoAD, and that this was an independent risk factor for arrhythmic cardiac deaths [15,16]. Recently, Pan et al. found that the absolute QTD change after primary PCI was an independent predictor of the development of major cardiovascular events in patients with single-vessel disease and acute ST elevation myocardial infarction [17].
Considering the underlying pathogenesis of atherosclerosis, one can assume that the severity of CAD increases with the severity of PAD. Indeed, an analysis of our single-center data for patients who received PABS indicated that as the severity and extent of PAD caused deterioration, the frequency of PWD and QTD prolongation on 12-lead ECG increased in patients without a history of CAD. Although many other non-invasive and reliable tools to evaluate the possibility of CAD in PAD patients are available, interpreting PWD and QTD offers a cost-effective assessment method. Hence, in the light of new developments and our findings, we believe that patients undergoing PABS with increased PWD and QTD on ECG, and without a history of CAD, should be carefully examined for underlying CAD in order to limit postoperative myocardial events.
Conclusions
CAD frequently co-occurs with PAD and has been known to increase postoperative complications. This study shows the association of PWD and QTD with the severity of PAD in patients undergoing PABS. These parameters have the potential to be helpful and inexpensive predictors of significant CAD in patients undergoing PABS without a previous history of CAD.
Footnotes
Conflict of interest
None.
Source of support: Departmental sources
References
- 1.Bhatt DL, Eagle KA, Ohman EM, et al. Comparative determinants of 4-year cardiovascular event rates in stable outpatients at risk of or with atherothrombosis. JAMA. 2010;304:1350–57. doi: 10.1001/jama.2010.1322. [DOI] [PubMed] [Google Scholar]
- 2.Dilaveris PE, Gialafos JE. P-wave dispersion: A novel predictor of paroxysmal atrial fibrillation. Ann Noninvasive Electrocardiol. 2001;6:159–65. doi: 10.1111/j.1542-474X.2001.tb00101.x. [DOI] [PMC free article] [PubMed] [Google Scholar]
- 3.Dekker JM, Crow RS, Hannan PJ, et al. Heart rate-corrected QT interval prolongation predicts risk of coronary heart disease in black and white middle-aged men and women: The ARIC study. J AM CollCardiol. 2004;43:565–71. doi: 10.1016/j.jacc.2003.09.040. [DOI] [PubMed] [Google Scholar]
- 4.Dilaveris PE, Gialafos EJ, Sideris SK, et al. Simple electrocardiographic markers for the prediction of paroxysmal idiopathic atrial fibrillation. Am Heart J. 1998;135( 5 Pt 1):733–38. doi: 10.1016/s0002-8703(98)70030-4. [DOI] [PubMed] [Google Scholar]
- 5.Akin F, Firatli I, Katkat F, et al. P-wave dispersion and its relationship with the severity of the disease in patients with stable coronary artery disease. North Clin Istanb. 2014;1(2):65–70. doi: 10.14744/nci.2014.25733. [DOI] [PMC free article] [PubMed] [Google Scholar]
- 6.Zhang X, Zeng W, Li Y, et al. Evaluation of P wave dispersion and tissue Doppler imaging for predicting paroxysmal atrial fibrillation in patients with hypertension. Heart Surg Forum. 2018;21(1):E054–58. doi: 10.1532/hsf.1831. [DOI] [PubMed] [Google Scholar]
- 7.Bozkurt Yilmaz HE, Yilmaz M, Şen N, et al. Assessment of atrial fibrillation and ventricular arrhythmia risk in patients with asthma by P wave/corrected QT interval dispersion. Eur Rev Med Pharmacol Sci. 2018;22(3):756–62. doi: 10.26355/eurrev_201802_14308. [DOI] [PubMed] [Google Scholar]
- 8.Glancy JM, Garrat CJ, de Bono DP. Dynamics of QT dispersion during myocardial infarction and ischemia. Int J Cardiol. 1996;57:55–60. doi: 10.1016/s0167-5273(96)02732-5. [DOI] [PubMed] [Google Scholar]
- 9.Şahin BD, Yıldırım E, Ipek E. The eelationship between P & QT dispersions and presence & severity of stable coronary artery disease. Korean Circ J. 2016;46(4):522–29. doi: 10.4070/kcj.2016.46.4.522. [DOI] [PMC free article] [PubMed] [Google Scholar]
- 10.Lammers WJ, Kirchhof C, Bonke FI, et al. Vulnerability of rabbit atrium to reentry by hypoxia. Role of inhomogeneity in conduction and wave length. Am J Physiol. 1992;262:H47–55. doi: 10.1152/ajpheart.1992.262.1.H47. [DOI] [PubMed] [Google Scholar]
- 11.Yilmaz R, Demirbag R. P-wave dispersion in patients with stable coronary artery disease and its relationship with severity of the disease. J Electrocardiol. 2005;38:279–84. doi: 10.1016/j.jelectrocard.2005.02.003. [DOI] [PubMed] [Google Scholar]
- 12.Okutucu S, Aytemir K, Oto A. P-wave dispersion: What we know till now? JRSM Cardiovasc Dis. 2016;5:2048004016639443. doi: 10.1177/2048004016639443. [DOI] [PMC free article] [PubMed] [Google Scholar]
- 13.Elsässer A, Schlepper M, Klövekorn WP, et al. Hibernating myocardium: An incomplete adaptation to ischemia. Circulation. 1997;96:2920–31. doi: 10.1161/01.cir.96.9.2920. [DOI] [PubMed] [Google Scholar]
- 14.Akın A, Unal E, Yıldırım R, et al. Evaluation of QT dispersion and Tp-e interval in children with subclinical hypothyroidism. Pacing Clin Electrophysiol. 2018;41(4):372–75. doi: 10.1111/pace.13286. [DOI] [PubMed] [Google Scholar]
- 15.Zareba W, Moss AJ, le Cessie S. Dispersion of ventricular repolarization and arrhythmic death in coronary artery disease. Am J Cardiol. 1994;74:550–53. doi: 10.1016/0002-9149(94)90742-0. [DOI] [PubMed] [Google Scholar]
- 16.Helmy H, Abdel-Galeel A, Taha Kishk Y, et al. Correlation of corrected QT dispersion with the severity of coronary artery disease detected by SYNTAX score in non-diabetic patients with STEMI. Egypt Heart J. 2017;69(2):111–17. doi: 10.1016/j.ehj.2016.12.001. [DOI] [PMC free article] [PubMed] [Google Scholar]
- 17.Pan KL, Hsu JT, Chang ST, et al. Prognostic value of QT dispersion change following primary percutaneous coronary intervention in acute ST elevation myocardial infarction. Int Heart J. 2011;52(4):207–11. doi: 10.1536/ihj.52.207. [DOI] [PubMed] [Google Scholar]