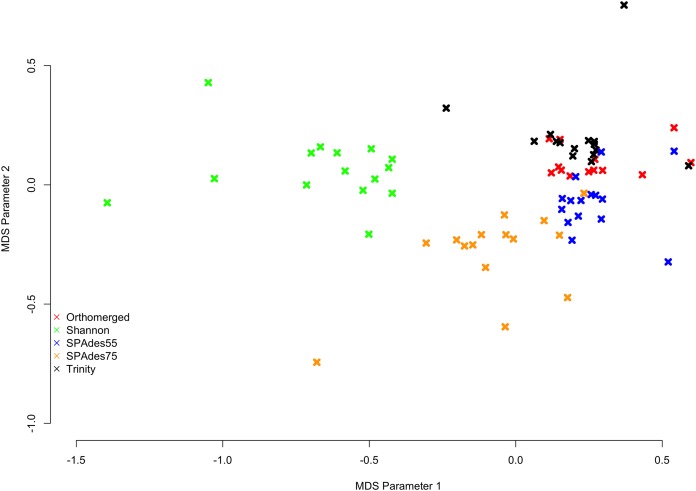
Figure 1. MDS plot describing the similarity within and between assemblers.
Colored x’s mark individual assemblies, with red marks corresponding to the ORP assemblies, green marks corresponding to the Shannon assemblies, blue marks corresponding to the SPAdes55 assemblies, orange marks corresponding to the SPAdes75 assemblies, and the black marks corresponding to the Trinity assemblies. In general assemblies produced by a given assembler tend to cluster together.

