

Abstract
Explosion of the availability of big data sources along with the development in computational methods provides a useful framework to study drugs’ actions, such as interactions with pharmacological targets and off-targets. Databases related to protein interactions, adverse effects and genomic profiles are available to be used for the construction of computational models. In this article, we focus on the description of biological profiles for drugs that can be used as a system to compare similarity and create methods to predict and analyze drugs’ actions. We highlight profiles constructed with different biological data, such as target–protein interactions, gene expression measurements, adverse effects and disease profiles. We focus on the discovery of new targets or pathways for drugs already in the pharmaceutical market, also called drug repurposing, in the interaction with off-targets responsible for adverse reactions and in drug–drug interaction analysis. The current and future applications, strengths and challenges facing all these methods are also discussed. Biological profiles or signatures are an important source of data generation to deeply analyze biological actions with important implications in drug-related studies.
Keywords: drug profiles, similarity, repurposing, adverse effects, drug-drug interactions
Introduction
Similarity has been widely exploited to discover and design drugs with similar properties. Chemical similarity has shown many applications in medicinal chemistry and drug discovery [1, 2]. The concept of similarity is highly dependent, however, on the features used to make the comparison. With the development of scientific fields such as bioinformatics, systems biology and pharmacogenomics, we have access to big data sources of drug information that are useful to extract profiles or biological signatures of the drugs. These biological profiles are descriptors through which we can compare drugs and infer new molecular properties. Most of the approaches exploit the idea that drugs that share properties can have similar efficacy or mechanism of action. Advances in integrative algorithms and data analysis have facilitated the development of this type of strategy [3].
The basic molecular structure fingerprint is a molecular representation in which each fragment, substructure or pharmacophoric feature is represented in a position of a bit vector. The position contains binary values (1 or 0) representing the presence or absence of a particular substructure. In a similar way, as molecular fingerprints codify the molecular structure, other biological fingerprints, profiles or signatures can follow the same concept and codify the presence or absence of different biological properties, such as interaction with targets, over expression of some genes, adverse drug effects or other biological features (see Figure 1). Examples of binary fingerprints and drug similarity approaches are provided in the literature [4–6]. Besides binary profiles, the biological signature could also contain non-binary quantitative data, such as frequency of adverse effects or different gene expression levels. Although the comparison of the structural similarity has been widely used, we focus here on the comparison between drugs, but we pay special attention to biological signatures to infer new candidates for drugs’ actions. We understand biological signatures as a type of drug signature derived from the interaction between drugs and proteins in the organism and hence, target signatures, but also biological processes dependent on protein interaction, such as adverse effects and gene expression or transcriptional responses. Our intention is to focus on the application of big biological data as molecular descriptors to evaluate similarity between drugs and describe predictive patterns based on those biological profiles.
Figure 1.
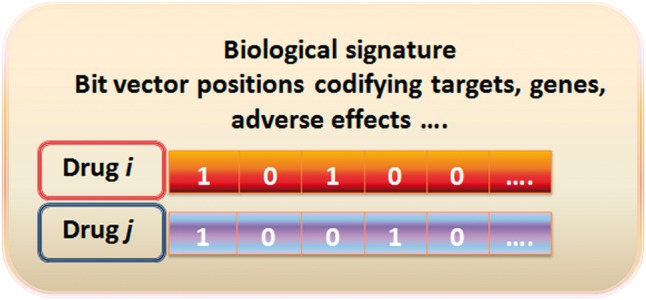
Example of a drug biological signature: the different biological features, i.e. targets, genes, etc, are codified in the drug fingerprint or signature through 1 (presence of the feature) or 0 (absence of the feature). A colour version of this figure is available at BIB online: https://academic.oup.com/bib.
In this review, we describe the applicability of drug profiles to predict important phenomena in biomedicine, such as drug repurposing, adverse drug effects and drug–drug interactions (DDIs). Drug repurposing has large potential in drug discovery and development. It is the process of discovering new alternative uses for existing drugs besides the original and approved medical indication. From discovery until final approval, molecules have to be tested from the point of view of efficacy and safety with the associated costs and risks [7]. In fact, it has been estimated that the cost to bring a new drug to the pharmaceutical market can surpass $1 billion [8]. Because drugs already in the market have been extensively studied, the discovery of novel targets for existing drugs is a useful strategy that can reduce cost and time associated with drug development processes [9]. Thus, there is an increasing interest in elaborating new methods for drug repurposing. Moreover, pharmaceutical companies have sets of experimental drug candidates in their pipelines with successful safety results but not satisfactory efficacy shown in Phases II and III. This fact implies that the search with repurposing objectives includes not only drugs in the market but also large sets of experimental drugs.
On the other hand, adverse drug reactions constitute also an important problem in drug development and postmarketing safety [10, 11]. Adverse drug effects are an important cause of drug failure in the development process as well as an important concern in patient safety once the drug is in the market. Adverse effects can cause important harm to the population and dramatically increase the health system cost [12, 13]. Development of methods to better detect adverse drug effects is a priority in current research including different steps such as preclinical development, clinical trials and postmarketing drug safety surveillance [14, 15]. Moreover, DDIs are also an important concern in experimental and in postmarketing steps. DDIs are the cause of many adverse drug reactions and increase public health costs [16, 17]. In this article, we will describe the different biological drug profiles that have been already used to evaluate drug similarity and hence predict and generate drug candidates for new pharmacological applications, possible adverse effects and DDIs. The main flowchart of the current article is described in Figure 2.
Figure 2.
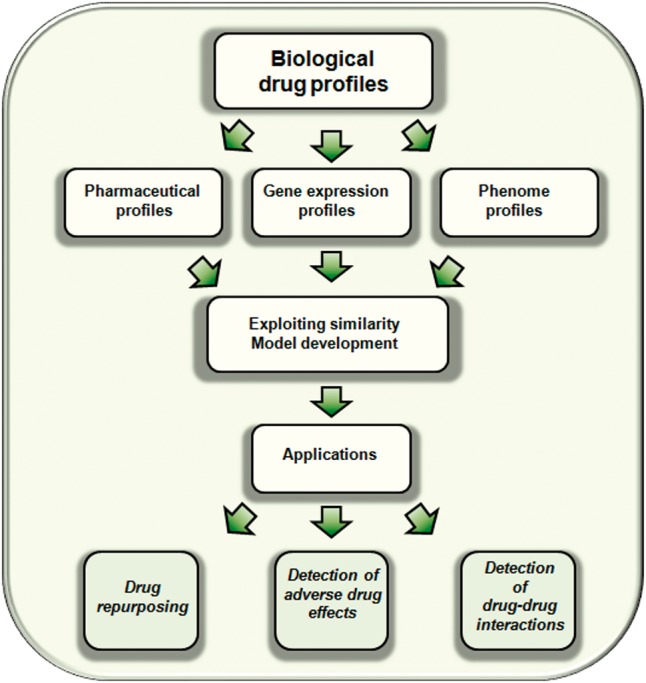
Flowchart of the main topics described in the current article.
Pharmaceutical profiles
In a similar way as chemical fingerprints codify in each bit vector position the presence or absence of structural patterns, it is possible to codify alternative biological features in the vector, such as interactions with targets or anatomic/therapeutic features. We included as pharmaceutical profiles the molecular structure fingerprints, two main types of fingerprints that codify target features, and therapeutic profiles. On one hand, protein–ligand interaction fingerprints codify the binding of the ligand inside the protein pocket, i.e. important features for the interaction with the receptor, such as possible hydrogen bonds. On the other hand, a second type of drug–target fingerprint codifies the interaction or non-interaction with a set of targets described in a pharmacological data source.
Molecular structure fingerprints
Molecular structure fingerprints have been widely used to compare chemical similarity and discover new chemical entities with diverse biological functions. Many of them have shown great applicability in medicinal chemistry [18–21], in the detection of DDIs [22] and in the prediction of adverse effects [23–26]. We do not intend to provide an exhaustive description of all the studies and chemical fingerprints described in the literature, and so, we encourage the reading of some excellent protocols and reviews already published that describe more deeply the concept of different molecular structure fingerprints and their application [1, 27–29]. These articles describe the different representations, coefficients or measurements to quantify similarity between fingerprints, as well as performance and effectiveness in virtual screenings and similarity searches. We have instead focused on more biological details rather than chemical drug profiles.
Protein–ligand interaction fingerprints
The use of protein–ligand interaction fingerprints that describe the binding of the ligands in the protein active site is a popular approach with promising results in drug discovery. The interactions described in the protein–ligand crystallized structures or from docking calculations can be transformed in a binary string. In each bit position the fingerprint codifies the presence or absence of different residue–ligand interactions, such as hydrogen bonds, hydrophobic or ionic interactions, among others. Interaction fingerprints can have applications in prioritization of hypothetical binding modes extracted from molecular docking simulations, alignment of protein–ligand complexes, virtual screening and discrimination between true ligands and decoys [30–35]. Comparison of protein–ligand interaction patterns can also yield interesting results in polypharmacology, target prediction and drug repurposing [36]. Moreover, applicability in the detection of adverse effects through the study of interactions with off-targets can also be achieved with these types of fingerprints [37]. There are some reviews that describe these approaches in detail as well as their application in virtual screening and medicinal chemistry [38].
Target profile fingerprints
A second type of target fingerprint, which we call target profile fingerprints, can also be used as a measure to compare similarity between drugs to generate predictive models of new drug–target interactions, drug-adverse effects associations and DDIs. For instance, Napolitano et al. [39] proposed a drug repurposing approach computing drug similarity based on molecular targets. Each drug is represented as a bit vector that codifies in each position the presence or absence of the targets described in DrugBank [40]. The Tanimoto coefficient (TC) was calculated to quantify the degree of similarity between pairs of fingerprints. The authors integrated other types of similarity, such as chemical and gene expression similarity, to generate an integrative predictor.
Biological spectra analysis relating biological activity profiles with molecular structures can also be developed. Fliri et al. [41] compared activity profiles tested at single ligand concentrations to establish a relationship between structure and biological effects. Their method allows the prediction of simultaneous interactions between ligands and multiple proteins. The biological spectrum analysis was linked to an adverse effect spectrum extracted from drug labels to provide a predictive mechanism of clinical effects of medicines [42]. Another example of target profiling and its role in the prediction of off-targets and adverse drug effects detection is described by Liu et al. [43]. They integrated protein targets along with other biological and chemical profiles to predict adverse effects using machine learning methods. In their study, each drug is represented as a bit vector codifying information about chemical (molecular substructures), biological (protein targets, transporters, enzymes and pathways) and phenotypic (adverse effects) profiles. They showed that the integration of chemical information with biological signatures yielded high performance. Our research group also calculated target interaction signatures and developed predictive models to enhance the signal detection in pharmacovigilance of adverse drug effects [44]. We applied different similarity-based models, among them target similarity models, to the drug candidates extracted from a medication-wide association study. Our modeling provided a new ranking for the adverse drug effect candidates and prioritized the signals extracted from healthcare data analysis. Besides target information from drug-protein sources, similar biological profiles can be extracted taking into account pathways or bioassay data to study adverse drug reactions [45].
DDIs were also studied using approaches that take into account protein profiles to describe the drugs. There are some examples of integration of similarity data from different sources, among them target-genomic data, to generate heterogeneous networks to predict DDIs through machine learning techniques [46]. Our group developed methods applicable at large scale to detect DDIs based on different similarity measures [47], such as target profile fingerprints. The method implemented drug similarity into a reference standard of well-established DDIs extracted from DrugBank [40]. The models showed excellent performance, pointed out new DDI candidates and integrated the pharmacological-biological effect into the DDI outcome. This similarity-based method using biological profiles was also applied to predict DDIs related to arrhythmias [48] extracted from TWOSIDES [49], a pharmacovigilance database with DDI candidates generated from mining FAERS [50]. Similarity was useful in improving signal detection and provided a decision-making mechanism to help drug safety researchers look for possible DDIs.
Besides ChEMBL [51] or PubChem [52], there are extensive sources where researchers can collect a large set of drug–target interactions and generate target fingerprints [40, 53–57]. Some of the databases are summarized in Table 1 along with the different drug profiles described in the article. A different type of drug profile derived from interactions between drugs and proteins is the DDI profile. The available DDIs for a drug under study in sources such as DrugBank can be represented as a bit vector in a fingerprint. Following this concept, a study was recently published [115] describing DDI profiles to develop a multi-DDI predictor. The model used DDI fingerprints to calculate similarity between pairs of drugs and infer novel putative interactions from the non-intersecting DDIs described in the pair. The system also provided a pharmacological effect associated to the novel interactions.
Table 1.
Summary of drug profiles, databases and references provided in the current study
| Drug profiles | References |
|---|---|
| Pharmaceutical profiles (Drug–target sources: ChEMBL, PubChem, DrugBank, STITCH, SuperTarget, TTD, BindingDB, PharmGKB) | |
| Molecular structure fingerprints | 18–29, 39, 43, 44, 46–48, 58 |
| Protein-ligand interaction fingerprints | 30–38 |
| Target profile fingerprints | 39, 41–48 |
| ATC profiles | 44, 48, 58 |
| Gene expression profiles (Gene expression sources: CMap, NCBI GEO) | 39, 59–103 |
| Phenome profiles (Phenome sources: FAERS, EHRs, SIDER, JAPIC) | |
| Adverse drug effect profiles | 43, 44, 46–48, 58, 104–111 |
| Clinical and disease signatures | 64, 112–114 |
Anatomical Therapeutic Chemical profiles
Anatomical Therapeutic Chemical (ATC) classification system [116] organizes the drugs in different levels according to their anatomical (organ or system), therapeutic, pharmacological and chemical properties. Based on this fact, it is feasible to assess drug similarity comparing ATC profiles. For instance, drug therapeutic similarity was studied by Cheng et al. [58] based on ATC codes extracted from DrugBank. The authors described a computational system to predict drug–target interactions on a network of 621 approved drugs and 893 target proteins by using different drug similarity inference methods, including chemical, side effects and therapeutic space (ATC classification). In another example with applicability in drug safety, the different ATC levels were represented in a fingerprint, and similarity between drugs was calculated through the TC to develop models to predict sets of adverse effects, such as acute renal failure, acute liver failure, acute myocardial infarction and upper gastrointestinal ulcer [44]. Similar protocol was developed to introduce a model to predict DDIs that caused arrhythmias [48]. In both cases the modeling focused on the prioritization of signals extracted from healthcare data. Instead of using ATC codes as a means to generate drug profiles and predict drug properties, the inverse procedure can also be followed, i.e. drug classification or drug ATC profiles can be predicted and hence, associate new ATC classifications for drugs. Dunkel et al. [117, 118] predicted the medical indication area described in the ATC codes based on molecular structure and created the SuperPred Web server. The system also predicts novel targets for drugs and has applications in drug repurposing and safety.
Gene expression signatures
Advances in genome expression profiling, linked to the development of DNA microarrays [119], were a key factor to provide a tool for genome functional analysis. Gene expression signatures are derived from the fact that depending on the cell state, some genes can be over- or under-expressed. The cell state and hence the gene expression profile can be altered as a response by a disease, the action of a chemical or processes such as cell division. By comparing the expression levels of sets of genes (up- or down-regulated) in an altered state (samples with disease or after drug administration) with the expression levels at normal state (samples without disease or drug exposure), it is possible to generate a gene expression signature for the disease or the drug [59, 60]. As an example, when a drug is administered to a patient, the drug can interact with different targets in the organism, causing a disruption of different biological pathways that could be implicated in the regulation of the gene expression. For this reason, after drug administration, it is possible to observe a change in gene expression profiles and hence, infer possible biological actions for the drugs. Gene expression profiles or signatures can be useful to characterize molecular effects caused by drugs [61–64]. In fact, gene expression signatures are promising techniques to study the effects of drugs with great potential in drug repurposing and safety. There are two main research strategies (see Figure 3) taking into account gene expression signatures: (1) Reverse signature, in which gene expression profiles of a drug and a disease are compared looking for inverse correlations. The method is based on the idea that if drug and disease signatures are inversely correlated, then the effect of the drug at the transcriptome level is the opposite of the disease and hence, the drug could treat the disease; (2) Drug signature comparison, where pairs of drug–gene signatures are compared and new targets or pathways are inferred (guilt-by-association). Both methods are discussed in more detail and illustrated with different examples in the current review.
Figure 3.
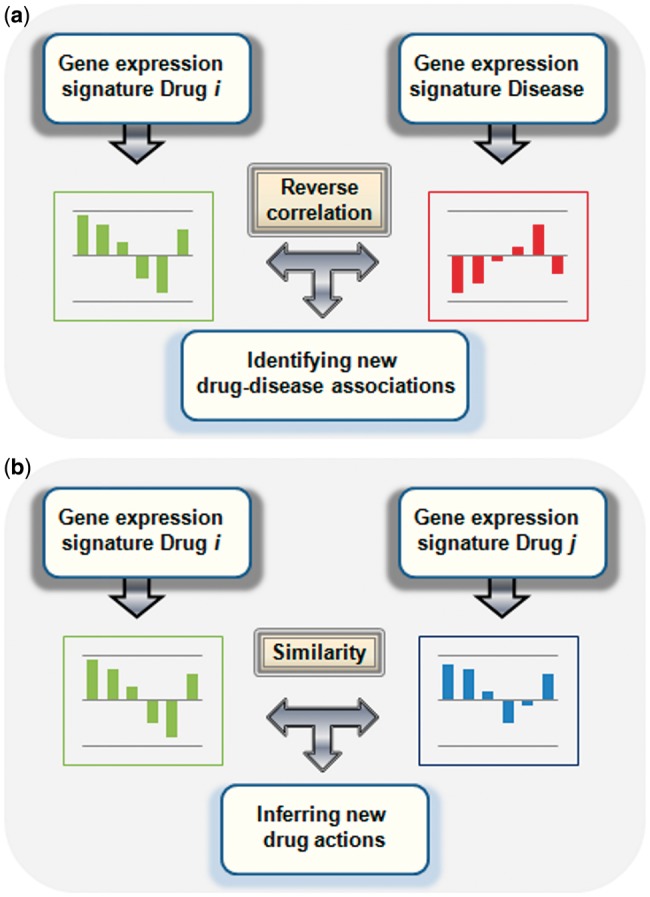
Two different research strategies using gene expression signatures: (A) reverse signature, in which the gene expression signature for a drug is compared with the gene expression signature for a disease looking for reverse correlations; (B) drug gene signature comparison, where pairs of drug signatures are compared and new drug–target/pathways are inferred. A colour version of this figure is available at BIB online: https://academic.oup.com/bib.
Already in 2000, Hughes et al. [65] constructed a compendium database of expression profiles in Saccharomyces cerevisiae from diverse mutations and chemical treatments. The compendium was useful to study gene functions and pharmacological perturbations. The authors identified a novel target for the oral anaesthetic dyclonine. They detected that the expression signature for dyclonine resembled profiles with perturbations in the ergosterol pathway and provided evidence that dyclonine inhibited the ERG2p, the sterol C-8 isomerase. In 2003, Gardner et al. [66] also used transcriptional perturbations to generate a regulatory network model with applications in the identification of molecular targets for compounds.
There are more examples of studies that reported novel possible applications for existing drugs. In many cases, the Connectivity Map (CMap) [67] had an important role in the discovery because it was used as a source of gene expression profiles for drugs. The CMap is freely available and currently is made out of a data set of >7000 genome-wide transcriptional expression profiles from human cells treated with small drug molecules (includes 1309 compounds). In the first version of the CMap, published in 2006 by Lamb et al. [67], the authors described the gene expression signatures of 164 Food and Drug Administration (FDA) approved drugs in five different cancer cell lines. The CMap is a valuable tool to study connections between diseases, genetic perturbations and mechanisms of action of drugs. As a proof of CMap’s utility, Wei et al. [68] identified rapamycin as a possible combinatory cancer therapy with glucocorticoids owing to its action reversing glucocorticoids resistance. The authors screened the CMap drug genetic expression signatures against expression signatures for glucocorticoid sensitivity and resistance in acute lymphoblastic leukemia. They also reported the modulation of MCL1 as a mechanism of action for rapamycin. Their approach has important implications in combinatory therapy in cancer treatment to help in drug resistance problems.
Similar strategies looking for reverse signatures between diseases and drugs were applied by Sirota, Dudley and coworkers [69]. They also used CMap, showing the potential of the database. They integrated and compared gene expression signatures from 100 diseases, extracted from Gene Expression Omnibus (GEO) [70], with signatures from 164 drugs in CMap. They looked at large scale for reverse signatures between diseases and drugs. Their approach yielded excellent results in drug repurposing discovering the antiulcer drug cimetidine as a potential candidate for lung adenocarcinoma and the anticonvulsant topiramate for inflammatory bowel disease [71].
A similar approach was published at the same time by Kunkel et al. [72]. Because conserved changes in muscle genetic expressions were detected in muscle atrophy [73], the authors hypothesized that chemical compounds with an opposite gene signature could have applications in the treatment of muscle atrophy. Their approach used mRNA expression signatures of skeletal muscle atrophy to query the CMap. The study showed anti-correlation between the disease muscle atrophy genetic signature and the genetic signature extracted for the natural compound ursolic acid. Their study showed potential for drug discovery because the compound inhibited fasting-induced muscle atrophy, induced muscle hypertrophy, improved muscle insulin-IGF-I signaling and reduced adiposity. This type of approach looking for inverse correlations between gene expression profiles of diseases and drugs showed also potential in the repurposing of drugs against breast cancer, myelogenous leukemia and prostate cancer [74].
Another strategy in the discovery of new applications for drugs consisted of guilt-by-association approaches that compare gene expression signatures between drugs to infer new actions to the drug candidate. In another successful study using CMap, Iorio et al. [75, 76] developed an approach that used drug similarity calculated through drug gene expression profiles to detect new targets and mechanisms of action for drugs. They constructed a network with 1302 nodes (representing drugs) connected through 41 047 edges (representing similarity in the transcriptional responses between two drugs). Highly interconnected nodes or drugs were enriched by compounds with a similar mechanism of action. Based on that, new targets or mechanisms of actions were inferred for some drug candidates. The authors reported for the first time that Fasudil, a Rho-kinase inhibitor, could have additional applications in neurodegenerative disorders as an enhancer of cellular autophagy [75].
There are more studies that use CMap and gene expression profiles with applications in biomedical discovery. Because our intention is to illustrate the importance of these types of databases and not to describe all the studies that have been published, we point out some reviews and perspectives with a more complete and detailed description of the different studies using CMap and its applications in drug repurposing, lead discovery, elucidation of mechanism of action, synergy of therapeutic combinations, mapping complex diseases and phenotypes and systems biology [77, 78]. Besides all the different studies validating the usefulness of CMap, assessments of the applicability of CMap-based methodologies is also available in the scientific literature [79–81].
Gene expression profiles from diseases and drugs can also be extracted from alternative transcriptional data sources, such as GEO microarrays data sets [82], a collection of samples from the same platform and comparable from the biological and statistical point of view. An example of characterization of disease–drug effects through transcriptomic profiles using GEO data is provided by Hu et al. [83]. The authors described a large-scale analysis using gene expression signatures to generate a disease–disease, drug–drug and disease–drug network with applications in the discovery of relationships between diseases, identification of adverse effects and detection of new indications for drugs. Their approach provides hypotheses about drug repurposing, such as drugs used in the treatment of neurological disorders, migraine or inflammation, which could be potentially useful in Huntington’s disease. The study provided more examples of applicability in target interaction discovery, such as the KCNMA1 potassium channel as a potential target for the alkaloid lobeline. Moreover, associations between drugs and adverse effects could also be made, such as tamoxifen and potentially undesired carcinogenic properties. More information about several resources of transcriptional data that support functional research for genes and their signatures, as well as detailed descriptions of gene signature methodologies for drug repurposing can be found in published reviews [84].
Besides applications in drug repurposing, genetic signatures have an important role in drug safety through the study of toxicological properties of drugs. Toxicogenomics studies the chemical-specific signatures of altered gene expression to classify toxic products based on the different signatures [85]. Gene expression profiles can be used as a test to detect and classify chemicals with potential toxicity for humans. Thomas et al. [86] developed a toxicological testing studying the changes in liver gene expression profiles caused by different chemical treatments. Investigations of gene expression profiles and histopathological alterations in liver after administration of the drug methapyrilene provided insights into the role of some genes in hepatotoxicity [87]. In a similar way, Amin et al. [88] analyzed the changes in gene expression profiles after the administration of some drugs with known renal toxicity. Their analysis also provided insights about mechanism of action of the compounds in nephrotoxicity. Genetic signatures can be seen as biomarkers to predict toxicity after the drug administration. Fielden et al. [89] generated a signature of 35 genes to predict drug-induced renal toxicity. The signature was derived from kidney gene expression profiles in rats treated with renal toxic and non-toxic compounds. The genetic signature was extracted through three steps including data reduction, signature generation through a sparse linear programming algorithm to differentiate presence and absence of future renal tubular toxicity and cross-validation. The study showed promising results of genetic signatures as biomarkers in adverse effect prediction that could help traditional methodologies, such as histopathology or clinical chemistry.
Gene expression profiles are also useful tools to monitor the adverse effects associated with some therapies, such as treatments for Duchenne muscular dystrophy [90]. Gene signatures have great potential in the identification of off-targets and have substantially contributed to the knowledge of molecular mechanisms of adverse drug reactions [91]. The large number of different biological processes that are analyzed can help in preclinical and clinical research and detect in an early stage potential adverse reactions. Microarray expression profiles can also be useful in preclinical phases in the selection of compounds with more opportunities of clinical success. In fact, the regulatory authorities, such as the US FDA [120] have shown interest in the regulation of genomic data by pharmaceutical companies to help in the process of decision making. It is not our intention to describe more studies in detail because there are excellent reviews in the literature describing associations between off-targets, adverse reactions and genes, such as associations between liver and skin reactions and human leukocyte antigen genes [92–94].
As we have shown above, gene expression profiles have great applications in drug repurposing and adverse effect detection providing insights about pathways and molecular mechanism of action. Moreover, approaches such as gene expression-based high-throughput screening showed potential for chemical screening in drug discovery processes [95]. Gene expression signatures have also an important role in precision medicine providing the tool necessary to analyze the more convenient drugs for an individual [96, 97]. In fact, genomic analyses have already reached great importance in therapy optimization, efficacy and drug response in diseases such as cancer [98–101]. As we described before, the analysis of reverse correlations between drugs and diseases have applications in drug repurposing; in addition, correlations between drugs and disease signatures could also provide insights about possible medications contraindicated for a particular disease. Another possible utility of this type of study is the analysis and detection of DDIs. The importance of genetic data on DDIs has been previously discussed [102, 103]. Incorporating patients’ genetic information into adverse drug interaction data would improve personalized DDI outcomes.
Phenome profiles
Adverse drug effect profiles
Adverse effects have been used as a source of pharmacological information to develop drug profiles and compare similarity between chemicals. The idea behind these methods is that drugs that share a significant number of adverse reactions should have similar mechanisms of action with the consequent predictability in drug–target, drug–off-target and DDIs. In this sense, current approaches rely on data that are based on drugs that reached the pharmaceutical market. These approaches would substantially benefit, however, from the extensive clinical side effect data generated for experimental drugs by the pharmaceutical sector in preclinical and clinical steps [104]. As an application of these biological profiles, there are different studies whose objective is the prediction of new targets for drugs. Campillos et al. [105] used a phenotypic adverse effects profile approach to infer new drug–target associations. They used a classification of side effects based on the Unified Medical Language System [121] and mined drug package inserts to extract sets of adverse effects for each drug. A weighted function was used to measure similarity between adverse effect profiles. They observed a correlation between side-effect similarity and the likelihood of sharing a target. A test with 20 drug–target associations was carried out and 13 of them were validated through invitro binding assays, showing promising results for the use of adverse effect profiles in drug discovery. Yang et al. [106] also showed that clinical adverse drug effect profiles extracted from SIDER [122] could suggest novel indications for drugs in the market. They extracted 3175 relationships between side effects and diseases and provided repositioning hypothesis. An approach inferring potential drug indications was also described by Gottlieb et al. [107]. The authors developed their method using different similarity measures, among them drug side effect similarity extracted from SIDER. Another source of adverse reactions, such as FAERS, the US FDA’s Adverse Event Reporting System [50] was used by Takarabe et al. [108] to define adverse drug effect similarity. In this study the drugs are represented using two different adverse effect profiles, based on binary profiles in which the adverse events are coded 1 or 0 indicating presence or absence of the adverse effects, and based on frequency in which the side effect vector position codifies the frequency of the adverse events in the reports. Alternative data sources of adverse effects were also used in the study, such as SIDER [122] or JAPIC [123], the Japan Pharmaceutical Information Center database. There are also some Web servers, such as DINIES [124, 109], to predict drug–target interactions using chemical features but also additional biological information such as side-effect profiles. The prediction in the system is based on the use of machine learning methods assuming that similar compounds (calculated with different similarity profiles) interact with similar proteins.
Adverse effect signatures have also shown great potential in clinical and postmarketing phases through the detection of adverse reactions and DDIs [110]. As it was commented in previous sections, Liu et al. [43] developed a machine learning approach for large-scale prediction of adverse reactions caused by drugs using similarity signatures, among them adverse effects signatures extracted from SIDER [122]. Our research group has also used adverse drug effects profiles to generate predictive models with implications in the detection of adverse reactions and DDIs [44, 47, 48]. The potential of phenotypic profiles in the prediction of DDIs was also demonstrated in more recent studies [111].
Clinical and disease signatures
Electronic Health Records (EHRs) are widely investigated to look for associations between drugs and adverse effects and constitute an important source for pharmacovigilance. These data also offer a great opportunity as an extensive source of drug signatures. EHRs contain medical data regarding laboratory testing. Information from laboratory tests can be implemented as laboratory fingerprints and hence drugs can be compared based on the similarity displayed in the different tests. The associated similarity between drugs is useful to infer new drug actions with implications in drug repurposing and adverse effect detection. As an example, Paik et al. [112] developed a method that integrated laboratory test signatures from >530 000 patients with genomic profiles from public sources to discover new drug applications. The study suggested that the anti-asthma drug terbutaline sulfate can be a promising candidate for the treatment of amyotrophic lateral sclerosis.
Knowledge of the diseases treated by drugs can also be exploited to generate predictive systems in drug repurposing. For instance, drugs can be represented as fingerprints of the different diseases they treat. Alternatively, a disease signature can also be generated, composed of the different drugs used to treat the disease. Following this concept, Chiang et al. [113] used FDA-approved indications and off-label uses to generate disease signatures. Signatures were compared and the non-intersecting drugs in the disease pair were considered new putative drug–disease candidates. The authors developed a guilt-by-association network model with 5549 disease pairs to generate a set of 57 542 candidates for repurposing. An alternative idea to be exploited is based on the analysis of the shared molecular mechanisms between two different pathologies. Comparison of the diseases at molecular level can also offer opportunities in drug repurposing. Although these techniques have applicability in drug-related predictions, we do not consider them as drug signatures and additional related information is available in a previous review published by Dudley et al. [64].
A complementary framework was used by Jang et al. [114] in which clinical disease signatures and clinical drug effect vectors were combined. The clinical disease signatures were derived from electronic health information extracted from the National Health and Nutrition Examination Survey. The disease signature consisted of clinical variables with significant alterations (up or down) between disease and healthy controls determined by statistical analysis (Wilcoxon rank sum test). The drug effect signatures were calculated from the scientific literature by Fisher’s exact test and supervised machine learning. They also contained clinical variables modified by the effect of drugs, i.e. they can be up, down, non-related and associated (this is the case when drug and clinical variable are associated but no information about directionality is available). The method calculated a repositioning score for each drug–disease candidate based on both anti-correlation and association of clinical states of disease signatures and clinical effects of drugs. Examples of possible drug repurposing candidates for further study are glutathione and edetic acid as treatments for asthma. The authors showed the potential of their approach in the discovery of new drug therapeutic effects based on complementary relations between disease and clinical drug effect signatures.
Semantic analysis as a source of drug profiles
Drug biological profiles are generated in many occasions from knowledge data sources available for the scientific community (see Table 1 with the summary of some data sources). However, text mining and semantic analysis performed in the Web and in the scientific literature can provide also a valuable source for the generation of the different biological profiles. There are different studies that established drug biological profiles for similarity comparison that are based on semantic extraction of the knowledge from the texts and data sources. The generation of ontologies helps in the extraction and analysis of the information providing a vocabulary and a tool to link relationships between terms in the biomedical domain. Moreover, ontologies provide a standard framework to unify concepts from different domains of knowledge and with diverse formats.
Choi et al. [125] used Semantic Web technologies and generated a Small Molecule Ontology (SMO) to represent concepts and relationships. The elements of their ontology described small molecules, proteins, pathways and genes. SMO is a repository of relevant terms for small molecules and protein interaction data that facilitates reasoning across drugs and their targets. Gene Ontology was useful to compute gene semantic similarity between proteins by Tan et al. [126]. The authors generated ‘theoretical expression profiles’ by integrating 3D chemical structure similarity and gene semantic similarity. Those expression profiles were compared to measure drug-drug similarity and infer new properties in a repurposing strategy. Another case of application of the knowledge from data sources and ontologies in drug–target prediction is provided by Palma et al. [127]. They presented a method that combines semantic similarities from ontologies or semantic spaces with an edge partitioning approach that includes drug–target interaction edges, and drug–drug and target–target similarity edges. An example of semantic similarity between drugs described in the study is calculated through the shared annotations of disease concepts (representing drugs as profiles of disease terms). Through the combination of shared annotation and ontological relatedness, i.e. identical terms and related terms, the authors developed a community of related disease concepts. Chen et al. [128] used semantic methodologies to generate a network with drug–target interaction data. They developed a Semantic Link Association Prediction model to evaluate and predict drug–target pairs associations. The scores associating drugs against set of targets are biological signatures to measure drug similarities within the network system. Their method has potential in the discovery of new applications for drugs. Semantic similarity calculated with phenotype ontologies has also demonstrated to be useful to analyze druggable therapeutic targets, pathways, gene functions and drug effect profiles [129]. The authors developed PhenomeNET 2 [130], a Web server to evaluate similarity between organisms, diseases and drug effect profiles using phenotype annotations.
Drug–drug similarity calculated with ontology measures is useful to automate the analysis. However, drug ontologies may contain some irrelevant terms for a particular problem and hence lead to inaccurate drug similarities. For this reason, Lee et al. [131] described a pruning approach for drug ontologies to eliminate irrelevant terms or concepts that confound the important semantic terms of a certain domain. There are in the scientific literature different reviews that show the applicability of text mining, semantic approaches and ontologies in the extraction, integration and generation of biomedical information [132–135].
Challenges in drug biological profiles
Drug signatures have showed great applicability in drug discovery, development and drug safety. Although large and complex biological data are available nowadays, and more is expected in the next future, showing great potential as extensive sources to generate drug signatures, the use of these computational approaches is not exempt of important challenges. A primary limitation of drug signatures resides on the quality and accuracy of the data introduced in the signature. Drug signatures extracted from some knowledge data, such as established sources of targets and adverse effects, could be partially biased [47]. Knowledge target databases are influenced by the tendency of evaluating drugs in the same pharmacological class for the same targets. Moreover, target fingerprints could also be weighted with a significant number of similar targets belonging to the same protein family that could provide redundant information for drug comparison. Another limitation in the applicability of some profiles could reside in the inconsistency between the obtained results and clinical therapeutic actions. The prediction of molecular responses, such as possible drug–target associations, may not correspond well with phenotypic actions. On the other hand, drug signatures calculated with adverse effects extracted from valuable knowledge data sources such as SIDER could be affected by reporting biases owing to the fact that some adverse effects are extracted from package inserts [136] that could include all the drugs in a particular pharmacological category. In some cases, however, the adverse reactions are not totally confirmed for some drugs in the class and some false positives could be included [136, 137]. Moreover, the calculation of knowledge-based signatures is not applicable in some cases, such as postmarketing adverse event signatures in recent approved drugs with limited adverse effect information in the current pharmaceutical market.
Although the analysis of gene expression signatures is a promising technique, it is not free of limitations, such as the selection of genes that compose the signature or the multiple expression signatures obtained by treating different cell lines with the same drug [84]. Limitations to derive drug signatures can arise from drug single testing concentrations [77]. A different response could be observed in some cases and hence a different genetic drug profile. Besides these limitations, implementation of drug genetic profiles extracted from different drugs, types of cells and under different conditions is a challenging process. Incorrect integration of gene expression profiles could provide a misguided representation of the biological states [84]. Improvements in signature matching methodologies would be useful in data implementation. Moreover, the gap between molecular responses and phenotypic actions is also applicable in the case of gene expression signatures. Drug responses in isolated cell lines might not reflect the behavior of a drug in a more complete biological system [64]. Complex diseases that alter multiple biological processes in different organ systems might not be efficiently represented and analyzed by drug transcriptome responses in a single cell signature. Moreover, drug therapeutic effects in some cases could be associated to metabolic drug products that are not taken into account using genetic approaches in cells [64]. Besides the great effort applied in the development of CMap and alternative publicly available transcriptional sources, more gene expression data extracted for more molecules, approved and experimental drugs, would be necessary to expand this type of studies toward a more complete representation of the pharmacological space.
Despite the different challenges and limitations presented by the nature of the features codified in the drug profile or signature and by the method used to integrate similarity and infer new targets, pathways, adverse effects and DDIs, the analysis of drug profiles has shown significant applications in drug discovery, development and safety. The concept of drug profile similarity is exploited in most of the studies as a successful tool to associate or infer new properties for drugs. However, it is not clear that the performance and efficiency achieved by one of the drug profiles really surpasses performance yielded by the others. Integrative models combining different similarity profiles could be an option to improve prediction. As it was shown previously [47, 48], different drug profile information was implemented in the development of integrative models through Principal Component Analysis and Linear Discriminant Analysis. It is worth noting that comparison of different drug profiles showed some similar patterns, although low correlations were obtained in some cases [48]. They showed the ability of codifying related biological information but at the same time different and complementary data. For this reason, combination of different drug profiles in integrative models could be an alternative in the prediction of drug properties. However, regardless of the success of some computational approaches, new candidates extracted from this type of studies are novel hypothesis that need further confirmation through experimental assays developed in cells, animals or humans or through complementary surveillance studies that provide more scientific evidences.
Conclusion
Availability of big biological data sources combined with the advances in development of integrative methods for data analysis provides a great opportunity in the generation of drug biological profiles that can be used in the modeling of drugs, targets, pathways and adverse effects. Biological drug profiles can be compared easily through similarity algorithms, such as the TC, and predictive models that infer new biological actions to the candidates can be generated from the comparative analysis. In the current review, we focus on drug-related profiles, such as target profiles, gene expression signatures, adverse drug effects and drug–disease profiles, and their applicability on the explanation of important biological phenomena for existing drugs. Results showed that computational approaches using drug biological profiles can be used with great success to infer novel actions for drugs. We provide a significant number of examples of applicability of drug profiles in drug repurposing, adverse drug effect prediction and DDI analysis. The three applications presented in the current review have the potential to improve patient health and reduce costs associated with drug development and safety.
Key Points
Examples of drug biological profiles contain information about target interactions, gene expression measurements, adverse effects and/or diseases.
Similarity in drug biological profiles can be compared to predict and analyze drugs’ actions.
Drug biological profiles have applications in drug repurposing, detection of adverse reactions and prediction of drug–drug interactions.
Funding
This study was supported by grants R01 LM006910 (to G.H.) ‘Discovering and Applying Knowledge in Clinical Databases’ from the National Library of Medicine.
Biographies
Santiago Vilar is an Associate Research Scientist at the Department of Biomedical Informatics at Columbia University Medical Center (New York). He is interested in drug design and repurposing, molecular modeling and cheminformatics.
George Hripcsak is the Chair of the Department of Biomedical Informatics at Columbia University Medical Center (New York). He is interested in clinical information stored in electronic health records and in the development of next-generation health record systems.
References
- 1. Maggiora G, Vogt M, Stumpfe D, et al. Molecular similarity in medicinal chemistry. J Med Chem 2014;57:3186–204. [DOI] [PubMed] [Google Scholar]
- 2. Bender A, Glen RC.. Molecular similarity: a key technique in molecular informatics. Org Biomol Chem 2004;2:3204–18. [DOI] [PubMed] [Google Scholar]
- 3. Iskar M, Zeller G, Zhao X-M, et al. Drug discovery in the age of systems biology: the rise of computational approaches for data integration. Curr Opin Biotechnol 2012;23:609–16. [DOI] [PubMed] [Google Scholar]
- 4. Durant JL, Leland BA, Henry DR, et al. Reoptimization of MDL keys for use in drug discovery. J Chem Inf Comput Sci 2002;42:1273–80. [DOI] [PubMed] [Google Scholar]
- 5. Wang Y, Zeng J.. Predicting drug-target interactions using restricted Boltzmann machines. Bioinformatics 2013;29:i126–34. [DOI] [PMC free article] [PubMed] [Google Scholar]
- 6. Ding H, Takigawa I, Mamitsuka H, et al. Similarity-based machine learning methods for predicting drug-target interactions: a brief review. Brief Bioinform 2014;15:734–47. [DOI] [PubMed] [Google Scholar]
- 7. Kola I, Landis J.. Can the pharmaceutical industry reduce attrition rates? Nat Rev Drug Discov 2004;3:711–5. [DOI] [PubMed] [Google Scholar]
- 8. Adams CP, Brantner VV.. Estimating the cost of new drug development: is it really $802 million? Health Aff 2006;25:420–8. [DOI] [PubMed] [Google Scholar]
- 9. Chong CR, Sullivan DJ Jr.. New uses for old drugs. Nature 2007;448:645–6. [DOI] [PubMed] [Google Scholar]
- 10. Brewer T, Colditz GA.. Postmarketing surveillance and adverse drug reactions - current perspectives and future needs. JAMA 1999;281:824–9. [DOI] [PubMed] [Google Scholar]
- 11. Klein E, Bourdette D.. Postmarketing adverse drug reactions: a duty to report? Neurol Clin Pract 2013;3:288–94. [DOI] [PMC free article] [PubMed] [Google Scholar]
- 12. Schneeweiss S, Hasford J, Gottler M, et al. Admissions caused by adverse drug events to internal medicine and emergency departments in hospitals: a longitudinal population-based study. Eur J Clin Pharmacol 2002;58:285–91. [DOI] [PubMed] [Google Scholar]
- 13. Gautier S, Bachelet H, Bordet R, et al. The cost of adverse drug reactions. Expert Opin Pharmacother 2003;4:319–26. [DOI] [PubMed] [Google Scholar]
- 14. Harpaz R, DuMouchel W, Shah NH, et al. Novel data-mining methodologies for adverse drug event discovery and analysis. Clin Pharmacol Ther 2012;91:1010–21. [DOI] [PMC free article] [PubMed] [Google Scholar]
- 15. Klein DF, O'Brien CP.. Improving detection of adverse effects of marketed drugs. JAMA 2007;298:333–4. [DOI] [PubMed] [Google Scholar]
- 16. Becker ML, Kallewaard M, Caspers PWJ, et al. Hospitalisations and emergency department visits due to drug-drug interactions: a literature review. Pharmacoepidemiol Drug Saf 2007;16:641–51. [DOI] [PubMed] [Google Scholar]
- 17. Percha B, Altman RB.. Informatics confronts drug-drug interactions. Trends Pharmacol Sci 2013;34:178–84. [DOI] [PMC free article] [PubMed] [Google Scholar]
- 18. Heikamp K, Bajorath J.. Fingerprint design and engineering strategies: rationalizing and improving similarity search performance. Future Med Chem 2012;4:1945–59. [DOI] [PubMed] [Google Scholar]
- 19. Geppert H, Bajorath J.. Advances in 2D fingerprint similarity searching. Expert Opin Drug Discov 2010;5:529–42. [DOI] [PubMed] [Google Scholar]
- 20. Gardiner EJ, Holliday JD, O'Dowd C, et al. Effectiveness of 2D fingerprints for scaffold hopping. Future Med Chem 2011;3: 405–14. [DOI] [PubMed] [Google Scholar]
- 21. Keiser MJ, Roth BL, Armbruster BN, et al. Relating protein pharmacology by ligand chemistry. Nat Biotechnol 2007;25:197–206. [DOI] [PubMed] [Google Scholar]
- 22. Vilar S, Harpaz R, Uriarte E, et al. Drug-drug interaction through molecular structure similarity analysis. J Am Med Inform Assoc 2012;19:1066–74. [DOI] [PMC free article] [PubMed] [Google Scholar]
- 23. Scheiber J, Jenkins JL, Sukuru SCK, et al. Mapping adverse drug reactions in chemical space. J Med Chem 2009;52:3103–7. [DOI] [PubMed] [Google Scholar]
- 24. Pauwels E, Stoven V, Yamanishi Y.. Predicting drug side-effect profiles: a chemical fragment-based approach. BMC Bioinformatics 2011;12:169.. [DOI] [PMC free article] [PubMed] [Google Scholar]
- 25. Bender A, Scheiber J, Glick M, et al. Analysis of pharmacology data and the prediction of adverse drug reactions and off-target effects from chemical structure. Chem Med Chem 2007;2:861–73. [DOI] [PubMed] [Google Scholar]
- 26. Lounkine E, Keiser MJ, Whitebread S, et al. Large-scale prediction and testing of drug activity on side-effect targets. Nature 2012;486:361–7. [DOI] [PMC free article] [PubMed] [Google Scholar]
- 27. Cereto-Massague A, Jose Ojeda M, Valls C, et al. Molecular fingerprint similarity search in virtual screening. Methods 2015;71:58–63. [DOI] [PubMed] [Google Scholar]
- 28. Muegge I, Mukherjee P.. An overview of molecular fingerprint similarity search in virtual screening. Expert Opin Drug Discov 2016;11:137–48. [DOI] [PubMed] [Google Scholar]
- 29. Willett P. Similarity searching using 2D structural fingerprints. Methods Mol Biol 2011;672:133–58. [DOI] [PubMed] [Google Scholar]
- 30. Chupakhin V, Marcou G, Baskin I, et al. Predicting ligand binding modes from neural networks trained on protein-ligand interaction fingerprints. J Chem Inf Model 2013;53: 763–72. [DOI] [PubMed] [Google Scholar]
- 31. Da C, Kireev D.. Structural Protein-Ligand Interaction Fingerprints (SPLIF) for structure-based virtual screening: method and benchmark study. J Chem Inf Model 2014;54:2555–61. [DOI] [PMC free article] [PubMed] [Google Scholar]
- 32. Deng Z, Chuaqui C, Singh J.. Structural interaction fingerprint (SIFt): a novel method for analyzing three-dimensional protein-ligand binding interactions. J Med Chem 2004;47: 337–44. [DOI] [PubMed] [Google Scholar]
- 33. Perez-Nueno VI, Rabal O, Borrell JI, et al. APIF: a new interaction fingerprint based on atom pairs and its application to virtual screening. J Chem Inf Model 2009;49:1245–60. [DOI] [PubMed] [Google Scholar]
- 34. Marcou G, Rognan D.. Optimizing fragment and scaffold docking by use of molecular interaction fingerprints. J Chem Inf Model 2007;47:195–207. [DOI] [PubMed] [Google Scholar]
- 35. Desaphy J, Raimbaud E, Ducrot P, et al. Encoding protein-ligand interaction patterns in fingerprints and graphs. J Chem Inf Model 2013;53:623–37. [DOI] [PubMed] [Google Scholar]
- 36. Cao R, Wang Y.. In silico study of polypharmacology with protein-ligand interacting fingerprint. Receptors Clin Investig 2015;2:e976. [Google Scholar]
- 37. Salentin S, Haupt VJ, Daminelli S, et al. Polypharmacology rescored: protein-ligand interaction profiles for remote binding site similarity assessment. Prog Biophys Mol Biol 2014;116:174–86. [DOI] [PubMed] [Google Scholar]
- 38. Brewerton SC. The use of protein-ligand interaction fingerprints in docking. Curr Opin Drug Discov Devel 2008;11:356–64. [PubMed] [Google Scholar]
- 39. Napolitano F, Zhao Y, Moreira VM, et al. Drug repositioning: a machine-learning approach through data integration. J Cheminform 2013;5:30.. [DOI] [PMC free article] [PubMed] [Google Scholar]
- 40. Drug Bank database. http://www.drugbank.ca/ (1 February 2016, date last accessed).
- 41. Fliri AF, Loging WT, Thadeio PF, et al. Biological spectra analysis: linking biological activity profiles to molecular structure. Proc Natl Acad Sci USA 2005;102:261–6. [DOI] [PMC free article] [PubMed] [Google Scholar]
- 42. Fliri AF, Loging WT, Thadeio PF, et al. Analysis of drug-induced effect patterns to link structure and side effects of medicines. Nat Chem Biol 2005;1:389–97. [DOI] [PubMed] [Google Scholar]
- 43. Liu M, Wu Y, Chen Y, et al. Large-scale prediction of adverse drug reactions using chemical, biological, and phenotypic properties of drugs. J Am Med Inform Assoc 2012;19: E28–35. [DOI] [PMC free article] [PubMed] [Google Scholar]
- 44. Vilar S, Ryan PB, Madigan D, et al. Similarity-based modeling applied to signal detection in pharmacovigilance. CPT Pharmacometrics Syst Pharmacol 2014;3:e137.. [DOI] [PMC free article] [PubMed] [Google Scholar]
- 45. Pouliot Y, Chiang AP, Butte AJ.. Predicting adverse drug reactions using publicly available pubchem bioassay data. Clin Pharmacol Ther 2011;90:90–9. [DOI] [PMC free article] [PubMed] [Google Scholar]
- 46. Cheng F, Zhao Z.. Machine learning-based prediction of drug-drug interactions by integrating drug phenotypic, therapeutic, chemical, and genomic properties. J Am Med Inform Assoc 2014;21:E278–86. [DOI] [PMC free article] [PubMed] [Google Scholar]
- 47. Vilar S, Uriarte E, Santana L, et al. Similarity-based modeling in large-scale prediction of drug-drug interactions. Nat Protoc 2014;9:2147–63. [DOI] [PMC free article] [PubMed] [Google Scholar]
- 48. Vilar S, Lorberbaum T, Hripcsak G, et al. Improving detection of arrhythmia drug-drug interactions in pharmacovigilance data through the implementation of similarity-based modeling. Plos One 2015;10:e0129974.. [DOI] [PMC free article] [PubMed] [Google Scholar]
- 49. Tatonetti NP, Ye PP, Daneshjou R, et al. Data-driven prediction of drug effects and interactions. Sci Trans Med 2012;4:125ra31.. [DOI] [PMC free article] [PubMed] [Google Scholar]
- 50. FDA Adverse Event Reporting System (FAERS). FDA U.S. Food and Drug Administration. http://www.fda.gov/cder/aers/default.htm (15 January 2016, date last accessed).
- 51. ChEMBL - European Bioinformatics Institute. https://www.ebi.ac.uk/chembl/(15 January 2016, date last accessed).
- 52. The PubChem Project. http://pubchem.ncbi.nlm.nih.gov/ (15 January 2016, date last accessed).
- 53. STITCH: Chemical-Protein Interactions. http://stitch.embl.de/ (15 March 2016, date last accessed).
- 54. SuperTarget. http://bioinf-apache.charite.de/supertarget_v2/ (15 March 2016, date last accessed).
- 55. Therapeutic Target Database (TTD). http://bidd.nus.edu.sg/group/cjttd/ (15 March 2016, date last accessed).
- 56. BindingDB. The Binding Database. https://www.bindingdb.org/bind/index.jsp (15 March 2016, date last accessed).
- 57. PharmGKB. The Pharmacogenomics Knowledgebase. https://www.pharmgkb.org/ (15 March 2016, date last accessed).
- 58. Cheng F, Li W, Wu Z, et al. Prediction of polypharmacological profiles of drugs by the integration of chemical, side effect, and therapeutic space. J Chem Inf Model 2013;53:753–62. [DOI] [PubMed] [Google Scholar]
- 59. Wang WZ, Guo X, Duan C, et al. Comparative analysis of gene expression profiles between the normal human cartilage and the one with endemic osteoarthritis. Osteoarthritis Cartilage 2009;17:83–90. [DOI] [PubMed] [Google Scholar]
- 60. Milano A, Pendergrass SA, Sargent JL, et al. Molecular subsets in the gene expression signatures of scleroderma skin. Plos One 2008;3:e2696.. [DOI] [PMC free article] [PubMed] [Google Scholar]
- 61. Gray NS, Wodicka L, Thunnissen A, et al. Exploiting chemical libraries, structure, and genomics in the search for kinase inhibitors. Science 1998;281:533–8. [DOI] [PubMed] [Google Scholar]
- 62. Kohanski MA, Dwyer DJ, Wierzbowski J, et al. Mistranslation of membrane proteins and two-component system activation trigger antibiotic-mediated cell death. Cell 2008;135: 679–90. [DOI] [PMC free article] [PubMed] [Google Scholar]
- 63. Hieronymus H, Lamb J, Ross KN, et al. Gene expression signature-based chemical genomic prediction identifies a novel class of HSP90 pathway modulators. Cancer Cell 2006;10:321–30. [DOI] [PubMed] [Google Scholar]
- 64. Dudley JT, Deshpande T, Butte AJ.. Exploiting drug-disease relationships for computational drug repositioning. Brief Bioinform 2011;12:303–11. [DOI] [PMC free article] [PubMed] [Google Scholar]
- 65. Hughes TR, Marton MJ, Jones AR, et al. Functional discovery via a compendium of expression profiles. Cell 2000;102: 109–26. [DOI] [PubMed] [Google Scholar]
- 66. Gardner TS, di Bernardo D, Lorenz D, et al. Inferring genetic networks and identifying compound mode of action via expression profiling. Science 2003;301:102–5. [DOI] [PubMed] [Google Scholar]
- 67. Lamb J, Crawford ED, Peck D, et al. The connectivity map: using gene-expression signatures to connect small molecules, genes, and disease. Science 2006;313:1929–35. [DOI] [PubMed] [Google Scholar]
- 68. Wei G, Twomey D, Lamb J, et al. Gene expression-based chemical genomics identifies rapamycin as a modulator of MCL1 and glucocorticoid resistance. Cancer Cell 2006;10: 331–42. [DOI] [PubMed] [Google Scholar]
- 69. Sirota M, Dudley JT, Kim J, et al. Discovery and preclinical validation of drug indications using compendia of public gene expression data. Sci Trans Med 2011;3:96ra77.. [DOI] [PMC free article] [PubMed] [Google Scholar]
- 70. Barrett T, Edgar R.. Gene expression omnibus: microarray data storage, submission, retrieval, and analysis. Methods Enzymol 2006;411:352–69. [DOI] [PMC free article] [PubMed] [Google Scholar]
- 71. Dudley JT, Sirota M, Shenoy M, et al. Computational repositioning of the anticonvulsant topiramate for inflammatory bowel disease. Sci Trans Med 2011;3:96ra76.. [DOI] [PMC free article] [PubMed] [Google Scholar]
- 72. Kunkel SD, Suneja M, Ebert SM, et al. mRNA expression signatures of human skeletal muscle atrophy identify a natural compound that increases muscle mass. Cell Metab 2011;13: 627–38. [DOI] [PMC free article] [PubMed] [Google Scholar]
- 73. Bodine SC, Latres E, Baumhueter S, et al. Identification of ubiquitin ligases required for skeletal muscle atrophy. Science 2001;294:1704–8. [DOI] [PubMed] [Google Scholar]
- 74. Shigemizu D, Hu Z, Hung J-H, et al. Using functional signatures to identify repositioned drugs for breast, myelogenous leukemia and prostate cancer. Plos Comput Biol 2012;8: e1002347.. [DOI] [PMC free article] [PubMed] [Google Scholar]
- 75. Iorio F, Bosotti R, Scacheri E, et al. Discovery of drug mode of action and drug repositioning from transcriptional responses. Proc Natl Acad Sci USA 2010;107:14621–6. [DOI] [PMC free article] [PubMed] [Google Scholar]
- 76. Iorio F, Tagliaferri R, Di Bernardo D.. Identifying network of drug mode of action by gene expression profiling. J Comput Biol 2009;16:241–51. [DOI] [PubMed] [Google Scholar]
- 77. Qu XA, Rajpal DK.. Applications of Connectivity Map in drug discovery and development. Drug Discov Today 2012;17: 1289–98. [DOI] [PubMed] [Google Scholar]
- 78. Lamb J. The Connectivity Map: a new tool for biomedical research. Nat Rev Cancer 2007;7:54–60. [DOI] [PubMed] [Google Scholar]
- 79. Cheng J, Yang L, Kumar V, et al. Systematic evaluation of connectivity map for disease indications. Genome Med 2014;6:540.. [DOI] [PMC free article] [PubMed] [Google Scholar]
- 80. Iskar M, Campillos M, Kuhn M, et al. Drug-induced regulation of target expression. Plos Comput Biol 2010;6:e1000925.. [DOI] [PMC free article] [PubMed] [Google Scholar]
- 81. Cheng J, Xie Q, Kumar V, et al. Evaluation of analytical methods for connectivity map data. Pac Symp Biocomput 2013;18:5–16. [PubMed] [Google Scholar]
- 82. Barrett T, Troup DB, Wilhite SE, et al. NCBI GEO: mining tens of millions of expression profiles - database and tools update. Nucleic Acids Res 2007;35:D760–5. [DOI] [PMC free article] [PubMed] [Google Scholar]
- 83. Hu G, Agarwal P.. Human disease-drug network based on genomic expression profiles. Plos One 2009;4:e6536.. [DOI] [PMC free article] [PubMed] [Google Scholar]
- 84. Iorio F, Rittman T, Ge H, et al. Transcriptional data: a new gateway to drug repositioning? Drug Discov Today 2013;18:350–7. [DOI] [PMC free article] [PubMed] [Google Scholar]
- 85. Hamadeh HK, Bushel PR, Jayadev S, et al. Gene expression analysis reveals chemical-specific profiles. Toxicol Sci 2002;67:219–31. [DOI] [PubMed] [Google Scholar]
- 86. Thomas RS, Rank DR, Penn SG, et al. Identification of toxicologically predictive gene sets using cDNA microarrays. Mol Pharmacol 2001;60:1189–94. [DOI] [PubMed] [Google Scholar]
- 87. Hamadeh HK, Knight BL, Haugen AC, et al. Methapyrilene toxicity: anchorage of pathologic observations to gene expression alterations. Toxicol Pathol 2002;30:470–82. [DOI] [PubMed] [Google Scholar]
- 88. Amin RA, Vickers AE, Sistare F, et al. Identification of putative gene-based markers of renal toxicity. Environ Health Perspect 2004;112:465–79. [DOI] [PMC free article] [PubMed] [Google Scholar]
- 89. Fielden MR, Eynon BP, Natsoulis G, et al. A gene expression signature that predicts the future onset of drug-induced renal tubular toxicity. Toxicol Pathol 2005;33:675–83. [DOI] [PubMed] [Google Scholar]
- 90. t' Hoen PAC, van der Wees CGC, Aartsma-Rus A, et al. Gene expression profiling to monitor therapeutic and adverse effects of antisense therapies for Duchenne muscular dystrophy. Pharmacogenomics 2006;7:281–97. [DOI] [PubMed] [Google Scholar]
- 91. Ganter B, Tugendreich S, Pearson CI, et al. Development of a large-scale chemogenomics database to improve drug candidate selection and to understand mechanisms of chemical toxicity and action. J Biotechnol 2005;119:219–44. [DOI] [PubMed] [Google Scholar]
- 92. Daly AK. Pharmacogenomics of adverse drug reactions. Genome Med 2013;5:5.. [DOI] [PMC free article] [PubMed] [Google Scholar]
- 93. Roden DM, George AL.. The genetic basis of variability in drug responses. Nat Rev Drug Discov 2002;1:37–44. [DOI] [PubMed] [Google Scholar]
- 94. Ma Q, Lu AYH.. Pharmacogenetics, pharmacogenomics, and individualized medicine. Pharmacol Rev 2011;63:437–59. [DOI] [PubMed] [Google Scholar]
- 95. Stegmaier K, Ross KN, Colavito SA, et al. Gene expression-based high-throughput screening (GE-HTS) and application to leukemia differentiation. Nat Genet 2004;36:257–63. [DOI] [PubMed] [Google Scholar]
- 96. Wei C-Y, Lee M-TM, Chen Y-T.. Pharmacogenomics of adverse drug reactions: implementing personalized medicine. Hum Mol Genet 2012;21:R58–65. [DOI] [PubMed] [Google Scholar]
- 97. Pirmohamed M. Personalized Pharmacogenomics: predicting efficacy and adverse drug reactions. Annu Rev Genomics Hum Genet 2014;15:349–70. [DOI] [PubMed] [Google Scholar]
- 98. Skipper M. Cancer genomics: indicators for drug response from sequencing. Nat Rev Genet 2012;13:520.. [DOI] [PubMed] [Google Scholar]
- 99. Robert J, Vekris A, Pourquier P, et al. Predicting drug response based on gene expression. Crit Rev Oncol Hematol 2004;51: 205–27. [DOI] [PubMed] [Google Scholar]
- 100. Holleman A, Cheok MH, den Boer ML, et al. Gene-expression patterns in drug-resistant acute lymphoblastic leukemia cells and response to treatment. N Engl J Med 2004;351: 533–42. [DOI] [PubMed] [Google Scholar]
- 101. Del Rio M, Molina F, Mollevi CB, et al. Gene expression signature in advanced colorectal cancer patients select drugs and response for the use of leucovorin, fluorouracil, and irinotecan. J Clin Oncol 2007;25:773–80. [DOI] [PMC free article] [PubMed] [Google Scholar]
- 102. Gardner D. Using genomics to help predict drug interactions. J Biomed Inform 2004;37:139–46. [DOI] [PubMed] [Google Scholar]
- 103. Lee MD, Ayanoglu E, Gong L.. Drug-induced changes in P450 enzyme expression at the gene expression level: a new dimension to the analysis of drug-drug interactions. Xenobiotica 2006;36:1013–80. [DOI] [PubMed] [Google Scholar]
- 104. Duran-Frigola M, Aloy P.. Recycling side-effects into clinical markers for drug repositioning. Genome Med 2012;4:3.. [DOI] [PMC free article] [PubMed] [Google Scholar]
- 105. Campillos M, Kuhn M, Gavin A-C, et al. Drug target identification using side-effect similarity. Science 2008;321:263–6. [DOI] [PubMed] [Google Scholar]
- 106. Yang L, Agarwal P.. Systematic drug repositioning based on clinical side-effects. Plos One 2011;6:e28025.. [DOI] [PMC free article] [PubMed] [Google Scholar]
- 107. Gottlieb A, Stein GY, Ruppin E, et al. PREDICT: a method for inferring novel drug indications with application to personalized medicine. Mol Syst Biol 2011;7:496.. [DOI] [PMC free article] [PubMed] [Google Scholar]
- 108. Takarabe M, Kotera M, Nishimura Y, et al. Drug target prediction using adverse event report systems: a pharmacogenomic approach. Bioinformatics 2012;28:I611–18. [DOI] [PMC free article] [PubMed] [Google Scholar]
- 109. Yamanishi Y, Kotera M, Moriya Y, et al. DINIES: drug-target interaction network inference engine based on supervised analysis. Nucleic Acids Res 2014;42:W39–45. [DOI] [PMC free article] [PubMed] [Google Scholar]
- 110. Gottlieb A, Stein GY, Oron Y, et al. INDI: a computational framework for inferring drug interactions and their associated recommendations. Mol Syst Biol 2012;8:592.. [DOI] [PMC free article] [PubMed] [Google Scholar]
- 111. Zhang P, Wang F, Hu J, et al. Label propagation prediction of drug-drug interactions based on clinical side effects. Sci Rep 2015;5:12339.. [DOI] [PMC free article] [PubMed] [Google Scholar]
- 112. Paik H, Chung A-Y, Park H-C, et al. Repurpose terbutaline sulfate for amyotrophic lateral sclerosis using electronic medical records. Sci Rep 2015;5:8580.. [DOI] [PMC free article] [PubMed] [Google Scholar]
- 113. Chiang AP, Butte AJ.. Systematic evaluation of drug-disease relationships to identify leads for novel drug uses. Clin Pharmacol Ther 2009;86:507–10. [DOI] [PMC free article] [PubMed] [Google Scholar]
- 114. Jang D, Lee S, Lee J, et al. Inferring new drug indications using the complementarity between clinical disease signatures and drug effects. J Biomed Inform 2016;59:248–57. [DOI] [PubMed] [Google Scholar]
- 115. Vilar S, Uriarte E, Santana L, et al. Detection of drug-drug interactions by modeling interaction profile fingerprints. Plos One 2013;8:e58321.. [DOI] [PMC free article] [PubMed] [Google Scholar]
- 116. WHO Collaborating Centre for Drug Statistics Methodology. ATC/DDD Index 2016. http://www.whocc.no/atc_ddd_index/ (15 March 2016, date last accessed).
- 117. Dunkel M, Guenther S, Ahmed J, et al. SuperPred: drug classification and target prediction. Nucleic Acids Res 2008;36: W55–9. [DOI] [PMC free article] [PubMed] [Google Scholar]
- 118. Nickel J, Gohlke B-O, Erehman J, et al. SuperPred: update on drug classification and target prediction. Nucleic Acids Res 2014;42:W26–31. [DOI] [PMC free article] [PubMed] [Google Scholar]
- 119. Schena M, Shalon D, Davis RW, et al. Quantitative monitoring of gene-expression patterns with a complementary-DNA microarray. Science 1995;270:467–70. [DOI] [PubMed] [Google Scholar]
- 120. FDA, U.S. Food and Drug Administration. http://www.fda.gov/ (01 February 2016, date last accessed).
- 121. Unified Medical Language System (UMLS). https://www.nlm.nih.gov/research/umls/ (15 January 2016, date last accessed).
- 122. SIDER Side Effect Resource. http://sideeffects.embl.de/ (15 January 2016, date last accessed).
- 123. Japan Pharmaceutical Information Center. http://www.japic.or.jp/ (15 January 2016, date last accessed).
- 124.Drug-target Interaction Network Inference Engine based on Supervised Analysis. http://www.genome.jp/tools/dinies/ (15 January 2016, date last accessed). [DOI] [PMC free article] [PubMed]
- 125. Choi J, Davis MJ, Newman AF, et al. A semantic web ontology for small molecules and their biological targets. J Chem Inf Model 2010;50:732–41. [DOI] [PubMed] [Google Scholar]
- 126. Tan F, Yang R, Xu X, et al. Drug repositioning by applying 'expression profiles' generated by integrating chemical structure similarity and gene semantic similarity. Mol BioSyst 2014;10:1126–38. [DOI] [PubMed] [Google Scholar]
- 127. Palma G, Vidal ME, Raschid L.. Drug-target interaction prediction using semantic similarity and edge partitioning In: Mika Pet al. (eds). The Semantic Web-ISWC 2014, Lecture Notes in Computer Science. Switzerland: Springer International Publishing, 2014, 131–46. [Google Scholar]
- 128. Chen B, Ding Y, Wild DJ.. Assessing drug target association using semantic linked data. Plos Comput Biol 2012;8: e1002574.. [DOI] [PMC free article] [PubMed] [Google Scholar]
- 129. Hoehndorf R, Gruenberger M, Gkoutos GV, et al. Similarity-based search of model organism, disease and drug effect phenotypes. J Biomed Semantics 2015;6:6.. [DOI] [PMC free article] [PubMed] [Google Scholar]
- 130. PhenomeNet - Cross Species Phenotype Network. http://phenomebrowser.net/index.html (15 March 2016, date last accessed).
- 131. Lee W-N, Bridewell W, Das AK Comparison of semantic similarity measures for application specific ontology pruning. In: 2011 First IEEE International Conference on Healthcare Informatics, Imaging and Systems Biology. California, USA: IEEE, 2011, pp. 97–103. [Google Scholar]
- 132. Andronis C, Sharma A, Virvilis V, et al. Literature mining, ontologies and information visualization for drug repurposing. Brief Bioinform 2011;12:357–68. [DOI] [PubMed] [Google Scholar]
- 133. Wild DJ, Ding Y, Sheth AP, et al. Systems chemical biology and the Semantic Web: what they mean for the future of drug discovery research. Drug Discov Today 2012;17: 469–74. [DOI] [PubMed] [Google Scholar]
- 134. Chen H, Xie G.. The use of web ontology languages and other semantic web tools in drug discovery. Expert Opin Drug Discov 2010;5:413–23. [DOI] [PubMed] [Google Scholar]
- 135. Pesquita C, Faria D, Falcao AO, et al. Semantic similarity in biomedical ontologies. Plos Comput Biol 2009;5:e1000443.. [DOI] [PMC free article] [PubMed] [Google Scholar]
- 136. Kuhn M, Campillos M, Letunic I, et al. A side effect resource to capture phenotypic effects of drugs. Mol Syst Biol 2010;6:343.. [DOI] [PMC free article] [PubMed] [Google Scholar]
- 137. Kuhn M, Letunic I, Jensen LJ, et al. The SIDER database of drugs and side effects. Nucleic Acids Res 2016;44:D1075–9. [DOI] [PMC free article] [PubMed] [Google Scholar]