

Abstract
Objective
Obesity alters protein metabolism in skeletal muscle, but consistent evidence is lacking. We compared muscle protein synthesis in adults with obesity to that in lean controls in the fasted state and during an amino acid infusion.
Methods
Ten subjects with obesity (age 36 ± 3 years; BMI 34 ± 1 kg/m2) and ten controls (age 35 ± 3 years; BMI 23 ± 1 kg/m2) received an infusion of L-[2,3,3,4,5,5,5,6,6,6-2H10]leucine (0.15 μmol/kg FFM/min) to measure muscle protein synthesis after an overnight fast and during amino acid infusion.
Results
Despite greater muscle mTOR phosphorylation (P ≤ 0.05), fasted-state mixed-muscle and mitochondrial protein synthesis were lower in subjects with obesity (P ≤ 0.05). However, the change in mixed-muscle protein synthesis during the amino acid infusion was 2.7-fold greater in subjects with obesity (P ≤ 0.05), accompanied by a greater change in S6K1 phosphorylation (P ≤ 0.05). The change in mitochondrial protein synthesis did not differ between groups (P > 0.05).
Conclusions
Adults with obesity have reduced muscle protein synthesis in the fasted state, but this response is compensated for by a greater change in overall muscle protein synthesis during amino acid infusion.
Keywords: protein metabolism, mitochondria, amino acids
Introduction
Skeletal muscle plays a key role in health and disease, including in humans with obesity (1). In these individuals, overall muscle (i.e., mixed-muscle) protein synthesis appears reduced in the fasted state (2, 3), but it is stimulated similar to that of lean subjects during a hyperaminoacidemic hyperinsulinemic clamp test (2). Myofibrillar-specific protein synthesis was not found to be lower in the fasted state in subjects with obesity (4, 5, 6), although it was stimulated less than that of lean subjects during a hyperaminoacidemic hyperinsulinemic clamp test (6) or following meal ingestion (5). Therefore, although obesity appears to alter protein metabolism in muscle, the overall evidence is not consistent, and the responses appear to also relate to the specific protein pool studied. Furthermore, the available evidence has been obtained under limited experimental conditions. Employing diverse experimental manipulations on individuals with obesity can enhance our understanding of the regulation of muscle protein synthesis in these individuals.
In healthy, lean humans, plasma amino acids play a greater role than plasma insulin in stimulating muscle protein synthesis (7). Humans with obesity consume higher proportions of protein, larger meal portions, and more frequent meals (8, 9, 10, 11, 12), which can mediate large and prolonged hyperaminoacidemia. In this regard, the response to large plasma amino acid loads may reveal responses in muscle protein synthesis not evident during experiments where the plasma insulin concentration is clamped or following ingestion of a certain meal. Currently, there is no evidence regarding how hyperaminoacidemia, apart from any other experimental manipulations, may affect mixed-muscle protein synthesis in humans with obesity. Among proteins in muscle, mitochondrial proteins have an important role in energy metabolism. To date, only a few studies have assessed the specific effects of obesity on the synthesis of muscle mitochondrial proteins (2, 13).
Based on our previous findings (3), we hypothesized that fasted-state mixed-muscle protein synthesis is lower in subjects with obesity than in lean controls, and this may also apply to mitochondrial proteins, which are less abundant in obesity (14, 15). We hypothesized that hyperaminoacidemia induces a greater change in fasted-state mixed-muscle protein synthesis in subjects with obesity and that this response partially compensates for the lower fasted-state mixed-muscle protein synthesis in these subjects. Furthermore, we postulated that the amino acid-induced increase in mitochondrial protein synthesis in subjects with obesity is lower than that in lean controls, similar to previously reported evidence (2). We focused our studies on middle-aged adults to avoid any effects of aging on the measured parameters.
Methods
Participants
All studies were performed after approval of the experimental procedures by the Institutional Review Board at Mayo Clinic. Written informed consent was obtained from each study participant. We targeted individuals with obesity (body mass index (BMI) >30 kg/m2) and lean controls (BMI <25 kg/m2) that did not participate in regular physical activity more than two days per week (i.e., sedentary individuals).
Subjects underwent screening within the Clinical Studies Infusion Unit (CSIU) at Mayo Clinic in Scottsdale, Arizona. Exclusion criteria included the presence of acute illness, diabetes, liver, renal or heart disease, and chronically elevated blood pressure (systolic, >150 mmHg; diastolic, >100 mmHg). Subjects were excluded if they participated in a weight-loss regimen, smoked, or used nutritional supplements, prescriptions or over-the-counter medications. Subjects included in the study were determined to be healthy based on medical history, physical exam, electrocardiogram, and standard blood and urine tests. Insulin sensitivity was estimated using the Matsuda Insulin Sensitivity Index (ISI) (16). ISI was calculated from the plasma insulin and glucose responses to an oral glucose tolerance test (OGTT), as previously described (16). Following the OGTT, subjects were included in the study only if the fasting plasma glucose level was <126 mg/dl or the 2-h plasma glucose level was <200 mg/dl (i.e., no diabetes).
Body composition was measured using bioelectrical impedance analysis (BIA 310e, Biodynamics Corp., Shoreline, WA), and skeletal muscle mass was calculated from the BIA-determined bioresistance measurements (17). Maximal oxygen consumption was measured using an incremental cycle ergometer test (20 Watts/min) to volitional exhaustion and by continuous monitoring of expired gases (MedGraphics Metabolic Cart, Saint Paul, MN).
Experimental Design
Participants were instructed to avoid any form of exercise, maintain their regular diet, and avoid alcohol consumption for the three-day period prior to their study visits. All studies were conducted at the CSIU, starting at ~7:30 am after subjects verbally confirmed they had completed a 10-h overnight fast and complied with the exercise and dietary instructions indicated above. One catheter was placed into an antecubital arm vein for infusions and another in a retrograde fashion in a dorsal hand vein for blood sampling, performed using the heated-hand technique. An infusion of d10 leucine (L-[2,3,3,4,5,5,5,6,6,6-2H10]leucine), 0.15 μmol·kg FFM−1·min−1 (priming dose, 6.4 μmol·kg FFM−1), was started (i.e., time 0) and continued throughout the infusion study to determine the synthesis rates of muscle proteins using experimental procedures we have previously described (18). Infusion of an amino acid solution (15% Clinisol, Baxter Healthcare Corporation, Deerfield, IL), 4 mg·kg FFM−1·min−1 (priming dose, 82 mg·kg FFM−1), was started at 300 min and continued for 240 min (i.e., 540 min after initiation of the experiments). During the amino acid solution infusion, the infusion rate of d10 leucine was increased (0.29 μmol·kg FFM−1·min−1; priming dose, 2.6 μmol·kg FFM−1) to account for dilution of d10 leucine by exogenous leucine. Biopsy samples (~180 mg) from vastus lateralis muscle were collected at 120 and 300 min (i.e., fasted) and again at 540 min (i.e., elevated plasma amino acids). Tissue for the isolation of muscle mitochondria was processed immediately. The remaining tissue was stored in liquid nitrogen after removing the visible fat and connective tissue and blotting the samples dry. Blood samples were collected for the determination of d9-leucine enrichment (18) and various biochemical parameters in the fasted state and during the amino acid infusion.
Stable Isotope Enrichment Determination
Measurements of d9-leucine enrichment in blood and mixed-muscle protein, the latter reflecting total protein in muscle homogenates, were performed following procedures we have previously described (18). Briefly, proteins were precipitated in 1 ml of blood using sulfosalicylic acid (SSA), while 10–15 mg of tissue from each muscle biopsy was homogenized in SSA to precipitate muscle proteins. Precipitated proteins in muscle samples were hydrolyzed with 6 N HCl. Amino acids from the blood SSA-supernatant and those from the muscle HCl hydrolysate were passed through cation-exchange columns to purify the amino acids, and d9-leucine enrichment was measured using liquid chromatography-tandem mass spectrometry (LC-MS/MS). The details on the procedures used to measure d9-leucine enrichment in blood and mixed-muscle protein are provided in the Supplementary Files.
Enrichment of muscle mitochondrial protein with d9-leucine was determined in muscle mitochondrial protein isolates prepared from ~80 mg of fresh tissue using differential centrifugation procedures we have previously described (19). Proteins in mitochondrial isolates were hydrolyzed with 6 N HCl and processed for d9-leucine enrichment by LC-MS/MS, similar to the procedure for mixed-muscle protein. Details on the determination of mitochondrial protein d9-leucine enrichment are provided in the Supplementary Files.
Protein Immunoblot Assays
Approximately 70 mg of muscle was homogenized using procedures we have previously described (3) in order to evaluate proteins involved in the translational control of muscle protein synthesis. These proteins included mammalian target of rapamycin (mTOR), the ribosomal protein S6 kinase-1 (S6K1), and eukaryotic translation initiation factor-2α (eIF2α). Furthermore, we evaluated the abundance of peroxisome proliferator-activated receptor gamma coactivator 1-alpha (PGC1α), which is involved in muscle mitochondrial biogenesis. More details on the protein immunoblot procedures are provided in the Supplementary Files.
mRNA Quantification
For the determination of the mRNA expression of PGC1α and GAPDH, total RNA was extracted from 20–30 mg muscle using procedures we have previously described (3). The isolated RNA was used to perform cDNA synthesis using the ABI High Capacity cDNA Reverse Transcription kit (Thermo Fisher Scientific Inc., Waltham, MA), and real-time PCR was performed on an Applied Biosystems 7900HT Fast Real-Time PCR System (Thermo Fisher Scientific Inc., Waltham, MA) using predesigned TaqMan® gene expression assays (probe/primer sets) for PGC1α (assay Hs00173304_m1) and GAPDH (assay Hs02786624_g1) (Thermo Fisher Scientific Inc., Waltham, MA).
Other Biochemical Assays
The concentrations of plasma amino acids were determined using high-performance liquid chromatography (HPLC) (20). Commercially available kits (ALPCO Diagnostics, Windham, NH) were used to measure concentrations of plasma insulin (80-INSHU-E01.1), C-peptide (80-CPTHU-E01.1), glucagon (48-GLUHU-E01) and insulin-like growth factor 1 (IGF-1) (22-IGFHU-E01). Plasma glucose concentrations were measured on an automated glucose analyzer (YSI 2300, Yellow Springs, OH). Plasma concentrations of nonesterified fatty acids (NEFA) were determined using HPLC-mass spectrometry (HPLC-MS) (21). Protein concentrations in muscle homogenates and mitochondrial isolates were determined with the Lowry method (22).
Calculations
The fractional synthesis rate (FSR; %·hour−1) of mixed-muscle and mitochondrial proteins was determined by the precursor-product approach (18). The change in FSR in response to elevated plasma amino acid concentration was calculated as the difference between the FSR during elevated plasma amino acids and that in the fasted state. The measured mRNA levels were normalized to GAPDH, and responses within and between groups were calculated using the comparative CT method (2−ΔΔCT).
Statistical Analyses
Data were evaluated for normal distribution determination, and parameters that were not normally distributed were log-transformed. Subject characteristics and changes in fasted-state values due to elevated plasma amino acids were compared between groups using Student’s unpaired t-test. For all other variables measured before and after the amino acid infusion, two-way (obesity x amino acids) repeated measures ANOVA was used to test for main effects of obesity and amino acids. Multiple pairwise comparisons (i.e., lean versus subjects with obesity in the fasted state and during elevated plasma amino acids, as well as fasted state versus elevated plasma amino acids within groups) were performed using the Bonferroni procedure. The Pearson product-moment correlation coefficient (r) was calculated to test the strength of the association between variables of interest. Data are presented as the mean ± SEM, and the significance level was set at P ≤ 0.05. Statistical analyses were performed using commercial software (GraphPad Prism version 7.00, GraphPad Software, La Jolla, CA).
Results
Mixed-muscle and Muscle Mitochondrial Protein Synthesis
Characteristics of the study participants, including lean/insulin-sensitive individuals and a population with obesity/insulin resistance, are provided in Table 1.
Table 1.
Subject characteristics
| Lean Subjects | Subjects with obesity | |
|---|---|---|
| n (F/M) | 6/4 | 4/6 |
| Age (years) | 34.8 ± 3.1 | 36.3 ± 2.8 |
| Weight (kg) | 64.7 ± 3.8 | 101.9 ± 4.6* |
| Height (cm) | 169.1 ± 2.7 | 171.9 ± 2.3 |
| BMI (kg·m−2) | 22.5 ± 0.8 | 34.4 ± 1.1 |
| FFM (kg) | 49.1 ± 3.3 | 67.8 ± 3.1* |
| SMM (kg) | 24.0 ± 2.1 | 31.2 ± 2.0* |
| FM (kg) | 15.6 ± 1.9 | 34.0 ± 3.4* |
| FFM (%) | 75.9 ± 2.6 | 66.9 ± 2.4* |
| SMM (%) | 37.3 ± 2.6 | 30.9 ± 2.1 |
| Body fat mass (%) | 24.1 ±2.6 | 33.1 ± 2.4* |
| VO2max (ml·min−1) | 1800 ± 223 | 2289 ± 188 |
| VO2max (ml·kgFFM−1·min−1) | 35.7 ± 2.4 | 33.9 ± 2.4 |
| Waist circumference (cm) | 79.9 ± 2.2 | 106.9 ± 3.4* |
| Hip circumference (cm) | 99.7 ± 2.2 | 117.5 ± 3.8* |
| Waist-to-hip ratio | 0.80 ± 0.01 | 0.91 ± 0.03* |
| Systolic blood pressure (mmHg) | 118 ± 3 | 122 ± 3 |
| Diastolic blood pressure (mmHg) | 73 ± 3 | 79 ± 3 |
| Fasting plasma glucose (mg·dl−1) | 87.5 ± 2.2 | 98.4 ± 4.4* |
| 2-hour OGTT plasma glucose (mg·dl−1) | 98.3 ± 9.5 | 126.2 ± 10.1 |
| Fasting plasma insulin (μIU·ml−1) | 4.2 ± 0.5 | 10.9 ± 1.9* |
| Fasting plasma glucagon (pg·ml−1) | 203 ± 78 | 255 ± 102 |
| Matsuda-ISI | 8.9 ± 0.8 | 4.6 ± 1.4* |
| HOMA-IR | 0.9 ± 0.1 | 2.7 ± 0.6* |
| HbA1c (%) | 5.3 ± 0.1 | 5.7 ± 0.1* |
| Plasma triglycerides (mg·dl−1) | 74.8 ± 9.6 | 191.0 ± 43.9* |
| Plasma NEFA (mmol·l−1) | 0.445 ± 0.072 | 0.387 ± 0.050 |
| Total plasma cholesterol (mg·dl−1) | 181.5 ± 14.0 | 178.8 ± 10.2 |
| Plasma HDL cholesterol (mg·dl−1) | 69.1 ± 5.4 | 40.9 ± 2.9* |
| Plasma LDL cholesterol (mg·dl−1) | 97.3 ± 12.6 | 98.4 ± 7.7 |
| TSH (mIU·l−1) | 2.1 ± 0.5 | 1.8 ± 0.3 |
Values represent the mean ± SEM. BMI, body mass index. FFM, fat-free mass; SMM, skeletal muscle mass (calculated from bioelectrical impedance analysis-bioresistance measurements (17)); FM, fat mass; VO2max, maximal oxygen uptake; OGTT, oral glucose tolerance test; Matsuda-ISI, Matsuda Insulin Sensitivity Index; HOMA-IR, Homeostatic Model Assessment of Insulin Resistance; NEFA, nonesterified fatty acids, HDL, high-density lipoprotein; LDL, low-density lipoprotein; TSH, thyroid-stimulating hormone;
P ≤ 0.05 versus lean subjects.
The blood d9-leucine enrichment response is shown in Figure 1. Mixed-muscle and mitochondrial protein d9-leucine enrichments are presented in Table 2. The results of ANOVA indicated main effects of amino acids (P ≤ 0.05), but not obesity (P > 0.05), on mixed-muscle protein synthesis. In the fasted state, mixed-muscle protein synthesis was lower in the subjects with obesity than the lean controls (Figure 2A). Infusion of the amino acid solution elevated the concentration of individual amino acids in plasma (Table S1) and increased mixed-muscle protein synthesis in both the lean controls and the subjects with obesity (Figure 2A). However, in response to a comparable elevation in overall plasma amino acid concentrations in the two groups (Table 3), the change in fasted-state mixed-muscle protein synthesis was significantly greater in the subjects with obesity (Figure 2A).
Figure 1.

Blood leucine enrichment. Blood d9-leucine enrichment in the course of the experimental protocol associated with the fasted state and elevated plasma amino acid concentrations (i.e., amino acids). MPE, molar percent excess.
Table 2.
Mixed-muscle protein and muscle mitochondrial protein d9-leucine enrichment
| Biopsy time
|
|||
|---|---|---|---|
| 120 min | 300 min | 540 min | |
| Mixed-muscle protein (MPE) | |||
| Lean subjects | 0.007 ± 0.001 | 0.017 ± 0.001# | 0.034 ± 0.002& |
| Subjects with obesity | 0.006 ± 0.001 | 0.014 ± 0.001# | 0.034 ± 0.004& |
| Mitochondrial protein (MPE) | |||
| Lean subjects | 0.011 ± 0.001 | 0.023 ± 0.001# | 0.045 ± 0.004& |
| Subjects with obesity | 0.010 ± 0.001 | 0.019 ± 0.001# | 0.042 ± 0.002& |
Values represent the mean ± SEM. Biopsy time reflects the time after the start of leucine tracer infusion (see text); 120 and 300 min correspond to fasted-state plasma amino acid concentrations, whereas 540 min corresponds to elevated plasma amino acid concentrations; MPE, molar percent excess. There were significant time (P ≤ 0.05) but not group (P > 0.05) main effects for both mixed-muscle and mitochondrial proteins.
P ≤ 0.05 versus 120 min;
P ≤ 0.05 versus both 120 and 300 min.
Figure 2.

Synthesis rate of skeletal muscle proteins. Synthesis rates of mixed-muscle (A) and muscle mitochondrial (B) proteins in the fasted state and during elevated plasma amino acids (i.e., AA). The bars to the right of the dotted line show the change (i.e., amino acids minus the fasted state) in the synthesis rate of mixed-muscle (A) and muscle mitochondrial (B) proteins in response to elevated plasma amino acid concentrations. Values represent the mean ± SEM. *P ≤ 0.05 versus lean subjects, †P ≤ 0.05 versus fasted state.
Table 3.
Plasma biochemical parameters in the fasted state and in the presence of elevated plasma amino acid concentrations
| Fasted | Amino acids | Change (Δ) | |
|---|---|---|---|
| Total amino acids (μmol·L−1) | |||
| Lean subjects | 1412 ± 76 | 2920 ± 319† | 1509 ± 215 |
| Subjects with obesity | 1604 ± 75 | 3266 ± 191† | 1662 ± 195 |
| Essential amino acids (μmol·L−1) | |||
| Lean subjects | 609 ± 40 | 1774 ± 201† | 1165 ± 158 |
| Subjects with obesity | 687 ± 41 | 2001 ± 124† | 1314 ± 119 |
| Nonessential amino acids (μmol·L−1) | |||
| Lean subjects | 803 ± 49 | 1147 ± 130† | 344 ± 68 |
| Subjects with obesity | 916 ± 57 | 1265 ± 105† | 349 ± 97 |
| BCAA (μmol·L−1) | |||
| Lean subjects | 358 ± 27 | 1079 ± 115† | 722 ± 93 |
| Subjects with obesity | 425 ± 29 | 1187 ± 85† | 761 ± 84 |
| Insulin (μIU·ml−1) | |||
| Lean subjects | 4.7 ± 0.6 | 9.3 ± 1.1 | 4.6 ± 0.9 |
| Subjects with obesity | 8.2 ± 1.1 | 29.7 ± 4.4†* | 21.6 ± 4.4* |
| Glucagon (pg·ml−1) | |||
| Lean subjects | 227 ± 82 | 401 ± 82 | 174 ± 24 |
| Subjects with obesity | 268 ± 102 | 647 ± 195† | 379 ± 107 |
| IGF-1 (ng·ml−1) | |||
| Lean subjects | 181 ± 12 | 182 ± 10 | 1 ± 3 |
| Subjects with obesity | 136 ± 16* | 146 ± 19 | 10 ± 5 |
| C-peptide (pmol·L−1) | |||
| Lean subjects | 337 ± 69 | 649 ± 75† | 312 ± 44 |
| Subjects with obesity | 753 ± 163* | 1358 ± 155†* | 605 ± 123* |
| Glucose (mg·dl−1) | |||
| Lean subjects | 87 ±2 | 94 ± 2† | 7 ± 2 |
| Subjects with obesity | 91 ± 3 | 101 ± 3† | 10 ± 3 |
Values represent the mean ± SEM. BCAA, branched-chain amino acids; IGF-1, insulin-like growth factor 1;
P ≤ 0.05 versus lean subjects,
P ≤ 0.05 versus fasted state.
With respect to mitochondrial protein synthesis, ANOVA showed main effects of amino acids (P ≤ 0.05) but not obesity (P > 0.05). In the fasted state, the mitochondrial protein synthesis rate was lower in the subjects with obesity than the lean controls (Figure 2B). Mitochondrial protein synthesis increased in both groups in the presence of elevated plasma amino acid concentrations (Figure 2B). However, unlike the greater change in fasted-state mixed-muscle protein synthesis in the presence of elevated plasma amino acid concentrations in the subjects with obesity, the change in fasted-state mitochondrial protein synthesis did not differ significantly between groups (Figure 2B). No significant differences (P > 0.05) were found in muscle mitochondrial protein concentrations (mg/g wet weight muscle) between the subjects with obesity and the lean controls in the fasted state (3.5 ± 0.3 vs 3.0 ± 0.3) or in response to elevated plasma amino acids (3.0 ± 0.4 vs 3.0 ± 0.2).
Across study participants, fasted-state mixed-muscle protein synthesis correlated inversely with body fat mass (r = −0.45; P ≤ 0.05) but not with the Matsuda ISI (16) (r = 0.16; P > 0.05). Correlations between mixed-muscle and mitochondrial protein synthesis and various anthropometric and blood chemistry parameters are presented in Table S2.
Muscle mTOR, S6K1 and eIF2α Phosphorylation
ANOVA results indicated main effects of obesity (P ≤ 0.05), but not amino acids (P > 0.05), on the ratio of p-mTOR to total mTOR. Both in the fasted state and in the presence of elevated plasma amino acids, the phosphorylation of mTOR was higher in the subjects with obesity (Figure 3A). Consequently, the fold change in mTOR phosphorylation in response to increased plasma amino acid concentration did not differ between the lean subjects and those with obesity (Figure 3A).
Figure 3.
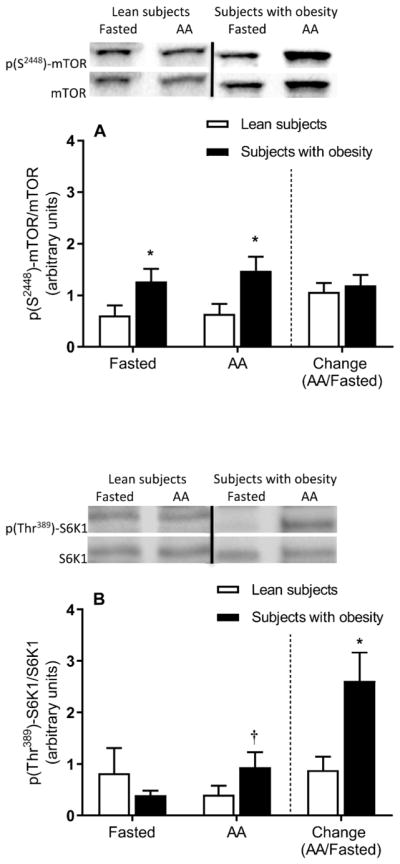
Skeletal muscle mTOR pathway signaling. Muscle mTOR (A) and S6K1 (B) phosphorylation in the fasted state and during elevated plasma amino acids (i.e., AA). The bars to the right of the dotted line show the fold change (i.e., amino acids divided by the fasted state) in mTOR (A) and S6K1 (B) phosphorylation in response to elevated plasma amino acid concentrations. Representative Western blots are shown. Dividing lines between blots indicate blots from different gels or different parts of the same gel. Values represent the mean ± SEM. *P ≤ 0.05 versus lean subjects, †P ≤ 0.05 versus fasted state.
There were no significant main effects for either obesity or amino acids on the phosphorylation of S6K1 (P > 0.05). Phosphorylation of S6K1 was not significantly different between groups in the fasted state (P > 0.05) but it increased in the presence of elevated plasma amino acids in the subjects with obesity, not in the lean subjects (Figure 3A). Accordingly, the fold change in the phosphorylation of muscle S6K1 in response to elevated plasma amino acid concentration was greater in the subjects with obesity (Figure 3B). No significant differences were found in the phosphorylation of eIF2α (Figure 4A).
Figure 4.
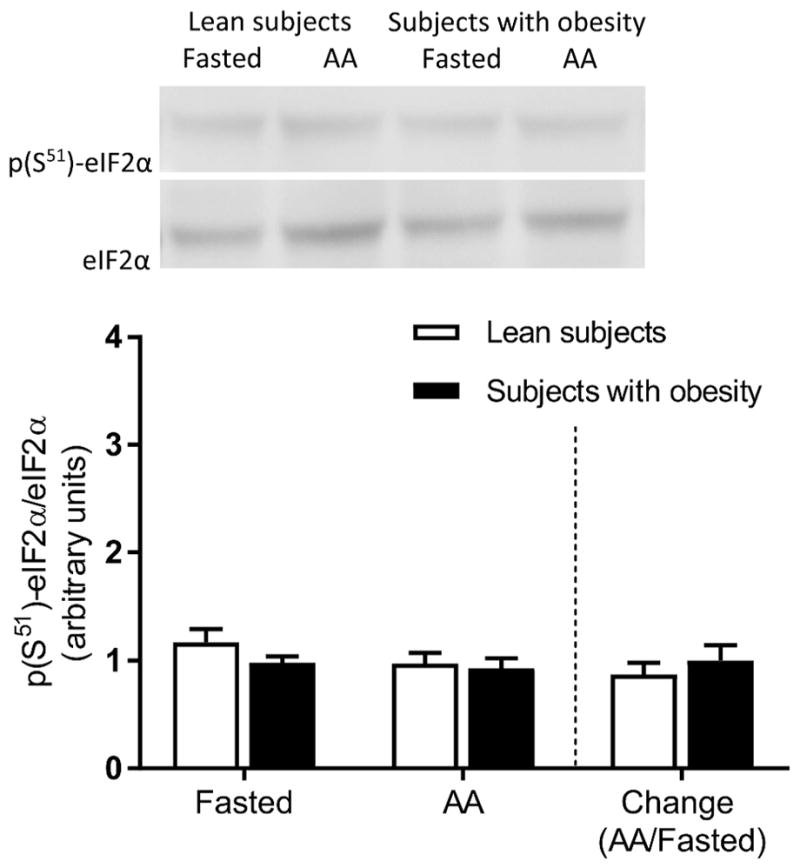
Skeletal muscle eIF2α phosphorylation. Muscle eIF2α phosphorylation in the fasted state and during elevated plasma amino acids (i.e., AA). The bars to the right of the dotted line show the fold change (i.e., amino acids divided by the fasted state) in eIF2α phosphorylation in response to elevated plasma amino acid concentrations. Representative Western blots are shown. Values represent the mean ± SEM.
Muscle PGC1α Expression
PGC1α mRNA expression was lower in the subjects with obesity than the lean subjects in the fasted state (Figure 5A). Interestingly, PGC1α mRNA expression increased in the presence of elevated plasma amino acid concentrations only in the subjects with obesity (P ≤ 0.05). PGC1α protein expression was lower in the subjects with obesity than the lean subjects in the fasted state (Figure 5B), but no differences were found in response to the increase in plasma amino acid concentration (P ≤ 0.05).
Figure 5.
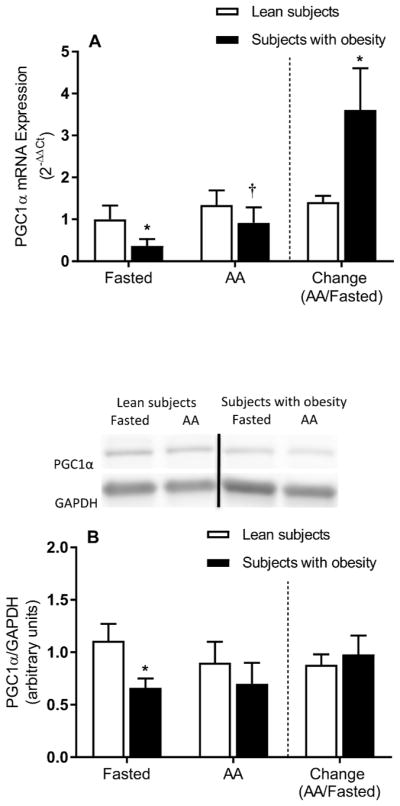
Skeletal muscle PGC1α mRNA and protein expression. Muscle PGC1α mRNA (A) and protein (B) expression in the fasted state and during elevated plasma amino acids (i.e., AA). The bars to the right of the dotted line show the fold change (i.e., amino acids divided by the fasted state) in muscle PGC1α mRNA (A) and protein (B) expression in response to elevated plasma amino acid concentrations. Representative Western blots are shown for PGC1α protein expression (B). Dividing lines between blots indicate blots from different gels or different parts of the same gel. Values represent the mean ± SEM. *P ≤ 0.05 versus lean subjects, †P ≤ 0.05 versus fasted state.
Plasma Hormones
In the fasted state, the plasma insulin concentration was not different between groups, although the plasma IGF-1 concentration was lower in the subjects with obesity (Table 3). In the presence of elevated plasma amino acids, the change in plasma insulin concentration was greater in the subjects with obesity, but the change in plasma IGF-1 concentration was not different between groups (Table 3).
Discussion
Herein, we showed that obesity alters the rate of muscle protein synthesis in the fasted state and its response to increased plasma amino acid concentrations. Specifically, subjects with obesity/insulin resistance had lower mixed-muscle and mitochondrial protein synthesis in the fasted state, although this reduced rate of mixed-muscle protein synthesis was compensated for by a greater change in the presence of increased plasma amino acids. However, a greater change in the rate of protein synthesis in the presence of elevated plasma amino acids was not observed with respect to muscle mitochondrial protein.
Similar to our findings, those from previous research have shown a reduced fasted-state FSR of mixed-muscle protein in individuals with obesity (2). Likewise, the forearm rate of amino acid disappearance, an index of muscle protein synthesis, was lower in subjects with obesity than lean controls after 12 hours of fasting (23). However, others have reported no differences in mixed-muscle (24) or myofibrillar-specific protein synthesis (4, 5, 6, 25) between subjects with obesity and lean subjects in the fasted state. Assuming that mixed-muscle protein synthesis largely reflects contractile protein synthesis (26), the overall evidence would indicate that increased BMI/adiposity does not necessarily impair fasted-state muscle protein synthesis per se, which is analogous to the notion that not all individuals with obesity are metabolically unhealthy (27). Our subjects with obesity had higher fasting plasma glucose concentrations and HbA1c, parameters that were not different in some earlier reports (4, 5, 6). Such differences may explain the discrepancy in the findings on muscle protein synthesis between those previous reports and the present study. Moreover, our subjects with obesity showed lower plasma IGF-1 concentrations than the lean subjects. Muscle protein synthesis is higher when plasma IGF-1 concentrations are elevated either acutely in healthy young subjects (28) or chronically via IGF-1 treatment in older subjects (29). Although not all humans with obesity have low plasma IGF-1 concentrations, obesity is linked to lower plasma IGF-1 levels (30). Notably, when plasma IGF-1 concentrations did not differ from those in lean subjects, no differences in mixed-muscle protein synthesis were detected with obesity (24). Whether differences in plasma glucose and/or IGF-1 metabolism are prerequisites for attenuation of muscle protein synthesis in obesity remains to be determined.
Similar to the finding in a previous report (5), phosphorylation of skeletal muscle mTOR, an anabolic signaling factor in skeletal muscle (31), was higher in the muscle tissue of subjects with obesity in the fasted state, while that of S6K1 did not differ between groups. Although increased mTOR signaling might (32) or might not (33) play a role in insulin resistance in people with obesity, our findings indicate a dissociation between activation of the mTOR pathway and fasted-state muscle protein synthesis in obesity. On the other hand, lower fasted-state mitochondrial-specific protein synthesis in the subjects with obesity may have resulted from lower PGC1α expression (34) in the muscle, secondary to lower PGC1α mRNA expression (Figure 5A).
Greater stimulation of mixed-muscle protein synthesis by increased plasma amino acid concentrations in subjects with obesity compared to lean subjects is a novel finding. Previous studies utilizing the hyperaminoacidemic/hyperinsulinemic clamp or meal ingestion have reported either comparable stimulation of mixed-muscle (2) or lower stimulation of myofibrillar (5, 6, 25), or mitochondrial (2) protein synthesis in humans with obesity. Overall, these previous lines of evidence, along with the differential response in the improvement of the synthesis rate between mixed-muscle protein and mitochondrial protein during elevated plasma amino acids in the two groups in the present study, clearly suggest that the extent of the stimulation of synthesis by plasma amino acids in obesity differs among the various muscle protein pools. We found that the change in the fasted-state rate of mixed-muscle protein synthesis when plasma amino acids were increased in subjects with obesity was ~2.7-fold higher than that in lean subjects. This result indicates that the overall muscle protein synthesis machinery in individuals with obesity has the capacity to compensate for lower fasted-state muscle protein synthesis when the plasma amino acid stimulus becomes available.
The greater change in the fasted-state mixed-muscle protein synthesis induced by plasma amino acids in subjects with obesity might have been mediated by the greater change in muscle S6K1 phosphorylation. However, a comparable response was not evident with respect to mTOR phosphorylation, which may relate to the time course of the signaling of these two proteins or a discordance in their phosphorylation status (35). Sequential muscle biopsies during the amino acid mixture infusion could have provided better insight into the molecular responses underlying the observed changes in muscle protein synthesis. In line with our finding of greater S6K1 phosphorylation in the presence of elevated plasma amino acids, subjects with obesity showed greater S6K1 phosphorylation than lean subjects after ingestion of a high-protein meal (5). However, in the latter study, myofibrillar-specific protein synthesis was stimulated less in the subjects with obesity (5). Consequently, the extent to which signaling through the mTOR/S6K1 pathway was a primary factor regulating the mixed-muscle protein synthesis rate in the present study when plasma amino acids increased remains to be determined.
Insulin appears to have a permissive rather than primary role in stimulating muscle protein synthesis in humans (7). Our findings suggest a greater role of the amino acid-induced physiological increase in plasma insulin in mediating the change in the fasted-state rate of muscle protein synthesis in subjects with obesity/insulin resistance. Therefore, physiologically greater plasma hyperinsulinemia in the presence of a given plasma amino acid load in subjects with obesity may provide an endogenous compensatory mechanism to enhance muscle protein synthesis in this population and overcome lower muscle protein synthesis in the fasted state. Of note, myofibrillar protein synthesis was stimulated less in subjects with obesity during hyperaminoacidemia when plasma insulin concentrations were clamped at similar levels between groups differing in obesity (6), although others have observed comparable stimulation (4). Alternatively, in the presence of insulin resistance in subjects with obesity, mechanism(s) other than a greater plasma insulin response might mediate the greater change in mixed-muscle protein synthesis at comparable plasma amino acid concentrations. However, such mechanism(s) can only be speculated upon at this time.
Measuring the extent of insulin resistance using the euglycemic-hyperinsulinemic clamp requires manipulation of plasma insulin concentrations. However, this approach would have masked the greater endogenous increase in plasma insulin induced by plasma amino acids in subjects with obesity, which is the expected physiological response when the level of plasma amino acids is increased in obesity (5). Nevertheless, it is reasonable to expect that the subjects with obesity remained insulin resistant in the presence of elevated plasma amino acids (33, 36). Therefore, our findings suggest disassociation of the response of muscle protein synthesis (i.e., increased) from that of insulin resistance to glucose metabolism in subjects with obesity under the present experimental conditions.
Unlike the response for mixed-muscle protein synthesis, the change in fasted-state mitochondrial protein synthesis induced by the elevated plasma amino acids was not significantly different between groups. This finding is in line with recent data showing comparable stimulation of muscle mitochondrial protein synthesis between lean subjects and subjects with obesity following meal ingestion (13). When our findings on mitochondrial protein synthesis are considered along with those on mixed-muscle protein synthesis, they suggest that stimulation of mixed-muscle protein, which largely reflects contractile proteins (26), is more responsive than that of muscle mitochondrial protein to the increase in plasma amino acids. Furthermore, despite lower fasted-state mitochondrial protein synthesis in the subjects with obesity, muscle mitochondrial protein content was not different between groups. This result indicates that the synthesis of mitochondria in the fasted state alone may not contribute to the reduced mitochondrial protein content previously seen in people with obesity (14).
Our subjects in the two groups were not balanced with respect to gender, which may constitute a limitation of the current study. However, recent reviews of the literature have concluded that there are no gender differences in muscle protein synthesis (37, 38). Absolute skeletal muscle mass was greater in our subjects with obesity, similar to what was previously reported (39, 40, 41, 42). Whether repeated increases in plasma amino acids over time result in greater accretion of muscle protein, and therefore muscle, in individuals with obesity remains unknown. Protein accretion in skeletal muscle depends on the balance between protein synthesis and breakdown, and our findings are limited to protein synthesis. It is further acknowledged that our study constitutes a snapshot of overall long-term responses associated with muscle protein synthesis and that greater body weight-bearing physical activity may also be a factor contributing over time to the greater muscle mass seen in people with obesity.
In conclusion, lower overall muscle protein synthesis in the fasted state in individuals with obesity is compensated for at the mixed-muscle, not the mitochondrial, protein level by a greater change in the synthesis rate when plasma amino acid concentrations increase. Future studies are needed to determine the underlying mechanisms that contribute to these responses within the complex metabolic setting of human obesity. Furthermore, clinical studies may evaluate the implications of reduced muscle protein synthesis in the fasted state, as well as in the absence of nutritional anabolic stimuli (i.e., amino acids) for prolonged periods of time (i.e., during certain dietary interventions), on muscle protein accretion and function in people with obesity.
Supplementary Material
What is already known about this subject?
Obesity alters protein metabolism in muscle, but the evidence is limited with respect to responses under certain experimental conditions.
Lower mitochondrial content has been reported in skeletal muscle from people with obesity compared to lean controls, but the extent to which the synthesis rate of mitochondrial proteins is implicated in this response is not clear.
What does the study add?
We show that people with obesity have reduced fasted-state mixed-muscle protein synthesis, but the rate of mixed-muscle protein synthesis changes more than that of normal-weight controls during hyperaminoacidemia.
Elevating plasma amino acids enhances the rate of muscle mitochondrial protein synthesis in people with obesity to the same extent as that in lean people despite lower mitochondrial protein synthesis in the fasted state in people with obesity.
Acknowledgments
Funding: The study was supported by NIH/NIDDK grant R01DK094062 (CSK), the Mayo Clinic Metabolomics Resource Core through grant number U24DK100469 from the NIH/NIDDK and the Mayo Clinic CTSA grant UL1TR000135 from the National Center for Advancing Translational Sciences.
We thank Dr. Wayne Willis for providing technical expertise for the isolation of muscle mitochondria. We also thank the staff and nurses at the Mayo Clinic Arizona for help with conducting the experiments, as well as the Mayo Clinic Metabolomics Core for performing the stable isotope enrichment analyses.
Footnotes
Clinical Trial Registration: ClinicalTrials.gov (NCT01824173)
Disclosure: The authors declare no conflicts of interest.
Author Contributions: LJM and CSK designed the studies. LT, NH, LR, and CSK conducted the experiments. LT, KAK, NH, JR, JMD, ADL, CCC, SHP and CSK analyzed the data. LT and CSK wrote the manuscript.
References
- 1.Wolfe RR. The underappreciated role of muscle in health and disease. Am J Clin Nutr. 2006;84:475–482. doi: 10.1093/ajcn/84.3.475. [DOI] [PubMed] [Google Scholar]
- 2.Guillet C, Delcourt I, Rance M, Giraudet C, Walrand S, Bedu M, et al. Changes in basal and insulin and amino acid response of whole body and skeletal muscle proteins in obese men. J Clin Endocrinol Metab. 2009;94:3044–3050. doi: 10.1210/jc.2008-2216. [DOI] [PubMed] [Google Scholar]
- 3.Tran L, Hanavan PD, Campbell LE, De Filippis E, Lake DF, Coletta DK, et al. Prolonged Exposure of Primary Human Muscle Cells to Plasma Fatty Acids Associated with Obese Phenotype Induces Persistent Suppression of Muscle Mitochondrial ATP Synthase beta Subunit. PLoS One. 2016;11:e0160057. doi: 10.1371/journal.pone.0160057. [DOI] [PMC free article] [PubMed] [Google Scholar]
- 4.Chevalier S, Burgos SA, Morais JA, Gougeon R, Bassil M, Lamarche M, et al. Protein and glucose metabolic responses to hyperinsulinemia, hyperglycemia, and hyperaminoacidemia in obese men. Obesity (Silver Spring) 2015;23:351–358. doi: 10.1002/oby.20943. [DOI] [PubMed] [Google Scholar]
- 5.Beals JW, Sukiennik RA, Nallabelli J, Emmons RS, van Vliet S, Young JR, et al. Anabolic sensitivity of postprandial muscle protein synthesis to the ingestion of a protein-dense food is reduced in overweight and obese young adults. Am J Clin Nutr. 2016;104:1014–1022. doi: 10.3945/ajcn.116.130385. [DOI] [PubMed] [Google Scholar]
- 6.Murton AJ, Marimuthu K, Mallinson JE, Selby AL, Smith K, Rennie MJ, et al. Obesity Appears to Be Associated With Altered Muscle Protein Synthetic and Breakdown Responses to Increased Nutrient Delivery in Older Men, but Not Reduced Muscle Mass or Contractile Function. Diabetes. 2015;64:3160–3171. doi: 10.2337/db15-0021. [DOI] [PubMed] [Google Scholar]
- 7.Greenhaff PL, Karagounis LG, Peirce N, Simpson EJ, Hazell M, Layfield R, et al. Disassociation between the effects of amino acids and insulin on signaling, ubiquitin ligases, and protein turnover in human muscle. Am J Physiol Endocrinol Metab. 2008;295:E595–604. doi: 10.1152/ajpendo.90411.2008. [DOI] [PMC free article] [PubMed] [Google Scholar]
- 8.Murtaugh MA, Herrick JS, Sweeney C, Baumgartner KB, Guiliano AR, Byers T, et al. Diet composition and risk of overweight and obesity in women living in the southwestern United States. J Am Diet Assoc. 2007;107:1311–1321. doi: 10.1016/j.jada.2007.05.008. [DOI] [PubMed] [Google Scholar]
- 9.Wang Y, Beydoun MA. Meat consumption is associated with obesity and central obesity among US adults. Int J Obes (Lond) 2009;33:621–628. doi: 10.1038/ijo.2009.45. [DOI] [PMC free article] [PubMed] [Google Scholar]
- 10.Berg C, Lappas G, Wolk A, Strandhagen E, Toren K, Rosengren A, et al. Eating patterns and portion size associated with obesity in a Swedish population. Appetite. 2009;52:21–26. doi: 10.1016/j.appet.2008.07.008. [DOI] [PubMed] [Google Scholar]
- 11.Murakami K, Livingstone MB. Eating Frequency Is Positively Associated with Overweight and Central Obesity in U.S. Adults. J Nutr. 2015;145:2715–2724. doi: 10.3945/jn.115.219808. [DOI] [PubMed] [Google Scholar]
- 12.Berteus Forslund H, Lindroos AK, Sjostrom L, Lissner L. Meal patterns and obesity in Swedish women-a simple instrument describing usual meal types, frequency and temporal distribution. Eur J Clin Nutr. 2002;56:740–747. doi: 10.1038/sj.ejcn.1601387. [DOI] [PubMed] [Google Scholar]
- 13.Beals JW, Mackenzie RWA, van Vliet S, Skinner SK, Pagni BA, Niemiro GM, et al. Protein-rich food ingestion stimulates mitochondrial protein synthesis in sedentary young adults of different BMIs. J Clin Endocrinol Metab. 2017;102:3415–3424. doi: 10.1210/jc.2017-00360. [DOI] [PubMed] [Google Scholar]
- 14.Hwang H, Bowen BP, Lefort N, Flynn CR, De Filippis EA, Roberts C, et al. Proteomics analysis of human skeletal muscle reveals novel abnormalities in obesity and type 2 diabetes. Diabetes. 2010;59:33–42. doi: 10.2337/db09-0214. [DOI] [PMC free article] [PubMed] [Google Scholar]
- 15.Lefort N, Glancy B, Bowen B, Willis WT, Bailowitz Z, De Filippis EA, et al. Increased reactive oxygen species production and lower abundance of complex I subunits and carnitine palmitoyltransferase 1B protein despite normal mitochondrial respiration in insulin-resistant human skeletal muscle. Diabetes. 2010;59:2444–2452. doi: 10.2337/db10-0174. [DOI] [PMC free article] [PubMed] [Google Scholar]
- 16.Matsuda M, DeFronzo RA. Insulin sensitivity indices obtained from oral glucose tolerance testing: comparison with the euglycemic insulin clamp. Diabetes Care. 1999;22:1462–1470. doi: 10.2337/diacare.22.9.1462. [DOI] [PubMed] [Google Scholar]
- 17.Janssen I, Heymsfield SB, Baumgartner RN, Ross R. Estimation of skeletal muscle mass by bioelectrical impedance analysis. J Appl Physiol (1985) 2000;89:465–471. doi: 10.1152/jappl.2000.89.2.465. [DOI] [PubMed] [Google Scholar]
- 18.Tran L, Masters H, Roust LR, Katsanos CS. A new method to measure muscle protein synthesis in humans by endogenously introduced d9-leucine and using blood for precursor enrichment determination. Physiological reports. 2015;3:e12479. doi: 10.14814/phy2.12479. [DOI] [PMC free article] [PubMed] [Google Scholar]
- 19.Kras KA, Willis WT, Barker N, Czyzyk T, Langlais PR, Katsanos CS. Subsarcolemmal mitochondria isolated with the proteolytic enzyme nagarse exhibit greater protein specific activities and functional coupling. Biochemistry and biophysics reports. 2016;6:101–107. doi: 10.1016/j.bbrep.2016.03.006. [DOI] [PMC free article] [PubMed] [Google Scholar]
- 20.Carroll CC, Fluckey JD, Williams RH, Sullivan DH, Trappe TA. Human soleus and vastus lateralis muscle protein metabolism with an amino acid infusion. Am J Physiol Endocrinol Metab. 2005;288:E479–485. doi: 10.1152/ajpendo.00393.2004. [DOI] [PubMed] [Google Scholar]
- 21.Persson XM, Blachnio-Zabielska AU, Jensen MD. Rapid measurement of plasma free fatty acid concentration and isotopic enrichment using LC/MS. J Lipid Res. 2010;51:2761–2765. doi: 10.1194/jlr.M008011. [DOI] [PMC free article] [PubMed] [Google Scholar]
- 22.Lowry OH, Rosebrough NJ, Farr AL, Randall RJ. Protein measurement with the Folin phenol reagent. J Biol Chem. 1951;193:265–275. [PubMed] [Google Scholar]
- 23.Bak AM, Moller AB, Vendelbo MH, Nielsen TS, Viggers R, Rungby J, et al. Differential regulation of lipid and protein metabolism in obese vs. lean subjects before and after a 72-h fast. Am J Physiol Endocrinol Metab. 2016;311:E224–235. doi: 10.1152/ajpendo.00464.2015. [DOI] [PubMed] [Google Scholar]
- 24.Glynn EL, Piner LW, Huffman KM, Slentz CA, Elliot-Penry L, AbouAssi H, et al. Impact of combined resistance and aerobic exercise training on branched-chain amino acid turnover, glycine metabolism and insulin sensitivity in overweight humans. Diabetologia. 2015;58:2324–2335. doi: 10.1007/s00125-015-3705-6. [DOI] [PMC free article] [PubMed] [Google Scholar]
- 25.Smeuninx B, McKendry J, Wilson D, Martin U, Breen L. Age-Related Anabolic Resistance of Myofibrillar Protein Synthesis Is Exacerbated in Obese Inactive Individuals. J Clin Endocrinol Metab. 2017;102:3535–3545. doi: 10.1210/jc.2017-00869. [DOI] [PMC free article] [PubMed] [Google Scholar]
- 26.Hasten DL, Pak-Loduca J, Obert KA, Yarasheski KE. Resistance exercise acutely increases MHC and mixed muscle protein synthesis rates in 78–84 and 23–32 yr olds. Am J Physiol Endocrinol Metab. 2000;278:E620–626. doi: 10.1152/ajpendo.2000.278.4.E620. [DOI] [PubMed] [Google Scholar]
- 27.Ahima RS, Lazar MA. Physiology. The health risk of obesity--better metrics imperative. Science. 2013;341:856–858. doi: 10.1126/science.1241244. [DOI] [PubMed] [Google Scholar]
- 28.Fryburg DA. Insulin-like growth factor I exerts growth hormone- and insulin-like actions on human muscle protein metabolism. Am J Physiol. 1994;267:E331–336. doi: 10.1152/ajpendo.1994.267.2.E331. [DOI] [PubMed] [Google Scholar]
- 29.Butterfield GE, Thompson J, Rennie MJ, Marcus R, Hintz RL, Hoffman AR. Effect of rhGH and rhIGF-I treatment on protein utilization in elderly women. Am J Physiol. 1997;272:E94–99. doi: 10.1152/ajpendo.1997.272.1.E94. [DOI] [PubMed] [Google Scholar]
- 30.Juul A. Serum levels of insulin-like growth factor I and its binding proteins in health and disease. Growth Horm IGF Res. 2003;13:113–170. doi: 10.1016/s1096-6374(03)00038-8. [DOI] [PubMed] [Google Scholar]
- 31.McCarthy JJ, Esser KA. Anabolic and catabolic pathways regulating skeletal muscle mass. Curr Opin Clin Nutr Metab Care. 2010;13:230–235. doi: 10.1097/MCO.0b013e32833781b5. [DOI] [PMC free article] [PubMed] [Google Scholar]
- 32.Um SH, D’Alessio D, Thomas G. Nutrient overload, insulin resistance, and ribosomal protein S6 kinase 1, S6K1. Cell Metab. 2006;3:393–402. doi: 10.1016/j.cmet.2006.05.003. [DOI] [PubMed] [Google Scholar]
- 33.Smith GI, Yoshino J, Stromsdorfer KL, Klein SJ, Magkos F, Reeds DN, et al. Protein Ingestion Induces Muscle Insulin Resistance Independent of Leucine-Mediated mTOR Activation. Diabetes. 2015;64:1555–1563. doi: 10.2337/db14-1279. [DOI] [PMC free article] [PubMed] [Google Scholar]
- 34.Irrcher I, Adhihetty PJ, Sheehan T, Joseph AM, Hood DA. PPARgamma coactivator-1alpha expression during thyroid hormone- and contractile activity-induced mitochondrial adaptations. Am J Physiol Cell Physiol. 2003;284:C1669–1677. doi: 10.1152/ajpcell.00409.2002. [DOI] [PubMed] [Google Scholar]
- 35.Atherton PJ, Etheridge T, Watt PW, Wilkinson D, Selby A, Rankin D, et al. Muscle full effect after oral protein: time-dependent concordance and discordance between human muscle protein synthesis and mTORC1 signaling. Am J Clin Nutr. 2010;92:1080–1088. doi: 10.3945/ajcn.2010.29819. [DOI] [PubMed] [Google Scholar]
- 36.Robinson MM, Soop M, Sohn TS, Morse DM, Schimke JM, Klaus KA, et al. High insulin combined with essential amino acids stimulates skeletal muscle mitochondrial protein synthesis while decreasing insulin sensitivity in healthy humans. J Clin Endocrinol Metab. 2014;99:E2574–2583. doi: 10.1210/jc.2014-2736. [DOI] [PMC free article] [PubMed] [Google Scholar]
- 37.Markofski MM, Volpi E. Protein metabolism in women and men: similarities and disparities. Curr Opin Clin Nutr Metab Care. 2011;14:93–97. doi: 10.1097/MCO.0b013e3283412343. [DOI] [PMC free article] [PubMed] [Google Scholar]
- 38.Smith GI, Mittendorfer B. Sexual dimorphism in skeletal muscle protein turnover. J Appl Physiol (1985) 2016;120:674–682. doi: 10.1152/japplphysiol.00625.2015. [DOI] [PMC free article] [PubMed] [Google Scholar]
- 39.Lafortuna CL, Maffiuletti NA, Agosti F, Sartorio A. Gender variations of body composition, muscle strength and power output in morbid obesity. Int J Obes (Lond) 2005;29:833–841. doi: 10.1038/sj.ijo.0802955. [DOI] [PubMed] [Google Scholar]
- 40.Lafortuna CL, Tresoldi D, Rizzo G. Influence of body adiposity on structural characteristics of skeletal muscle in men and women. Clin Physiol Funct Imaging. 2014;34:47–55. doi: 10.1111/cpf.12062. [DOI] [PubMed] [Google Scholar]
- 41.Tomlinson DJ, Erskine RM, Winwood K, Morse CI, Onambele GL. The impact of obesity on skeletal muscle architecture in untrained young vs. old women. J Anat. 2014;225:675–684. doi: 10.1111/joa.12248. [DOI] [PMC free article] [PubMed] [Google Scholar]
- 42.Forbes GB, Welle SL. Lean body mass in obesity. Int J Obes. 1983;7:99–107. [PubMed] [Google Scholar]
Associated Data
This section collects any data citations, data availability statements, or supplementary materials included in this article.