Abstract
This study used magnetic resonance imaging (MRI), computational fluid dynamics (CFD) modeling, and in vitro experiments to predict patient-specific alterations in hepatic hemodynamics in response to partial hepatectomy in living liver donors. 4D Flow MRI was performed on three donors before and after hepatectomy and models of the portal venous system were created. Virtual surgery was performed to simulate (1) surgical resection and (2) post-surgery vessel dilation. CFD simulations were conducted using in vivo flow data for boundary conditions. CFD results showed good agreement with in vivo data, and in vitro experimental values agreed well with imaging and simulation results. The post-surgery models predicted an increase in all measured hemodynamic parameters, and the dilated virtual surgery model predicted post-surgery conditions better than the model that only simulated resection. The methods used in this study have potential significant value for the surgical planning process for the liver and other vascular territories.
Key Terms: Portal hemodynamics, Living Donor Liver Transplantation, Computational Fluid Dynamics, Virtual Surgery, 4D Flow MRI
1. Introduction
Liver transplantation is a successful and definitive treatment for patients with liver failure. However, over the last two decades, there has been a short supply of organs from deceased donors. This shortage has motivated the implementation of living donor liver transplantation (LDLT), a therapy that has produced results comparable to traditional cadaveric liver transplantation.[25],[12] In this procedure, a portion of the liver is resected from a living donor and transplanted into a patient with liver failure.[3] In both the donor and the recipient, the liver tissue can regenerate up to around 80 and 90 percent of its original size, respectively, after the procedure.[18] However, the central vasculature of the liver cannot regenerate, and therefore the same amount of blood volume must flow through a smaller vascular bed, inevitably leading to higher resistance to blood flow. Such changes in hepatic resistance have been shown to have a role in the liver regeneration process.[25] However, the increased resistance also has the potential to induce hyperperfusion and pre-sinusoidal portal hypertension, which can lead to early graft dysfunction and tissue damage due to elevated pressure and wall shear stress.[22],[23]
The post-transplant health and safety of the donor is of paramount importance, and therefore the effects of LDLT on the living donor are monitored with in vivo imaging and functional biomarker testing after the procedure has taken place.[17],[8] However, the hemodynamic alterations due to mechanical changes in the vasculature of the liver have not yet been thoroughly examined. A proper understanding of the mechanical effects of LDLT, such as pressure and wall shear stress alterations, may give further insight into the function of the remaining graft and also allow for enhanced preoperative planning.[5],[6] Nevertheless, these parameters are difficult to obtain and predict in vivo. Therefore, researchers have turned to numerical and experimental techniques in an attempt to predict the changes in these parameters due to a surgical procedure, such as LDLT. Hwang et al used numerical simulation, an experimental fluid dynamics model, and medical imaging to develop surgical methods for right hepatic vein reconstruction in living liver donors.[9] C-M Ho et al used CT imaging, sonographic measurements, and computer simulation to predict changes in a portal vein aneurysm after a right lobectomy. Results of the study were used to determine the eligibility of the subject for liver donation.[5] Later, the same group examined the hemodynamic alterations in a right lobectomy using three models of the portal vein. The models were derived by performing a “virtual surgery” that mimicked the in vivo surgical procedure.[6] In a similar “virtual surgery” study, H Ho et al employed a 0D resistance circuit analyses and 3D modeling technique to examine flow, stress, and pressure changes in the left portal vein and surrounding vasculature after a right lobe hepatectomy.[7] Lastly, Li et al used numerical simulation and physical model experiments to examine the hemodynamic effects of portal vein hypertension in hepatic cirrhosis patients.[14]
The primary purpose of this study was to develop a methodology that provides further insight into the hemodynamic alterations of LDLT through computational models that consider patient specific flow conditions and hepatic vasculature expansion approximations from medical imaging. To do this, 4D Flow MRI, vascular strain values from a meal challenge study, computational fluid dynamics (CFD) simulations, and virtual surgery techniques were used in living donor portal venous models. A secondary goal of this study was to develop an in vitro experimental procedure that can be used to validate and complement medical imaging and computational simulation results.
2. Materials and Methods
Human subjects
In this Institutional Review Board approved and Health Insurance Portability and Accountability Act - compliant study, three healthy subjects with no known liver disease being evaluated for liver donation were recruited. Written informed consent was obtained prior to inclusion. Two of the donors underwent a right hepatectomy (cases 1 and 2), and the third underwent a left lateral hepatectomy (case 3).
MR Imaging
The study was conducted on a clinical 3T scanner (Discovery MR 750, GE Healthcare, Waukesha, WI) with a 32-chanel body coil (NeoCoil, Pewaukee, WI). 4D velocity mapping was achieved using a cardiac-gated time-resolved 3D radially undersampled phase contrast (PC) acquisition (5-point PC-VIPR)[11] with increased velocity sensitivity performance.[4],[11] Acquisition parameters included: imaging volume: 32×32×24cm excitation with spherical encoding, 1.25mm acquired isotropic spatial resolution, TR/TE=6.4/2.2ms. Imaging was performed at the conclusion of a clinical MRI exam aimed at evaluating the liver and bile ducts for variant anatomy. The subjects received 0.05 mmol/kg of gadoxetic acid (Eovist, Bayer Healthcare, Wayne, NJ) approximately 20 minutes prior to 4D flow MRI. All imaging was repeated 14 days after surgery. Pre- and post-surgery 4D flow MR imaging protocols were identical.
4D flow MRI Data Analysis
Data were reconstructed to 14 time frames per cardiac cycle. Phase offsets for Maxwell terms and eddy currents were corrected automatically during reconstruction.[1],[24] The eddy current correction was performed using 2nd order polynomial fitting of background tissue segmented based on thresholding of an angiogram.[24] Velocity-weighted angiograms were calculated from the final velocity and magnitude data for all 14 time frames.[10] Liver vasculature was segmented from PC angiograms using MIMICS (Materialise, Leuven, Belgium) by selecting a threshold level to delineate the fluid flow boundaries. Due to the use of contrast agent during imaging, the signal to noise ratio was improved and the boundaries were well defined. Therefore, no significant difference was seen between the segmented mask of two observers. The segmented vasculature for case 1 is shown in Figure 1. After segmentation, Ensight (CEI, Apex, NC) was used to place cut-planes manually in the splenic vein (SV), superior mesenteric vein (SMV), and the left (LPV), right (RPV), and main portal veins (PV), where flow measurements were made from 4D flow MRI data.[10]
Figure 1.
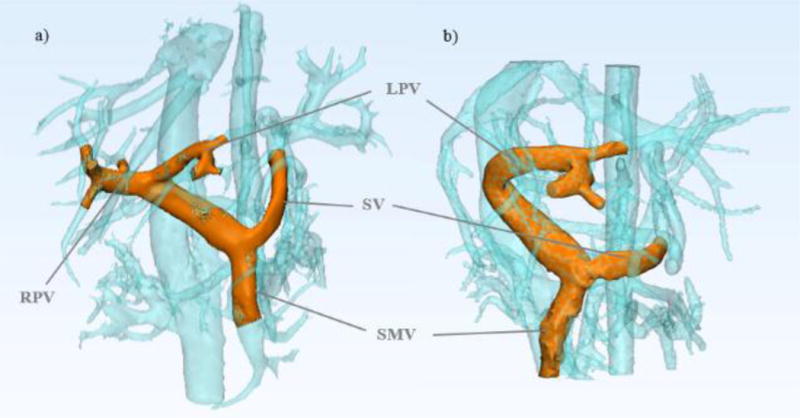
4D flow MRI can be used to depict in vivo anatomy before and after partial hepatectomy in healthy living donors. The models shown were created from MR image data for a) Pre-surgery donor 1 portal vasculature and b) Post-surgery donor 1 portal vasculature.
Meal Challenge for Vessel Strain Determination
In a previous study, a meal challenge was performed in a group of 6 healthy volunteers.[19] A MR scan (“pre”) was performed after at least 5 hours of fasting. After the first scan, subjects ingested 574mL EnSure Plus® (Abbott Laboratories, Columbus, OH; 700cal, 28% from fat, 57% from carbohydrates).[13],[16],[21] A second MR scan (“post”) was repeated 20 minutes after the meal ingestion. These data were reanalyzed and flow and cross sectional areas were measured in the main, left and right portal veins before and after the meal. The average strain of the vessels was calculated based on the change in cross-sectional area in response to the meal. Table 1 shows the results of the strain analysis.
Table 1.
The change in portal vein area and corresponding strain for meal challenge subjects.
| Subject | 1 | 2 | 3 | 4 | 5 | 6 | 7 | Average |
|---|---|---|---|---|---|---|---|---|
| Pre-Meal Area [mm2] | 142 | 42 | 69 | 104 | 136 | 115 | 90 | 100 |
| Post-Meal Area [mm2] | 175 | 55 | 146 | 181 | 182 | 168 | 95 | 143 |
| Strain [%] | 23 | 32 | 111 | 74 | 34 | 47 | 6 | 47 |
Virtual Surgery
In order to create models that could be used to predict the post-transplant splanchnic hemodynamics of the donors, a “virtual surgery” method with two steps was performed on the pre-surgery portal vein models using the design software 3-matic (Materialise, Leuven, Belgium). The first step involved virtually cutting the portal vein at the location of the in vivo surgical resection, that is, immediately distal the portal vein bifurcation. This produced the first predictive model, which is named “virtual resection” in this work. It is important to note that after resection of the right lobe of the liver, as seen in cases 1 and 2 of this study, the RPV is entirely absent, thus the only remaining path for flow is through the LPV. Conversely, after a left lateral resection (case 3), the LPV is absent, making the RPV the only path for flow. Therefore, the portal venous system of the donor must expand after resection to accommodate this increase in flow. In order to simulate this adaption, a second virtual surgery model was prepared that accounted for the expansion of the remaining branch (LPV in cases 1 and 2, and RPV in case 3). Due to the difficulty of obtaining in vivo vessel mechanical properties and the variability of these properties between donors, the patient-specific vessel expansion is typically uncertain. Therefore, portal vein “strain” calculated from the change in cross-sectional area from the meal challenge was employed. In using these data, it was assumed that the change in vessel cross-sectional area in post-surgery adaptation of a healthy donor is similar to the change in vessel area due to increased splanchnic flow post-meal. Therefore, the average strain value from the meal challenge study was used to dilate the remaining branch on the virtual resection models. This produced the second predictive model, which was named “Virtual Dilation” in this study. The models created from this two-step virtual surgery process are shown in Figure 2 A.
Figure 2.
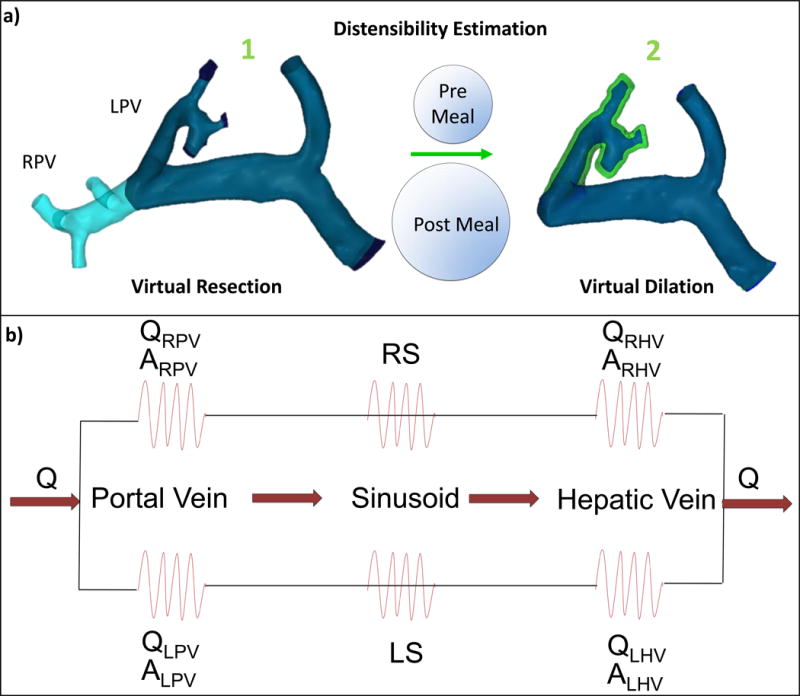
Schematic of the virtual surgery simulation and boundary condition determination for CFD. a) Portal vein models: before and after virtual right lobectomy (note dilated area shown in green simulating left portal vein (LPV) accommodation to change in flow). b) Resistance network based on 4D flow MRI measurements of flow, vessel area (hepatic veins (HVs) and PVs) and liver volume (sinusoids).
Computational Fluid Dynamics Simulations
The segmented in vivo pre-surgery model, virtual resection model, virtual dilation model, and in vivo post-surgery model for each patient were prepared for CFD mesh generation using 3-matic (Materialise, Leuven, Belgium). Tetrahedral meshes were then generated using ANSYS ICEM (Ansys, Inc. Cannonburg, PA, USA). The meshes were imported into Fluent (Ansys, inc Cannonburg, PA, USA), a software package that employs numerical methods to solve the governing equations of fluid flow. Inlet flow conditions were set for the SV and SMV inlets, whose values were obtained from the in vivo 4D flow MRI hemodynamic quantification from the pre-surgery donor scans. Outflow percentages were also set for all outlet boundaries based on the in vivo pre-surgery data. These percentages represent the flow patterns that develop due to the hepatic resistance to flow in the vasculature downstream of the portal vein, as portrayed in Figure 2 B. Note that boundary conditions were determined only with pre-surgery donor data, as this was readily available through the use of 4D flow MRI. Fluid structure interaction was not considered in the simulations, and no-slip conditions were set at the walls of the vessels. Blood, whose density was set at 1060 kg/m3, was treated as an incompressible fluid with a viscosity of 0.0035 kg/m-s.[2] A second order upwind method for momentum spatial discretization was used. Steady state simulations were run until numerical convergence, which was defined as the point when continuity and velocity residuals fell below 1×10⁻⁵. Final mesh density and quality were verified by iteratively increasing mesh complexity until there was no change observed in the quantitative results of the simulations. Fluid structure interaction was not considered for two reasons. First, wall motion through the cardiac cycle is minimal, due to the assumption that pulsatility of flow in the portal venous circulation is negligible[15]. Second, the patient specific mechanical properties and vessel wall thickness dimensions of the vessels that are required for FSI input are unknown. Alternately, the meal challenge data was used to predict the patient specific wall expansion based on the increase in size of the fluid region from medical imaging, as previously described.
In Vitro Experiments
The segmented donor 1 pre- and post-surgery liver models were prepared for in vitro flow experiments by virtually fixing tube connectors to all inlet and outlet openings, using the design software 3-matic (Materialise, Leuven, Belgium). The 3D geometries were then exported and used to fabricate physical models using powder bed fusion, an additive manufacturing method that employs a laser to melt polymer particles into the desired shape, layer by layer. The powder bed fusion equipment (DTM Sinterstation 2500CI ATC, 3D Systems, Inc., Rock Hill, SC, USA) set-up included 12 W laser power, 0.15mm scan spacing, 5080 mm/s beam speed, and nylon 11 powder.
The printed models (Figure 3) were connected to a perfusion pump (Stockert SIII Heart-Lung Machine) using surgical tubing. Water was pumped through the model system at steady rates of 1 and 2 liters per minute to simulate physiological flow, and flow measurements were recorded at each inlet and outlet vessel using a flow probe (Transonic PXL Flowsensor). The in vitro set-up was then taken to a clinical 3T scanner (Discovery MR 750, GE Healthcare, Waukesha, WI), where the model and tubing were set on the scanner bed. In this set-up, the model was fixed in a polypropylene container and surrounded by solidified agar to minimize noise in the MR image data. The tubing was again connected to the perfusion pump, which remained outside of the scanner magnetic field in the MR control room. This set-up is shown in Figure 4. Flow experiments were then conducted at water flow rates of 1 and 2 liters per minute, simultaneously with MR scanning procedures. The 4D Flow MR data were then analyzed using cut planes in Ensight (CEI, Apex, NC).
Figure 3.
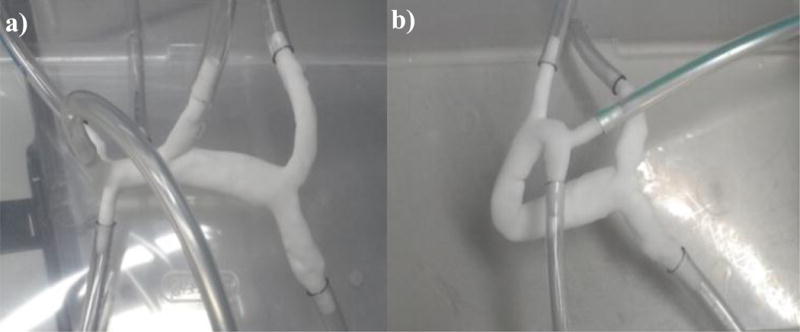
Experimental models created by powder bed fusion a) Pre-surgery donor 1 portal vein model and b) Post-surgery donor 1 portal vein model.
Figure 4.
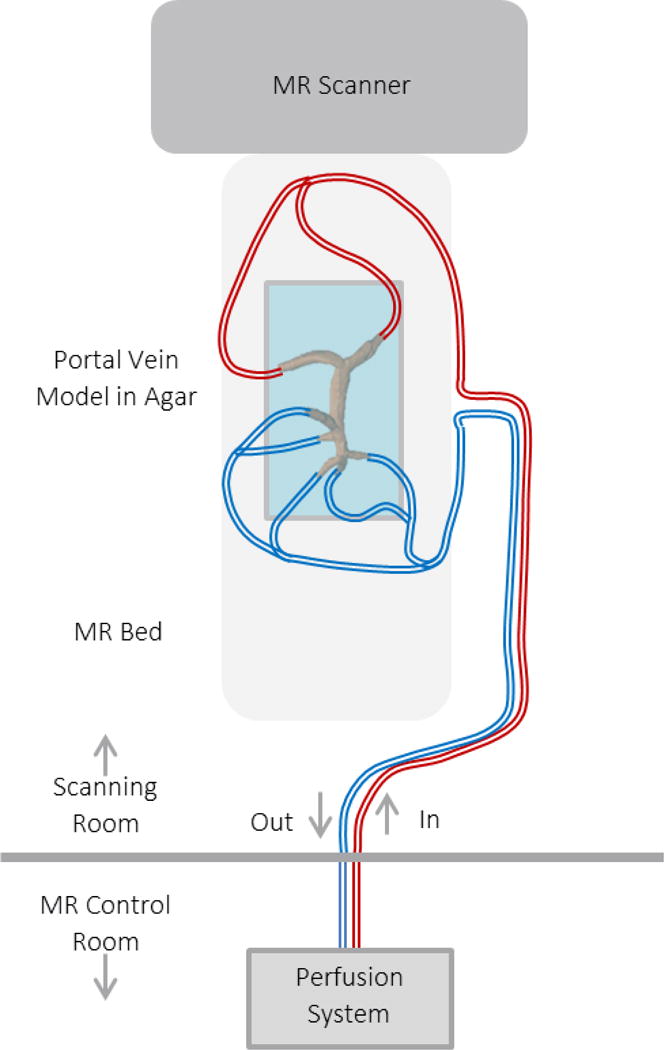
Physical model experiments can be used to compare physical flow measurements with those obtained through 4D MRI. In the set-up shown, the physical model is connected to a flow loop with a perfusion system that is located outside of the MR scanning room. Experiments are then conducted and flow is recorded with the MR scanning procedure.
The models were also used to again perform computational fluid dynamics simulations using the commercial software FLUENT (ANSYS). The inlet and outlet boundary locations matched the locations on the physical experimental models. Experimentally determined inlet flow rates and outflow percentages were imposed at the inlet and outlet boundaries, respectively. The simulation flow results were recorded and compared with flow probe and 4D flow measurements at the same experimental flow rates with a 2-sided t-test with p<0.05 indicating a statistical difference in flow.
3. Results
The in vivo donor imaging and flow quantification results are shown in Table 2. Note that in cases 1 and 2, the right portal vein was resected during surgery, thus post-surgery flow values for this vessel are non-existent and all flow is directed through the left portal vein, where flow is shown to increase significantly post-surgery. Likewise, case 3 results display no flow through the left portal vein branch, as it was resected during left lateral lobectomy. Despite this change, the ratio of superior mesenteric vein to splenic vein flow remained the same after surgery in donor 1 However, the SMV to SV flow ratios for donors 2 and 3 did change from pre to post surgery scans.
Table 2.
In-vivo 4D Flow MRI portal flow quantification for a LDLT donor.
| Vessel | PV | SA | SV | HA | SMV | RPV | LPV |
|---|---|---|---|---|---|---|---|
| Pre-Surgery Flow (ml/min) | 1004 | 168 | 412 | 21 | 592 | 810 | 167 |
| Post-Surgery Flow (ml/min) | 1231 | 303 | 521 | 44 | 754 | n/a | 1210 |
Table 3 provides the results used to evaluate the ability of CFD simulation to replicate flow values recorded in vivo. This table displays this comparison for case 1. Note that the SV and SMV flow rates are similar between methods due to the fact that in vivo pre-surgery flow rates were used as inlet boundary conditions in the CFD model. The remaining vessel flow rates show strong agreement between 4D flow MRI and CFD data. A visual streamline comparison between these two methods is shown in Figure 5.
Table 3.
Venous pre-surgery flow rates obtained by in-vivo 4D flow MRI and CFD simulation.
| Vessel | PV | SV | SMV | RPV | LPV | RPV Outflow % | LPV Outflow % |
|---|---|---|---|---|---|---|---|
| In-Vivo Flow (ml/min) | 1003.5 | 411.7 | 591.8 | 810.3 | 167.4 | 82.9% | 17.1% |
| CFD Flow (ml/min) | 1003.2 | 411.6 | 591.6 | 832.7 | 170.5 | 83.0% | 17.0% |
Figure 5.
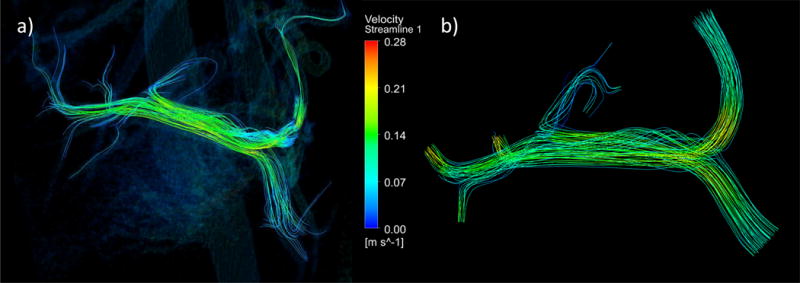
4D flow MRI and computational fluid dynamics demonstrate comparable streamline depiction of flow in the portal circulation. a) Pre-surgery donor 1 in-vivo 4D flow MRI streamlines and b) Pre-surgery donor 1 model computational fluid dynamics simulation streamlines.
Figures 6, 7, and 8 show the CFD simulation velocity streamlines, pressure contours, and wall shear stress contours in all four models of cases 1, 2, and 3, respectively. Additionally, Table 4 presents relevant quantitative results of the simulations. In observation of the results from case 1, as seen in Figure 6, there is a greater fluid velocity in the post- and virtual surgery models than in the pre-surgery model, particularly in the distal end of the portal vein. Furthermore, the greatest velocity magnitudes are seen in the virtual resection model (Fig. 6b), specifically in the LPV branch, as supported by the velocity results in Table 4. Similarly, the pressure and shear stress in the virtual resection model appears to be much greater than in the pre-surgery and dilated models, as seen in Figure 6b. The quantitative results from Table 4 support the occurrence of this pressure increase from the pre-surgery model to virtual and post-surgery models. Another relevant result in this table is the wall shear stress values, which are greatest in the virtual resection model, and lowest in the pre-surgery model. A more comprehensive view of the case 1 results reveals that the virtual dilation model produced velocity, pressure, and shear stress results more similar to the actual post-surgery model than did the virtual resection model.
Figure 6.
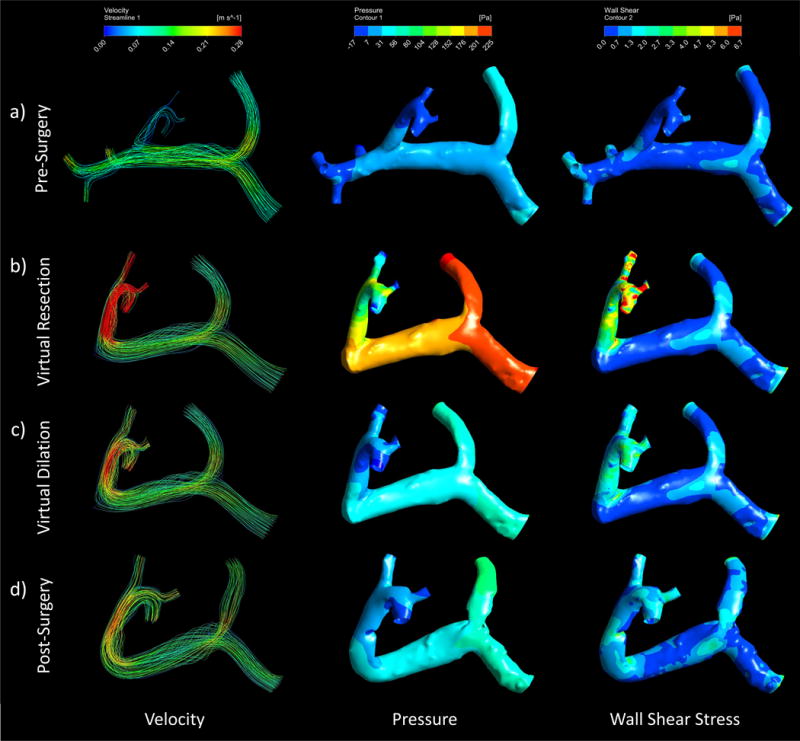
Computational fluid dynamics can be used to simulate pre and post-surgery portal velocity, pressure, and wall shear stress and depict the flow path, pressure, and stress distributions through streamlines and contours. These depictions can be seen in the Case 1 (right lobe resection) a) pre-surgery b) virtual resection c) virtual dilation, and d) post-surgery models.
Figure 7.
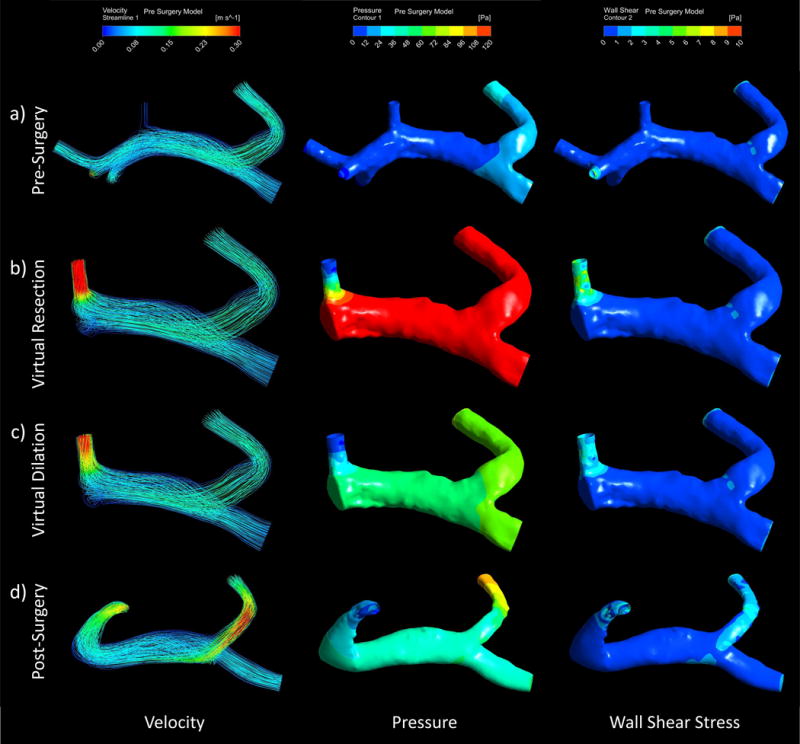
Computational fluid dynamics can be used to simulate pre and post-surgery portal velocity, pressure, and wall shear stress and depict the flow path, pressure, and stress distributions through streamlines and contours. These depictions can be seen in the Case 2 (right lobe resection) a) pre-surgery b) virtual resection c) virtual dilation, and d) post-surgery models
Figure 8.
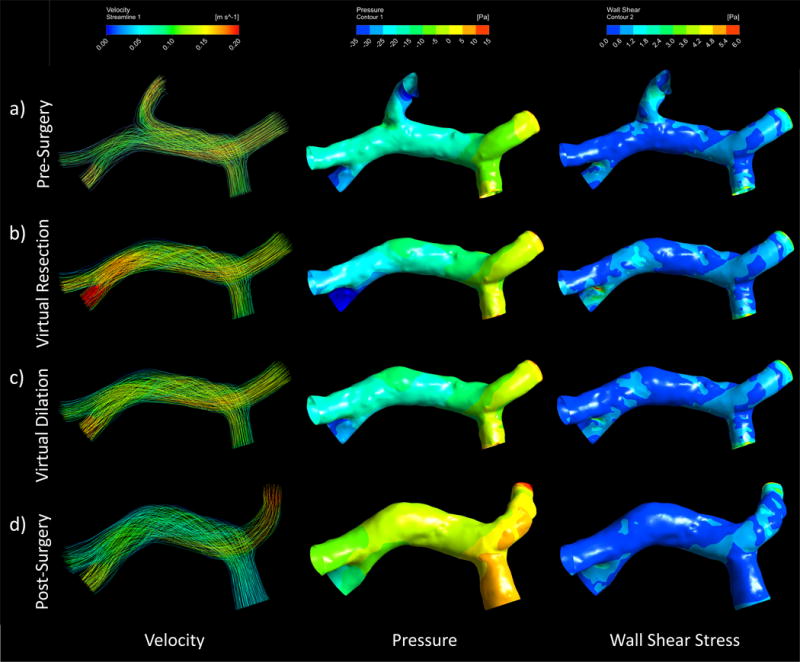
Computational fluid dynamics can be used to simulate pre and post-surgery portal velocity, pressure, and wall shear stress and depict the flow path, pressure, and stress distributions through streamlines and contours. These depictions can be seen in the Case 3 (left lobe resection) a) pre-surgery b) virtual resection c) virtual dilation, and d) post-surgery models
Table 4.
CFD simulation results for pre-, post-, and virtual surgery models. **Outlets 1, 2, and 3 refer to the outlet vessels as labeled in Figure 5 b).
| Pre-Surgery | Post-Surgery | Virtual - No Dilation | Virtual - With Dilation | |
|---|---|---|---|---|
| SV Flow [ml/min] | 411.6 | 411.6 | 411.6 | 411.6 |
| SV Max Velocity [m/s] | 0.08 | 0.12 | 0.08 | 0.08 |
| SMV Flow [ml/min] | 591.6 | 591.6 | 591.6 | 591.6 |
| SMV Max Velocity [m/s] | 0.09 | 0.10 | 0.09 | 0.09 |
| Outlet 1 Flow [ml/min] | 90.3 | 541.7 | 541.7 | 541.7 |
| Outlet 1 Max Velocity [m/s] | 0.10 | 0.25 | 0.60 | 0.30 |
| Outlet 2 Flow [ml/min] | 40.1 | 220.7 | 220.7 | 220.7 |
| Outlet 2 Max Velocity [m/s] | 0.13 | 0.26 | 0.55 | 0.26 |
| Outlet 3 Flow [ml/min] | 40.1 | 240.8 | 240.8 | 240.8 |
| Outlet 3 Max Velocity [m/s] | 0.09 | 0.24 | 0.53 | 0.24 |
| Maximum Pressure [Pa] | 53.5 | 105.3 | 265.1 | 111.1 |
| Maximum Wall Shear Stress [Pa] | 4.4 | 6.7 | 17.6 | 7.8 |
The simulation results of case 2 also displayed a trend of increased velocity, pressure, and wall shear stress throughout the portal system models when comparing virtual and post-surgery models to the pre-surgery model, as seen in Figure 7. Table 4 reinforces this trend, particularly in results seen in the remaining outlet branch. Similarly to case 1, the highest pressure and velocities are seen in the virtual resection model (Figure 7b). However, the results from this case showed that pressure in the remaining branch and average wall shear stress remained elevated in the post-surgery model relative to pre-surgery model results.
The results of the simulations conducted on the case 3 models displayed a trend of increased velocity and pressure when comparing virtual surgery models to pre-surgery, but a decrease in these parameters when observing the post-surgery model. Furthermore, the differences observed in this model were small, as seen through the appearance of similar gradients across models in Figure 8.
Lastly, Tables 5 and 6 present a summary of the quantitative results of the in vitro experiments and corresponding simulations, and Figure 9 displays a qualitative representation of the flow streamlines from the in vitro 4D flow experiments. There was no significant difference observed between flow measurements obtained through CFD simulation and flow probe experiments (p=0.201), and between 4D flow and flow probe experiments (p=0.068).
Table 5.
Flow measurements in the pre-surgery in vitro model at experiments run at 1 and 2 L/min. Vessel numbers denote the vessel locations shown in Figure 9a.
| Pre-Surgery Model | |||
|---|---|---|---|
| 1 L/min | |||
| Vessel | Volume Flow Rate (L/min) | ||
| 4D Flow | CFD | Flow Probe | |
| 1 | 0.533 | 0.452 | 0.452 |
| 2 | 0.470 | 0.451 | 0.451 |
| 3 | 0.447 | 0.444 | 0.475 |
| 4 | 0.143 | 0.116 | 0.123 |
| 5 | 0.109 | 0.116 | 0.121 |
| 6 | 0.084 | 0.125 | 0.135 |
| 7 | 0.135 | 0.098 | 0.102 |
| 2 L/min | |||
| 1 | 1.055 | 0.940 | 0.940 |
| 2 | 0.949 | 0.860 | 0.860 |
| 3 | 0.920 | 0.913 | 0.920 |
| 4 | 0.288 | 0.234 | 0.240 |
| 5 | 0.242 | 0.234 | 0.250 |
| 6 | 0.153 | 0.234 | 0.250 |
| 7 | 0.283 | 0.216 | 0.230 |
Table 6.
Flow measurements in the post-surgery in vitro model run at 1 and 2 L/min. Vessel numbers denote the vessel locations shown in Figure 9b.
| Post-Surgery Model | |||
|---|---|---|---|
| Vessel | Volume Flow Rate (L/min) | ||
| 4D Flow | CFD | Flow Probe | |
| 1L/min | |||
| 1 | 0.467 | 0.470 | 0.470 |
| 2 | 0.449 | 0.460 | 0.460 |
| 3 | 0.341 | 0.374 | 0.370 |
| 4 | 0.283 | 0.273 | 0.270 |
| 5 | 0.282 | 0.283 | 0.280 |
| 2 L/min | |||
| 1 | 1.027 | 0.970 | 0.970 |
| 2 | 0.948 | 0.910 | 0.910 |
| 3 | 0.742 | 0.756 | 0.740 |
| 4 | 0.591 | 0.552 | 0.540 |
| 5 | 0.626 | 0.572 | 0.560 |
Figure 9.
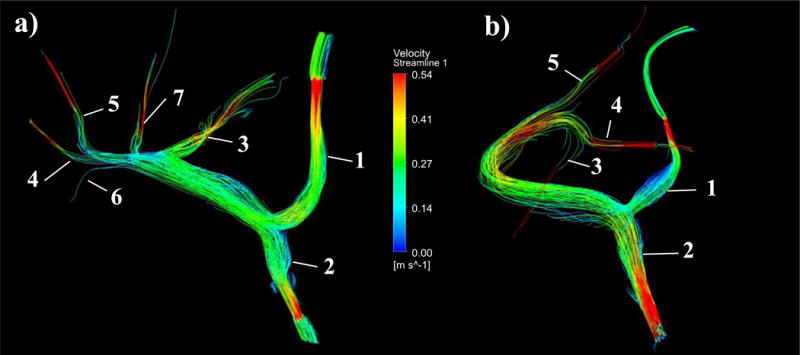
Flow through in vitro experimental models can be recorded using 4D flow MRI scanning procedures. a) Pre-surgery and b) Post-surgery experimental velocity streamlines obtained through 4D Flow MR imaging of an experimental flow rate of 2L/min. Vessel numbers are denoted on each model, corresponding to their assignment in Table 5 and Table 6.
4. Discussion
Living donor liver transplant has been a successful treatment for liver failure. However, the health and safety of the donor post-transplant is of paramount importance, and there remains insufficient data. Given the difficulty of assessing in vivo liver function and the inability to predict how a specific procedure will alter liver hemodynamics, further work is needed. To facilitate this work, development of new and improved methodologies for individualized prediction of outcomes is needed. This study employed 4D MRI in vivo flow analysis, computational fluid dynamics simulations, a virtual surgery technique that accounts for venous adaptation to increased flow, and in vitro experiments to address this unmet need.
In the first two transplant cases examined in this study, the right lobe of the liver was resected, eliminating the RPV branch. In the third case, the left lateral lobe of the donor liver was resected, which eliminated the LPV branch. The in vivo results of table 2 display the consequences of these resections by showing an increase in fluid velocity and mass flow throughout the portal vein. These results were expected due to the decrease in total portal vein volume and elimination of one of the flow paths at the portal bifurcation due to surgery.
4D flow MRI results on pre and post-surgery models can give insight into the hemodynamic alterations that occur due to surgical resection, as was just discussed. However, because such imaging alone cannot predict what will occur before a surgery happens, we employed computer simulation to aid in these predictions. To show that CFD simulation can provide an accurate analysis of hemodynamics in this situation, a comparison was made between the in vivo pre-surgery flow rates obtained from 4D flow MRI data, and the flow rates obtained through CFD simulation of the donor 1 pre-surgery model, as shown in Table 3. Through this comparison, it was observed that flow rate data were in good agreement between the two methods. This is further supported through examination of the resulting percentage of outflow to each portal vein branch, which varied by less than one percent between in vivo and CFD methods for this case. Furthermore, the velocity streamline comparison in Figure 3 shows good flow path agreement between the two methods. In particular, the CFD simulation streamlines are shown to replicate the helicity seen in the anatomical left side of the main portal vein.
The agreement of 4D flow MRI and computational simulation is promising. However, neither of these methods measure real fluid flow directly. Therefore, the results of these methods should be compared with a method that is based on physical phenomena that can be directly measured. To do this, a series of in vitro experiments were conducted on physical models representing the in vivo anatomy. The results showed that there was no significant difference between inlet and outlet flows measurements produced by 4D flow and experiment, and between simulation and experiment.
With confidence in the ability of CFD simulation to produce insightful results given the correct boundary conditions, the virtual surgery and post-surgery hemodynamic alterations were examined. Through observation of table 4, an increase is seen in all hemodynamic parameters in the virtual and post-surgery models compared to the pre-surgery model, in cases 1 and 2. This is best represented by comparing the average pressure and wall shear stress results, which are highest in virtual and post-surgery models. It is important to note that the pressure and shear stress values are relative, as the absolute values depend on in vivo pressure measurements that were not considered in these models. Nonetheless, these relative values represent a clear trend of increased post-surgery wall shear stress and pressure due to the overall increase in portal flow. This may indicate the potential development of portal hypertension.
A comparison of the CFD results between the two virtual surgery models (dilation vs. resection) can provide further insight into the hemodynamics of the portal venous system after transplant. As seen in the streamlines of the virtual resection models in Figures 6b, 7b, and 8b, the remaining branch flow path experiences a large increase in velocity. Furthermore, there is an increase in pressure throughout the resection models compared to pre-surgery model results. Additionally, Table 4 shows that the velocities, stresses, and pressures are lower in the dilation models than in the resection models. To clarify, the virtual resection model was intended to represent the portal venous flow directly after surgery, without any adaptive expansion. This model can also represent the portal vein of a donor with very stiff vasculature, which does not adapt well to an increase in flow. If the vasculature does not expand, the pressure throughout the portal system can increase by a relatively large amount. If the vessel does expand, as we see in the results of the meal challenge on healthy subjects, we can expect a drop in the velocity, pressure and stress as seen in the virtual dilation model results. The altered post-surgery hemodynamic parameters, such as increased pressure (portal hypertension) may even have a role in the long-term liver regeneration and vessel expansion process, as it has been hypothesized in literature.[25] However, it is important to note that pressure, wall shear, and velocity are still elevated in the virtual dilation model and the actual post-surgery model, which suggests that some degree of long-term portal hypertension will persist.
Lastly, a comparison was made between the two virtual surgery model results and the actual post-surgery model results. First, the velocity, pressure, and stress values are much higher in the virtual resection model than in the post-surgery model. This is expected, as the resection model has less distal volume and outlet area, because the vein has not expanded. However, through observation of the simulation results of the virtual dilation models, which were altered based on meal challenge results, we see much closer prediction of the actual post-surgery flow conditions in cases 1 and 2. For example, Table 4 shows that the outlet velocity, maximum pressure, and maximum shear stress values of the dilation models of case 1 and case 2 exhibit much closer agreement to the respective values of the actual post-surgery models. This suggests that a predictive manual adaptation of the post-surgery vessel may produce models that better predict post-surgery hemodynamics than a model that only considers the surgical resection. Additionally, this method can be used to predict how much a donor vessel may or may not expand, and examine the consequences of the magnitude of their individual vessel expansion on the hemodynamic outcome of the procedure. Therefore, the method proposed here allows for patient-specific prediction of vessel expansion post-surgery if a meal challenge had been conducted prior to partial hepatectomy.
It is important to note that although the velocity trend across all four case 3 simulation models was consistent with that seen in cases 1 and 2, the post-surgery pressure and stress trends were not consistent. As seen in table 4, the post-surgery model of case 3 has the lowest maximum branch pressure, average venous pressure, and average wall shear stress, even lower than the values of the corresponding pre-surgery model. This difference may be due to the fact that case 3 involved a left lateral resection, instead of a right lobectomy as in cases 1 and 2. If this is the true, it may indicate that a left lateral resection leads to a noticeably different hemodynamic alteration after surgery than in a right lobe resection. Further study is needed to determine the cause of this difference.
Several improvements to this study merit consideration. First of all, the recruitment and study of more subjects is needed before any definitive conclusions about this method can be determined. With the addition of more cases in future work, we will look to develop metrics that can be used to predict relevant clinical outcomes based on quantitative features of simulation results. Second, the addition of a more robust method of model creation and vessel shape determination may instill more confidence in the results obtained through computational simulation. One way to improve on the accuracy of these predictions based on the changing shape of the vessel would be to implement a statistical shape analysis method as described in recent cardiovascular work.[26, 27] Another potential improvement would be the implementation of a method that could provide reference values for physiologic pressure and shear stress in the hepatic vasculature of the donors under study. In this study, in vivo pressure was not quantified, and therefore only a comparison of the relative increase in pressure could be made from the CFD simulation data. Future work will look to implement in vitro experimental pressure measurements that may provide the first steps in validation of absolute pressure measurements obtained through imaging and simulation. Further development of experimental methods will also improve the accuracy and validity of boundary conditions that are implemented in the simulations models.
5. Conclusion
Through this study, a patient specific surgical planning method was developed that quantified post-surgery hemodynamic changes that occurred in three liver donors. The portal fluid flow, velocity, pressure, and wall shear stress quantities and their visual representations were provided so that a comparison could be made between pre-surgery, virtual surgery, and post- surgery anatomical configurations. Furthermore, the addition of in vivo portal expansion data provided a method to better predict the patient specific response to increased post-surgery flow. Additionally, the use of 4D flow MRI provided a source for simulation boundary conditions and a standard by which numerical flow simulations could be compared. Lastly, an in vitro experimental method was developed that can be used to provide a reference for results obtained through imaging and simulation.
The capability to predict the hemodynamic changes induced by a surgery before it occurs may be of great value in the surgical planning process. In future studies, the methods described here will be further developed and expanded to more cases so that more insight may be gained on their validity and utility.
Acknowledgments
The authors also wish to acknowledge support from the NIH (UL1TR000427, TL1TR000429, R01 DK096169, K24 DK102595), as well GE Healthcare and Bracco Diagnostics who provide research support to the University of Wisconsin.
Footnotes
Conflict of Interest Statement
The authors state that there are no conflicts of interest related to this research study.
References
- 1.Bernstein MA, Zhou XJ, Polzin JA, King KF, Ganin A, Pelc NJ, Glover GH. Concomitant gradient terms in phase contrast MR: Analysis and Correction. Magnetic Resonance in Medicine Magn Reson Med. 1998;39.2:300–08. doi: 10.1002/mrm.1910390218. [DOI] [PubMed] [Google Scholar]
- 2.Chiastra C, Morlacchi S, Pereira S, Dubini G, Migliavacca F. Computational fluid dynamics of stented coronary bifurcations studied with a hybrid discretization method. European Journal of Mechanics - B/Fluids. 2012;35:76–84. [Google Scholar]
- 3.Everson GT, Hoefs JC, Niemann CU, Olthoff KM, Dupuis R, Lauriski S, Herman A, Milne N, Gillespie B, Goodrich NP, Everhart JE. Functional elements associated with hepatic regeneration in living donors after right hepatic lobectomy. Liver Transpl Liver Transplantation. 2013;19.3:292–304. doi: 10.1002/lt.23592. [DOI] [PMC free article] [PubMed] [Google Scholar]
- 4.Gu T, Korosec FR, Block WF, et al. PC VIPR: a high-speed 3D phasecontrast method for flow quantification and high-resolution angiography. AJNR Am J Neuroradiol. 2005;26:743–749. [PMC free article] [PubMed] [Google Scholar]
- 5.Ho CM, Tsai SF, Lin RK, Liang PC, Sheu TWH, Hu RH, Lee PH. Computer simulation of hemodynamic changes after right lobectomy in a liver with intrahepatic portal vein aneurysm. Journal of the Formosan Medical Association. 2007;106.8:617–23. doi: 10.1016/S0929-6646(08)60018-2. [DOI] [PubMed] [Google Scholar]
- 6.Ho CM, Lin RK, Tsai SF, Hu RH, Liang PC, Sheu Tony WH, Lee PH. Simulation of portal hemodynamic changes in a donor after right hepatectomy. Journal of Biomechanical Engineering J Biomech Eng. 2010;132.4:041002. doi: 10.1115/1.4000957. [DOI] [PubMed] [Google Scholar]
- 7.Ho H, Sorrell K, Bartlett A, Hunter P. Blood flow simulation for the liver after a virtual right lobe hepatectomy. Medical Image Computing and Computer-Assisted Intervention – MICCAI 2012 Lecture Notes in Computer Science. 2012:525–32. doi: 10.1007/978-3-642-33454-2_65. [DOI] [PubMed] [Google Scholar]
- 8.Hoekstra LT, De Graaf W, Nibourg GA, Heger M, Bennink RJ, Stieger B, Van Gulik TM. Physiological and biochemical basis of clinical liver function tests. Annals of Surgery. 2013;257.1:27–36. doi: 10.1097/SLA.0b013e31825d5d47. Web. [DOI] [PubMed] [Google Scholar]
- 9.Hwang S, Ha TY, Ahn CS, Moon DB. Hemodynamics-compliant reconstruction of the right hepatic vein for adult living donor liver transplantation with a right liver graft. Liver Transpl Liver Transplantation. 2012;18.7:858–66. doi: 10.1002/lt.23430. [DOI] [PubMed] [Google Scholar]
- 10.Johnson KM, Lum DP, Turski PA, Block WF, Mistretta CA, Wieben O. Improved 3D phase contrast MRI with off-resonance corrected dual echo VIPR. Magnetic Resonance in Medicine Magn Reson Med. 2008;60.6:1329–336. doi: 10.1002/mrm.21763. [DOI] [PMC free article] [PubMed] [Google Scholar]
- 11.Johnson KM, Wieben O, Samsonov AA. Phase-contrast velocimetry with simultaneous fat/water separation. Magnetic Resonance in Medicine Magn Reson Med. 2010;63.6:1564–574. doi: 10.1002/mrm.22355. [DOI] [PMC free article] [PubMed] [Google Scholar]
- 12.Kim PT, G T. Living donor liver transplantation in the USA. HepatoBiliary Surg Nutr. 2015 doi: 10.3978/j.issn.2304-3881.2015.06.01. [DOI] [PMC free article] [PubMed] [Google Scholar]
- 13.Li KC, Hopkins KL, Dalman RL, Song CK. Simultaneous measurement of flow in the superior mesenteric vein and artery with cine phase-contrast MR imaging: value in diagnosis of chronic mesenteric ischemia. work in progress. Radiology. 1995;194.2:327–30. doi: 10.1148/radiology.194.2.7824706. [DOI] [PubMed] [Google Scholar]
- 14.Li X, Wang Xk, Chen B, Pu Ys, Li Zf, Nie P, Su K. Computational hemodynamics of portal vein hypertension in hepatic cirrhosis patients. Bio-Medical Materials and Engineering BME. 2015;26.S1 doi: 10.3233/BME-151310. [DOI] [PubMed] [Google Scholar]
- 15.Middleton William D, Kurtz Alfred B, Hertzberg Barbara S, Kurtz Alfred B. Ultrasound: The Requisites. St Louis MO: Mosby; 2004. Print. [Google Scholar]
- 16.Lycklama À Nijeholt GJ, Burggraaf K, Njm Wasser Ma, Schultze Kool LJ, Schoemaker RC, Cohen AF, De Roos A. Variability of splanchnic blood flow measurements using MR velocity mapping under fasting and post-prandial conditions - comparison with echo-doppler. Journal of Hepatology. 1997;26.2:298–304. doi: 10.1016/s0168-8278(97)80045-1. [DOI] [PubMed] [Google Scholar]
- 17.Ninomiya M, Shirabe K, Kayashima H, Ikegami T, Nishie A, Harimoto N, Yamashita Y, Yoshizumi T, Uchiyama H, Maehara Y. Functional assessment of the liver with gadolinium-ethoxybenzyl-diethylenetriamine penta-acetate-enhanced MRI in living-donor liver transplantation. British Journal of Surgery Br J Surg. 2015;102.8:944–51. doi: 10.1002/bjs.9820. Web. [DOI] [PubMed] [Google Scholar]
- 18.Olthoff KM, Emond JC, Shearon TH, Everson G, Baker TB, Fisher RA, Freise CE, Gillespie BW, Everhart JE. Liver regeneration after living donor transplantation: adult-to-adult living donor liver transplantation cohort study. Liver Transpl Liver Transplantation. 2014;21.1:79–88. doi: 10.1002/lt.23966. [DOI] [PMC free article] [PubMed] [Google Scholar]
- 19.Roldán-Alzate A, Frydrychowicz A, Said A, Johnson KM, Francois CJ, Wieben O, Reeder SB. Impaired regulation of portal venous flow in response to a meal challenge as quantified by 4D Flow MRI. J Magn Reson Imaging Journal of Magnetic Resonance Imaging. 2015;42.4 doi: 10.1002/jmri.24886. [DOI] [PMC free article] [PubMed] [Google Scholar]
- 20.Roldán-Alzate A, García-Rodríguez S, Anagnostopoulos PV, Srinivasan S, Wieben O, François CJ. Hemodynamic study of TCPC using in vivo and in vitro 4D Flow MRI and numerical simulation. Journal of Biomechanics. 2015;48.7:1325–330. doi: 10.1016/j.jbiomech.2015.03.009. [DOI] [PMC free article] [PubMed] [Google Scholar]
- 21.Sidery MB, Macdonald IA, Blackshaw PE. Superior mesenteric artery blood flow and gastric emptying in humans and the differential effects of high fat and high carbohydrate meals. Gut. 1994;35.2:186–90. doi: 10.1136/gut.35.2.186. [DOI] [PMC free article] [PubMed] [Google Scholar]
- 22.Tong MS, Chai HT, Liu WH, Chen CL, Fu M, Lin YH, Lin CC, Chen SM, Hang CL. Prevalence of hypertension after living-donor liver transplantation: a prospective study. Transplantation Proceedings. 2015;47.2:445–50. doi: 10.1016/j.transproceed.2014.10.050. [DOI] [PubMed] [Google Scholar]
- 23.Vasavada BB, Chen C Long, Zakaria M. Portal flow is the main predictor of early graft dysfunction regardless of the grwr status in living donor liver transplantation – A Retrospective Analysis of 134 Patients. International Journal of Surgery. 2014;12.2:177–80. doi: 10.1016/j.ijsu.2013.12.006. [DOI] [PubMed] [Google Scholar]
- 24.Walker PG, Cranney GB, Scheidegger MB, Waseleski G, Pohost GM, Yoganathan AP. Semiautomated method for noise reduction and background phase error correction in mr phase velocity data. J Magn Reson Imaging Journal of Magnetic Resonance Imaging. 1993;3.3:521–30. doi: 10.1002/jmri.1880030315. [DOI] [PubMed] [Google Scholar]
- 25.Yagi S, Iida T, Taniguchi K. Impact of portal venous pressure on regeneration and graft damage after living-donor liver transplantation. Liver Transplantation. 2004;11.1:68–75. doi: 10.1002/lt.20317. [DOI] [PubMed] [Google Scholar]
- 26.Jia Wu, Brigham Katharine G, Simon Marc A, Brigham John C. An Implementation of Independent Component Analysis for 3D Statistical Shape Analysis. Biomedical Signal Processing and Control. 2014;13:345–56. [Google Scholar]
- 27.Jia Wu, Wang Yingqian, Simon Marc A, Brigham John C. A New Approach to Kinematic Feature Extraction from the Human Right Ventricle for Classification of Hypertension: A Feasibility Study. Physics in Medicine and Biology. 2012;57.23:7905–922. doi: 10.1088/0031-9155/57/23/7905. [DOI] [PubMed] [Google Scholar]


