

Abstract
Autoimmune hepatitis (AIH) is a rare disease characterized by an immune attack of the liver. This study consists of a comprehensive analysis of immune alterations related to AIH at diagnosis, and during remission phase under treatment. A total of 37 major lymphocyte populations were analyzed from the peripheral blood of new‐onset AIH patients (AIHn; n = 14), AIH patients with controlled disease (n = 11), and healthy subjects (n = 14). Liver biopsy analyses were performed to complete the blood phenotypic analysis. Four blood lymphocyte populations were significantly altered in AIHn patients at diagnosis compared with healthy subjects. Levels of mucosal‐associated invariant T cells (MAIT), Type 1/Type 17 helper (Th1/ Th17) cells, clusters of differentiation (CD4) T cells, and invariant natural killer T cells were decreased, whereas MAIT granzyme B+ (GrB) cells were increased. A trend toward an increase of CD8+CD161+GrB+ cells was also observed. These alterations were not restored with standard immunosuppressive treatments. In the liver of AIHn patients, CD4, forkhead box P3 (Foxp3), and MAIT cell markers were enriched in the portal tract, and CD8, CD161, and GrB markers were enriched in the hepatic lobule. During remission, the hepatic lobule was clear of infiltrating T cells, but residual CD4 and MAIT cells were found in the portal tract, where Foxp3 was decreased, as previously described. In vitro, MAIT cells were functionally altered in AIH patients. Ex vivo MAIT cell activity (GrB) was linked to severe fibrosis. Conclusion: Our work proposes a global view of the lymphocyte alterations from diagnosis to remission phase in AIH patients. The absence of blood immune homeostasis restoration and the persistence of a CD4 infiltrate in the liver under standard immunosuppression could form the basis of the high risk of relapse observed in AIH. (Hepatology Communications 2018; 00:000‐000)
Autoimmune hepatitis (AIH) is a rare disease with a mean incidence rate of 1.1 to 1.9 cases per 100,000 persons per year in Europe and may lead to cirrhosis and hepatic failure if untreated. It is characterized by an immune attack of the liver parenchyma, leading to active hepatitis, hypergammaglobulinemia, and production of autoantibodies. Type 1 AIH is the most common, characterized by the presence of at least one of the following auto‐antibodies: smooth muscle (SMA), antinuclear antigen (ANA), and/or soluble liver antigen (SLA)1, 2 antibodies. The standard treatment for AIH is a nonselective immunosuppression combining corticosteroid and azathioprine, inducing complete remission in 70% of patients within the first year.3, 4 It is recommended to try to discontinue this treatment after at least 2 years of complete remission.5 However, the management of treatment withdrawal is difficult, as a high number of patients quickly relapse afterward.6, 7 Better characterization of the immune response in AIH might be useful in predicting relapse after treatment withdrawal and in identifying new specific targets for alternative treatments.
Pathogenesis in AIH involves genetic susceptibilities, molecular mimicry events, and dysfunction of immunoregulatory mechanisms. The major immune characteristic of AIH is the presence of a marked clusters of differentiation (CD4) and CD8 T‐cell infiltrate involved in hepatocellular damage8; however, the precise molecular and cellular mechanisms are still not known. Although dysfunction of regulatory T cells (Tregs) is still debated,9, 10, 11, 12, 13, 14 recent studies have implicated other lymphocyte subsets, such as γδ T cells,15 follicular helper T cells (Tfh), and T helper 17 cells (Th17).16, 17, 18, 19 An exhaustive analysis of a large panel of major lymphocyte subsets might be useful in drawing a general picture of the immune alterations in AIH.
In the present work, we hypothesized that a pattern of multiple immunological features in patient blood is characteristic of AIH. The peripheral blood cell immunophenotyping of 37 lymphocyte subsets from patients with new‐onset AIH (AIHn) was compared with those from healthy subjects and from AIH patients with controlled disease (AIHc). In addition, the analysis was performed longitudinally on the AIHn group, at diagnosis and after 1 year of treatment. Concomitant assessment of immune alterations in pathologic liver tissue was also performed in a subgroup of AIHn patients. This work aimed to identify accurate immunological alterations to provide a better knowledge of the disease, to eventually help clinicians in their management of AIH therapy, and to uncover targets for new specific therapeutic options.
Methods
PATIENTS
A bio‐bank of samples from AIH patients has been initiated in Nantes University Hospital. Between 2015 and 2017, AIH patients were enrolled either at diagnosis prior to any treatment initiation, or during clinical follow‐up. All of the eligible patients signed a written informed consent prior to inclusion. The bio‐bank gathers blood and hepatic samples and is linked to a database compiling the clinical, laboratory, histological, and immunological findings for each patient. The diagnosis of AIH is made following clinical criteria combined with laboratory findings (elevated bilirubin, AST and ALT, or polyclonal hypergammaglobulinemia), immunological findings (presence of serum ANA and/or SMA, presence of anti‐LKM1 antibody or anti‐liver cytosol 1), and histological findings from the liver biopsy at diagnosis (interface hepatitis and histological features compatible with AIH). The diagnostic work‐up also rules out other causes of chronic liver diseases (active hepatitis B, C or E infection, assessment of daily alcohol intake, evidence of recent hepatotoxic drug intake, alpha‐1 antitrypsine deficiency).
From this cohort, 14 consecutive AIHn patients and 11 AIHc patients were included in the present study. All of the patients were diagnosed in Nantes University hospital. All AIH patients had a simplified diagnostic score superior or equal to 6 according to the simplified scoring system for AIH of the International Autoimmune Hepatitis Group,20 and had positive ANA and/or SMA, or anti‐SLA antibodies. None of them was seronegative or had anti‐LKM1 antibodies. Patients with overlap syndrome, primary sclerosing cholangitis, primary biliary cirrhosis, or positive antimitochondrial autoantibody titers were excluded. The control of the disease was defined biochemically by a normalization of the transaminases and the IgG levels, according to the most recent European clinical practice guidelines on AIH.5
All of the patients initially received a standard immunosuppressive treatment protocol with corticosteroids (0.5‐1 mg/kg). Azathioprine was added after 2 weeks (1‐2 mg/kg) and monitored according to the tolerance of the patient. Corticosteroid treatment was then tapered until withdrawal. All of the patients were screened for thiopurine S‐methyltransferase genotyping before azathioprine administration. The patient characteristics are provided in Table 1 and Supporting Table S1.
Table 1.
Clinical, Biological, and Histological Features of AIH Patients, and Demographic Features of the Control Group
| Healthy Subjects | New Onset AIH (AIHn) | Controlled AIH (AIHc) | 1‐Year Treatment AIH (AIHn; 1 year) | |
|---|---|---|---|---|
| Number of individuals | 14 | 14 | 11 | 8 |
| Patient age at sample (years) | 49 (22‐65) | 62 (17‐74) | 57 (43‐79) | 58 (17‐74) |
| Sex (female/male) | 7/7 | 8/6 | 9/2 | 4/4 |
| Months after diagnosis | — | 0 | 72 (12‐180) | 10 (6‐13) |
| Biological Tests a | ||||
| Alanine aminotransferase; ALT UI/L (0‐50) | — | 745 (53‐2005) | 23 (10‐39) | 43 (11‐143) |
| Aspartate aminotransferase; AST UI/L (0‐50) | — | 657 (41‐1353) | 26 (15‐46) | 45 (18‐98) |
| Immunoglobulin G g/L (7‐16) | — | 24 (14.4‐76) | 11 (9.3‐13.9) | 11 (9.6‐27.1) |
| Immunoglobulin A g/L (0.7‐4) | — | 4 (1.53‐10.26) | 2 (0.78‐2.08) | 2 (1‐4.96) |
| Autoantibodies (diag.) | ||||
| Positive ANA titer (> 1/80) | — | 13/14 | 11/11 | 7/8 |
| Positive SMA titer (> 1/80) | — | 13/14 | 7/11 | 7/8 |
| Positive SLA | — | 0/14 | 1/11 | 0/8 |
| Positive LKM1 antibody | — | 0/14 | 0/11 | 0/8 |
| Seronegative | — | 0/14 | 0/11 | 0/8 |
| Histology (diag.) | ||||
| Fibrosis score (METAVIR) | — | 2 (0‐4) | 2 (0‐4) | 2 (0‐4) |
| Cirrhosis | — | 2/14 | 2/11 | 2/8 |
| Treatments a | ||||
| Corticosteroid | — | — | — | 6/8 |
| Azathioprine | — | — | 6/11 | 7/8 |
| Mycophenolate mofetil | — | — | 3/11 | 1/8 |
| Ursodeoxycholic acid | — | — | 2/11 | 0/8 |
| None | — | 11/11 | 0/11 | 0/8 |
Values at the sample time.
Abbreviation: diag, values at diagnostic time point.
The AIHn patients were between 17 and 74 years old, ALT level ranged from 53 to 2005 UI/L, and IgG levels ranged from 14.4 to 76 g/L. Concerning the fibrosis stage according to the METAVIR score, six AIHn patients were F0 to F2 and seven were F3 to F4; one patient refused the biopsy and could not be scored. The AIHc patients were between 43 and 79 years old, ALT level ranged from 10 to 39 UI/L, and IgG levels ranged from 9.3 to 13.9 g/L. Eight AIHc patients at diagnosis were F0 to F2 and three were F3 to F4 according to the METAVIR score.
In the first group of AIHn patients (n = 14), analysis of peripheral blood mononuclear cells (PBMCs) and an immunohistochemical study of liver parenchyma (a subset of seven AIHn patients) were performed at the time of diagnosis, before receiving any immunosuppressive treatment. The PBMC analysis was also performed after 1 year of treatment for a subset of the AIHn patients (n = 8). In the second group of AIHc patients (n = 11), PBMCs were analyzed at a steady state of remission of the disease. A PBMC analysis was also performed on a third group of age‐matched healthy donors (n = 14). The study was approved by the local clinical research committee of the Nantes University Hospital.
PHENOTYPING OF PERIPHERAL BLOOD LYMPHOCYTES
The PBMCs from 60 mL of blood were isolated and frozen in fetal bovine serum. Thirty‐seven lymphocyte populations covering the major CD4, Treg, CD8, innate lymphoid cells, and B cell subsets described in the literature were studied (Fig. 1 and Table 2). For the lymphocyte analysis, PBMCs were stained using five panels of 10 labeled antibodies and analyzed on an LSR II flow cytometer using FACSDiva software (BD Biosciences). Surface and intracellular staining was performed using antibodies described in Supporting Table S2. Intracellular staining was performed after a fixation/permeabilization step with the eBioscience fixation/permeabilization kit, following the manufacturer's instructions.
Figure 1.
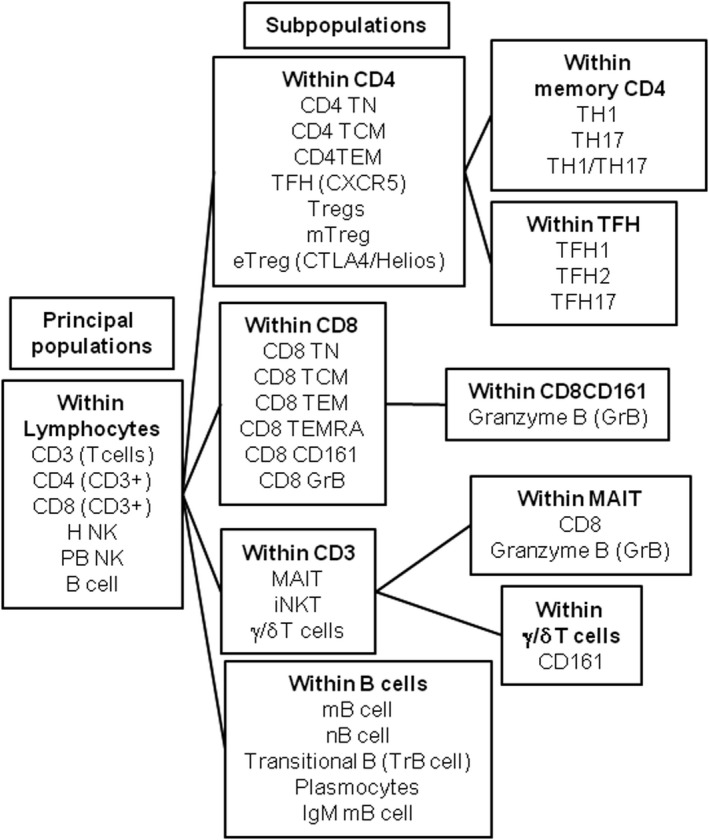
Schematic representation of the phenotyping analysis performed on peripheral blood samples of AIH patients.
Table 2.
Lymphocyte Population Panel Description
| Population Name | Full Name | Markers | |
|---|---|---|---|
| #1 | T cells | CD3+ | |
| #2 | CD4 T cells | CD3+CD4+CD8− | |
| #3 | Tregs | Regulatory CD4 T cells | CD3+CD4+CD8−CD25+CD127− |
| #4 | mTregs | Memory regulatory CD4 T cells | CD3+CD4+CD8−CD25+CD127−CD45RA−Foxp3+ |
| #5 | eTregs | Effector memory regulatory CD4 T cells | CD3+CD4+CD8−CD25+CD127−CD45RA−Foxp3+Helios+CTLA4+ |
| #6 | TFH | Folicular helper CD4 T cells | CD3+CD4+CD8−CD25− CD127+ CD45RA−CXCR5+ |
| #7 | TFH1 | Type 1 folicular helper CD4 T cells | CD3+CD4+CD8−CD25−CD127+ CD45RA−CXCR5+CXCR3+CCR6− |
| #8 | TFH2 | Type 2 folicular helper CD4 T cells | CD3+CD4+CD8−CD25−CD127+ CD45RA−CXCR5+CXCR3−CCR6− |
| #9 | TFH17 | Type 17 folicular helper CD4 T cells | CD3+CD4+CD8−CD25−CD127+ CD45RA−CXCR5+CXCR3−CCR6+ |
| #10 | TH1 CD4 | Type 1 helper memory CD4 T cells | CD3+CD4+CD8−CD25−CD127+ CD45RA−CXCR5−CXCR3+CCR6− |
| #11 | TH17 CD4 | Type 17 helper memory CD4 T cells | CD3+CD4+CD8−CD25−CD127+ CD45RA−CXCR5−CXCR3−CCR6+ |
| #12 | TH1/TH17 CD4 | Type 1/17 helper memory CD4 T cells | CD3+CD4+CD8−CD25−CD127+ CD45RA−CXCR5−CXCR3+CCR6+ |
| #13 | CD4 TN | Naive CD4 T cells | CD3+CD4+CD8−CD45RA+CCR7+ |
| #14 | CD4 TCM | Central memory CD4 T cells | CD3+CD4+CD8−CD45RA−CCR7+ |
| #15 | CD4 TEM | Effector memory CD4 T cells | CD3+CD4+CD8−CD45RA−CCR7− |
| #16 | CD8 T cells | CD3+CD4−CD8+Vα7.2− | |
| #17 | CD8 TN | Naive CD8 T cells | CD3+CD4−CD8+Vα7.2−CCR7+ CD45RA+ |
| #18 | CD8 TCM | Central memory CD8 T cells | CD3+CD4−CD8+Vα7.2−CCR7+ CD45RA− |
| #19 | CD8 TEM | Effector memory CD8 T cells | CD3+CD4−CD8+Vα7.2−CCR7−CD45RA− |
| #20 | CD8 TEMRA | Terminally differentiated memory CD8 T cells | CD3+CD4−CD8+Vα7.2−CCR7−CD45RA+ |
| #21 | CD8 GrB+ | Granzyme B+ CD8 T cells | CD3+CD4−CD8+Vα7.2−GrB+ |
| #22 | CD8 CD161+ | CD161+ CD8 T cells | CD3+CD4−CD8+Vα7.2−CD161+ |
| #23 | CD8 CD161+ GrB+ | CD161+ GrB+ CD8 T cells | CD3+CD4−CD8+Vα7.2−CD161+GrB+ |
| #24 | MAIT | Mucosal associated invariant T cells | CD3+Vα7.2+CD161+ |
| #25 | MAIT GrB+ | Granzyme B+ mucosal associated invariant T cells | CD3+Vα7.2+CD161+GrB+ |
| #26 | MAIT CD8+ | CD8+ mucosal associated invariant T cells | CD3+Vα7.2+CD161+CD8+ |
| #27 | iNKT | Invariant natural killer T cells | CD3+Vα24J18+Vδ2− |
| #28 | γ/δ 2 T | Gamma/delta T cells | CD3+Vα24J18−Vδ2+ |
| #29 | CD161+ γ/δ2 T | CD161+ gamma/delta T cells | CD3+Vα24J18−Vδ2+CD161+ |
| #30 | H−NK | Hepatic natural killer | CD3−CD56+CD16− |
| #31 | PB−NK | Peripheral blood natural killer | CD3−CD56+/−CD16+ |
| #32 | B cells | CD3−CD20+CD19+/− | |
| #33 | mB cell | Memory B cells | CD3−CD20+CD19+/−CD27+IgD−CD38− |
| #34 | nB cell | Naive B cells | CD3−CD20+CD19+/−CD27−IgD+ CD38− |
| #35 | TrB cell | Transitional B cells | CD3−CD20+CD19+/−CD27−IgD+ CD38+CD24+ |
| #36 | Plasmocytes | Plasmocytes | CD3−CD20+CD19+/−CD27+IgD−CD38+CD24− |
| #37 | IgM mB cell | IgM+ memory B cells | CD3−CD20+CD19+/−CD27+IgD−CD38−IgM+ |
Histological Study
Series of 3‐μm‐thick sections of formol‐fixed, paraffin‐embedded liver biopsies were stained with hematoxylin and eosin, picrosirius, and Perls' stains. Histological disease activity was assessed according to the Ishak system,21 and fibrosis stage was established according to the METAVIR score.
Immunohistochemical and Immunofluorescence Studies
Series of five micrometer‐thick sections from frozen liver biopsies and controls were cut and immunostained with primary antibodies using a peroxidase‐labeled polymer method (Envision Flex Plus kit, Dako) in a Dako autostainer. A light counterstaining was obtained with Meyer hematoxylin for 60 seconds. Numbers of CD3, CD4, CD8, forkhead box P3 (FoxP3), CD161, T cell receptor (TCR) Vα7.2, and granzyme B (GrB) positive cells were quantified in lobule areas, within the interface hepatitis and portal tract areas. Immunolabeled cells present in these areas were counted in three different fields at 400 × magnification (100,000 μm2 each) using the NE Elements Imaging Software (Nikon). Liver biopsies from organ donors after cardiac death (stage III of the Maastricht classification) served as normal controls. Immunofluorescence staining was performed on the same frozen liver biopsies using CD3, CD161, and TCR Vα7.2 antibodies, and analyzed by confocal microscopy.
Mait cell activation in vitro assay
A total of 100,000 HeLa cells stably transfected with MR1 (HeLa‐MR122) were cultured in Dulbecco's modified Eagle's medium (Gibco) without supplement at 37°C, with Escherichia coli (DH5α strain) diluted to reach multiplicities of infection of 1000 (1000 multiplicity of infection), as previously described.22 The PBMCs (5 × 10⁵ per well, in 48‐well plates) were added for 20 hours, and monensin was added for the last 4 hours of culture. For blocking conditions, anti‐MR1 (26.5, Biolegend) or IgG2a isotype control (BD Biosciences) was added at a 10‐μg/mL final concentration. Activation of MAIT cells was measured by flow cytometry using CD3, CD4, CD8, CD161, TCR Vα7.2, CD69, GrB, interferon gamma (IFN‐γ), and LIVE/DEAD Fixable Aqua stain (Invitrogen).
Statistical Analysis
GraphPad Prism was used for statistical analysis. All of the tests used were nonparametric (Mann‐Whitney U test, Kruskal‐Wallis test and Dunn's Multiple Comparison Test, Wilcoxon matched‐pairs test, and Spearman's rank correlation) as indicated in the figure legends. For Figures 2 and 3, the P values were adjusted according to the Bonferroni‐Holm test to perform multiple comparison tests (P = 0.0013).
Figure 2.
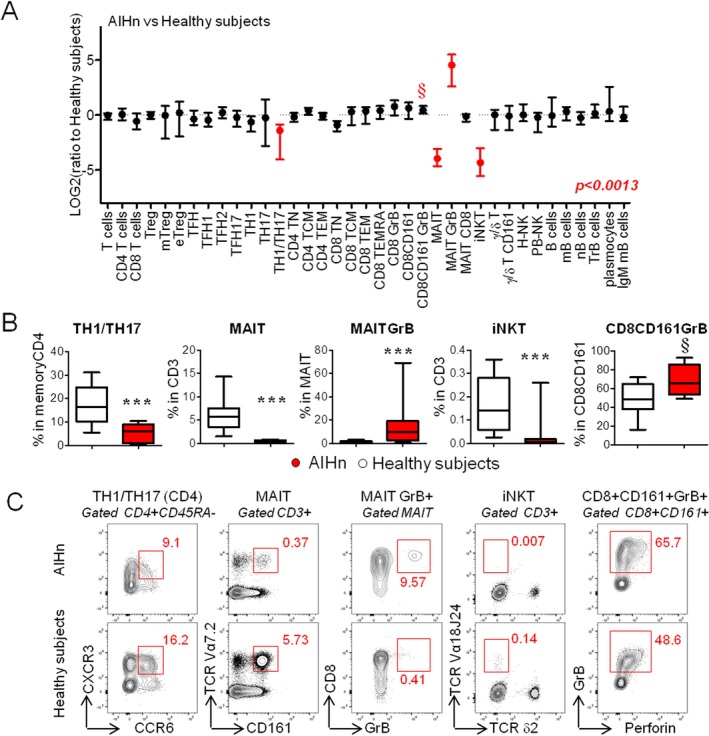
Immune profiling of lymphocytes during active AIH at diagnosis. (A) Graphical representation of the lymphocyte profile modulation in 14 AIHn patients compared with 14 healthy subjects. The ratio was calculated with the median value from healthy subjects. Red points indicate significant modulation (Mann‐Whitney U test and adjusted P value [P = 0.0013]) for multiple comparisons according to Bonferroni‐Holm) based on the frequency value obtained by flow cytometry from lymphocyte populations described in Figure 1. (B) Graphical representation of the frequencies of the different lymphocyte populations identified in Figure 2A in 14 AIHn patients and 14 healthy subjects. Comparisons were performed using the Mann‐Whitney U test. § P < 0.01; *** P < 0.0013. (C) Dot plot representation of the lymphocyte populations from one AIHn patient and from one healthy subject. Median of percentage is indicated in red.
Figure 3.
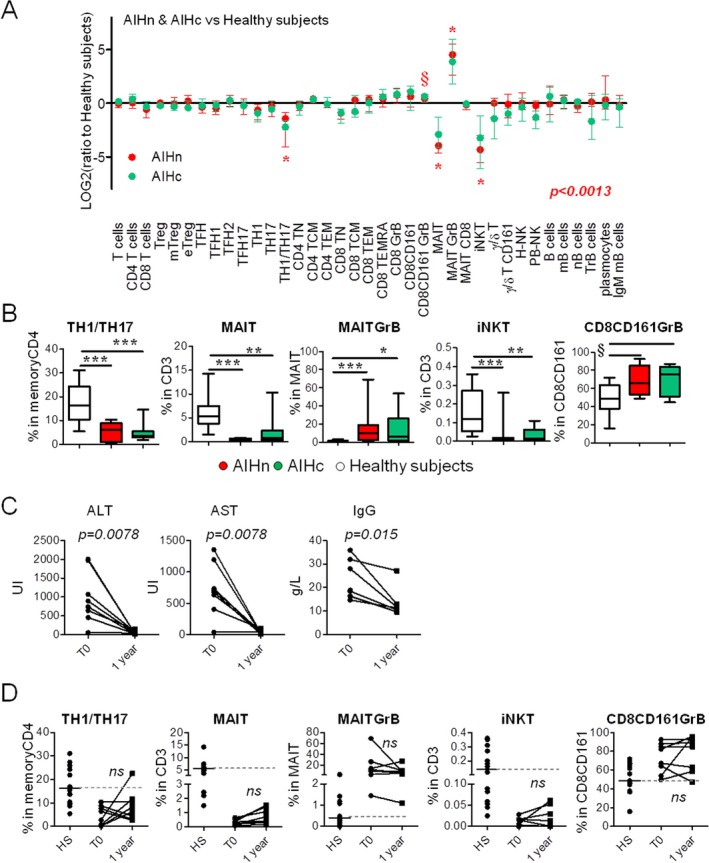
Altered immune cell components were not restored in AIH patients under long treatment. (A) Graphical representation of the lymphocyte profile modulation in 11 AIHc (green) and 14 AIHn (red) patients compared with 14 healthy subjects. The ratio was calculated with the median value from healthy subjects. Stars (*) indicate significant modulation (according to the Kruskal‐Wallis test and taking in account adjusted P value (P = 0.0013) for multiple comparisons according to Bonferroni‐Holm) based on the frequency value obtained by flow cytometry. (B) Graphical representation of the frequencies of the different lymphocyte populations identified in Figure 3A in 11 AIHc patients, 14 AIHn patients, and 14 healthy subjects. Comparisons were performed using Kruskal‐Wallis test and Dunn's multiple comparison test. (* P < 0.05; ** P < 0.01; *** P < 0.001; § P values of the Kruskal‐Wallis test between 0.01 and 0.0013.) Graphical representation of biological parameters (C) and frequency of altered lymphocyte populations (D) in eight AIHn patients at diagnosis (T0) and after 1 year of standard treatment (1 year). Comparisons were performed using the Wilcoxon matched‐pair test.
Results
IMMUNOPHENOTYPING OF 37 MAJOR LYMPHOCYTE SUBSETS DURING ACTIVE AIH
Major lymphoid immune cell subpopulations (Fig. 1 and Table 2) were analyzed in the peripheral blood of AIHn patients and compared with those of age‐matched healthy subjects using flow cytometry. The gating strategy is presented in Supporting Fig. S1 and Fig. 1. The median of the frequency for each lymphocyte subsets is reported in Supporting Table S3. The detailed analysis of the lymphocyte subset frequencies highlighted four significant differences between AIHn patients and healthy subjects (Fig. 2 and Supporting Fig. S2). The major phenotypic modification observed during new‐onset AIH was a marked decrease in circulating MAIT cells, invariant natural killer T (iNKT) cells, and Th1/Th17 CD4 T cells (CXCR3+ CCR6+CD4 T cells23) compared with healthy subjects (Fig. 2B,C). The in vitro cytokine profile analysis showed a decrease in CD4 T cells coproducing IL17 and IFN‐γ, compared with healthy subjects (Supporting Fig. S3). This confirmed the decrease of circulating Th1/Th17 CD4 T cells.
In addition, GrB, a marker of cytotoxic activity, was increased in MAIT cells, and a trend toward an increase of GrB expression was observed in a subpopulation of CD8 T cells expressing CD161 (P = 0.01‐0.0013) (Fig. 2A‐C).
CD4+ Tregs and Tfh populations, previously reported to be involved in AIH pathogenesis, were also examined. The frequencies of Tregs (CD25+CD1 27‐), memory Tregs (mTregs; CD25+CD127‐FOXP3+ CD45RA‐), and effector Tregs (eTregs; CD25+CD127‐FOXP3+CD45RA‐HELIOS+CT LA4+), as well as those of Tfh (Tfh1, Tfh2, and Tfh17) cells were not significantly different between AIHn patients and healthy subjects (Table 2, Supporting Fig. S2, and Supporting Table S3).
Thus, the first part of our study showed that during new‐onset AIH, the MAIT cells, iNKT cells, Th1/Th17 CD4 T cells, and CD8+CD161+ are quantitatively and/or qualitatively altered.
STANDARD TREATMENT DID NOT RESTORE THE ALTERED IMMUNE PHENOTYPE OBSERVED IN NEW‐ONSET AIH
The potential impact of the immunosuppressive treatment on the 37 lymphocyte subpopulations analyzed was investigated. First, 11 AIHc patients were evaluated for the same parameters (Fig. 3, Supporting Fig. S4, and Supporting Table S3). Data were compared with those from AIHn patients and healthy subjects (Fig. 3A). No significant difference compared with AIHn was observed, and MAIT cells, iNKT cells, Th1/Th17 CD4 T cells, and CD8+CD161+ were still quantitatively and/or qualitatively altered compared with healthy subjects (Fig. 3B).
Second, the immunophenotyping analysis for the five altered lymphocyte populations identified before was performed for eight AIHn patients at diagnosis (T0) and repeated after approximately 1 year of treatment (Supporting Table S1), when their transaminases and IgG levels were significantly decreased, and most of them had achieved complete remission (Fig. 3C,D). Differences in frequencies were not statistically significant compared with those measured at diagnosis and remained different from healthy subjects (Fig. 3D). These results suggest that the early or long‐term immunosuppressive treatment in AIH does not allow the restoration of the altered lymphocyte homeostasis observed during the initial active phase of the disease.
HIGH PROPORTION OF IMMUNE CELLS EXPRESSING CD4, CD8, foxp3, CD161, Grb, AND MAIT CELL MARKERS ARE FOUND IN THE LIVER OF PATIENTS WITH NEW‐ONSET AIH
We hypothesized that immune alterations found in AIH patient blood could be linked to hepatic cellular infiltration. Seven liver biopsies from AIHn patients were used to determine the T‐cell infiltrate profile at diagnosis and compared with two liver biopsies from AIHc patients (under biological remission) and two control noninflammatory liver biopsies (from organ donors after cardiac death; stage III of the Maastricht classification) (Fig. 4). First, CD3, CD4, CD8, Foxp3, CD161, TCR Vα7.2 (TCR of MAIT cells), and GrB expression were analyzed by immunohistochemistry on serial sections. At diagnosis, AIH was characterized by a CD3, CD4, and CD8 T‐cell infiltrate both in the portal tract and the lobule areas (Fig. 4A). Under immunosuppressive treatment this infiltrate decreased markedly in the lobule area, whereas it remained stable in the portal tract, and higher than in control livers. As previously described,14 the marked Foxp3 (transcription factor of Treg cells) expression in the portal tract in AIH patients decreased under immunosuppressive treatment (Fig. 4A). Interestingly, CD161, TCRVα7.2, and GrB expression were high in AIHn livers compared with control livers. When comparing AIHn with AIHc liver biopsies, TCRVα7.2 and CD4 expression in the portal tract were not changed by the immunosuppressive treatment. The presence of MAIT cells in the liver during active AIH was confirmed by CD3, CD161, and TCR Vα7.2 costaining in liver biopsies from AIHn patients by fluorescence microscopy (Fig. 4B,C).
Figure 4.
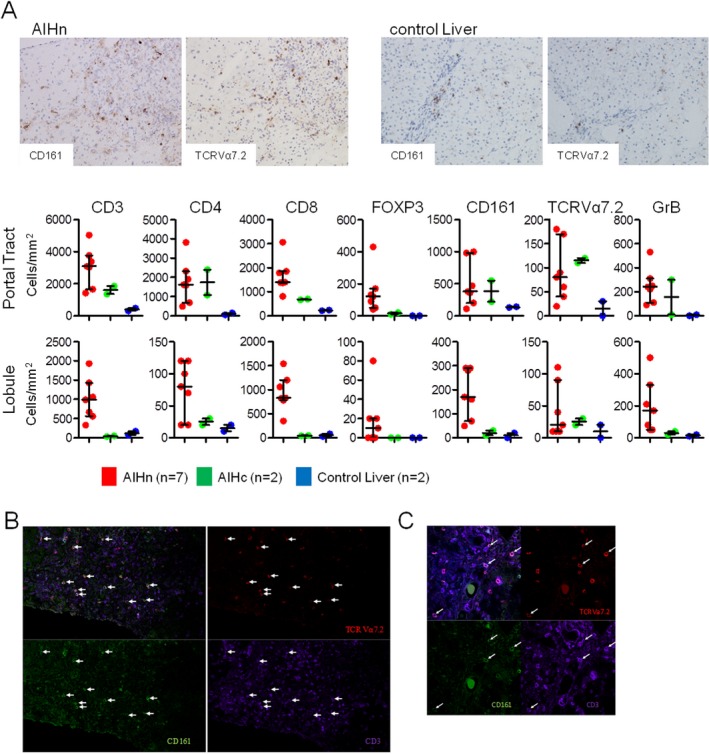
Immunohistochemistry and immunofluorescence staining of frozen human liver sections from treatment‐naive AIHn patients at diagnosis. (A) Immunohistochemistry staining and frequencies of positive cells per cubic millimeter in the portal tract or lobule from liver biopsies of AIHn patients (n = 7), AIHc patients (n = 2), and control livers (n = 2). (B,C) TCR Valpha 7.2 (red), CD161 (green), CD3 (purple), and Dapi (blue) staining of frozen liver sections. (B) Image from a 636.4 × 636.4 micron photo (3 × 3 images, objective ×60). (C) 214.25 × 214.25 micron image (objective ×60).
The accumulation of CD4, CD8, CD161, GrB, and MAIT cell markers in the livers of AIH patients at diagnosis is consistent with their depletion/alteration in peripheral blood.
MAIT CELLS FROM AIH PATIENTS ARE FUNCTIONALLY ALTERED UPON BACTERIAL STIMULATION IN VITRO
Because circulating MAIT cells were decreased, displayed an ex vivo activated phenotype (GrB+), and were enriched in the liver in AIHn patients, we investigated their MR1 (major histocompatibility complex–related protein 1) dependent function in vitro after bacterial stimulation22, 24 (Fig. 5A). We observed that MAIT cells from AIH patients expressed less CD69 and produced less IFN‐γ and GrB following bacterial stimulation than those from healthy subjects (Fig. 5B). This activation defect may be the consequence of their persistent activation (GrB+) ex vivo and could reflect an exhaustion phenomenon as recently observed during liver autoimmune diseases.25
Figure 5.
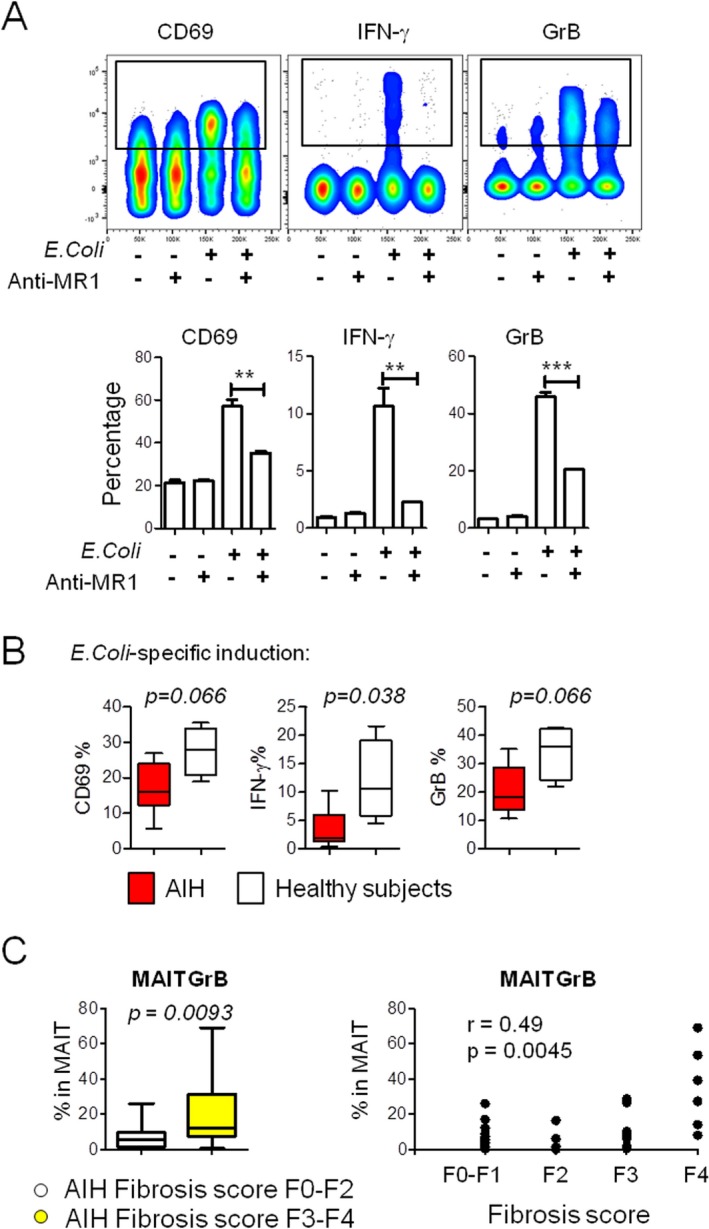
MAIT cells from AIH patients were defective in IFN‐γ production upon in vitro bacterial stimulation and their ex vivo activity (GrB) correlates with severe fibrosis at diagnosis. (A) Dot plot representation of MR1‐dependent MAIT cell activation on bacterial stimulation using PBMCs from one healthy subject. Graphs represent percentage of CD69, IFN‐γ, and GrB on gated MAIT cells after 20‐hour culture with Hela‐MR1 cells with or without E. coli and anti‐MR1 antibody. (B) Graphs represent percentage of CD69, IFN‐γ, and GrB on gated MAIT cells from healthy subjects (n = 4), AIHn patients (n = 3), and AIHc patients (n = 3) after 20‐hour culture with Hela‐MR1 cells with E. coli. Comparisons were performed using the Mann‐Whitney U test. (C) Left, graphical representation of the frequency of MAIT GrB+ cells in the AIH patients with a fibrosis score of F3 to F4 (n = 14, yellow) and AIH patients with a fibrosis score of F0 to F2 (n = 18, white). Comparisons were performed using the Mann‐Whitney U test. Right, Spearman's rank correlation between MAIT GrB+ cells and fibrosis stage (F0‐F4) in all AIH patient samples (n = 33).
EX VIVO MAIT CELL ACTIVITY (GRB) IN AIH PATIENTS IS CORRELATED WITH SEVERE FIBROSIS
Fibrosis development is one of the major consequences of active AIH and could be enhanced by MAIT cell activity.25 Thus, we investigated the possible link between fibrosis stage at diagnosis and GrB expression by MAIT cells in AIH patients, at all stages of the disease. A significant accumulation of MAIT GrB+ cells was found in the blood of AIH patients with severe fibrosis at diagnosis (F3‐F4) compared with low‐stage fibrosis (F0‐F2), and GrB expression by MAIT cells correlated with the fibrosis score at diagnosis (Fig. 5C).
To summarize, MAIT cells were decreased in the blood, displayed an activated phenotype ex vivo, infiltrated the inflamed liver, and were impaired in their capacity to respond to bacterial antigen in vitro. Finally, MAIT cell activity correlated with the stage of fibrosis, in agreement with the recently reported role of MAIT cells in fibrosis development during liver autoimmune diseases.25
Discussion
This study proposes a comprehensive phenotyping study of lymphocyte subsets alterations in adult type 1 AIH. We demonstrate that it is possible to identify relevant cellular populations linked to AIH pathogenesis by a translational approach using patient blood samples. We identify five lymphocyte subpopulations with both quantitative and qualitative alterations in the blood of AIH patients. In this work, we also studied diagnostic liver biopsies, and were able to demonstrate the presence of some of the specific lymphocyte markers altered in the blood. Globally, regarding these lymphocyte subsets, 1) their frequency decreases in the blood, 2) they display an activated phenotype, 3) they are possibly recruited to the liver, and 4) standard immunosuppressive treatment does not restore their normal homeostasis in the blood.
Our work suggests a role of CD8+CD161+ and Th1/Th17 CD4 T cells in the early stage of AIH pathogenesis. CD8+CD161+ T cells from patient blood expressed high levels of GrB, a marker of cytotoxic activity. The increased expression of their markers CD8, CD161, and GrB in the liver lobule suggests that they possibly infiltrated the liver in the active phase of the disease. CD8+CD161+ cells have been previously described as enriched in physiological conditions within the gut, with a polyfunctional memory profile directed against several common viruses.26 The virus‐specific antigenic diversity of CD8+CD161+ T cells hindered the identification of the subset of these cells reacting to liver self‐antigens. A study of the self‐reactivity of CD8+CD161+ T cells might be useful to better understand their role in AIH.
The involvement of the IL17 pathway in AIH pathogenesis has already been described, and accumulation of IL17 and of retinoid A receptor–related orphan receptor C in the liver of AIH patients has been shown.18, 19 In this study, we identified a more specific phenotype of IL‐17‐producing CD4 T cells involved in the early stage of the AIH disease, which is known as the Th1/Th17 CD4 T‐cell subset. These cells have been involved in defense against pathogenic and commensal microbes,23 and have a pathogenic role suggested in other autoimmune diseases such as multiple sclerosis.27 They coproduced IFN‐γ and IL17 and were characterized by the co‐expression of CXCR3 and CCR6, which is also consistent with a potential recruitment to the liver, as CXCR3 and CCR6 are necessary for T‐cell migration to the inflamed liver.19 In our study, Th1/Th17 CD4 T cells were decreased in patient blood, consistent with an enhanced recruitment to the liver. Although CCR6 detection in the liver of AIHn patients was not technically possible in this study, the presence of CD4, CD161, and IL17 (data not shown) in the portal tract is in agreement with this hypothesis.
This study also revealed significant alterations among MAIT cells in AIHn patients compared with healthy subjects. The MAIT cells are specifically enriched in the liver and involved in the antibacterial response. They have an invariant TCR (TCRVα7.2) and express the C‐lectin CD161.24 In our work, the frequency of these cells was decreased in the blood of AIH patients, and the immunohistochemistry study of liver biopsies showed an increased density of TCRVα7.2‐ and CD161‐positive cells, suggesting their recruitment to the site of inflammation. Moreover, based on the GrB marker, these cells displayed an ex vivo activated phenotype in AIHn patients compared with healthy subjects. This ex vivo activation and MAIT cell IFN‐γ production defect following specific MR1‐mediated bacterial stimulation in vitro can reflect exhaustion due to chronic activation. Comparable observations have been reported in other inflammatory diseases such as inflammatory bowel diseases,28 obesity, and type 2 diabetes,29 as well as in other chronic liver diseases,30, 31 suggesting that MAIT cells play a role in the inflammatory processes occurring during AIH. In addition, among AIH patients, those diagnosed with severe fibrosis (F3‐F4) had a higher MAIT cell activity. This relationship could be explained by the recently described profibrogenic role of MAIT cells in liver autoimmune diseases, by promoting hepatic stellate cell activation.25 Liver cirrhosis is known to be associated with a higher exposure of hepatocytes to bacterial‐derived antigens because of an increased permeability of the gut wall, favoring systemic infections.32 Moreover, the liver cellular environment is able to activate MAIT cells under bacterial exposure.31 Altogether, these elements could explain the link found between MAIT cell activity and stage of hepatic fibrosis in AIH in our study.
The frequency of iNKT cells was decreased in the blood of AIHn patients, and not restored under immunosuppressive treatment. The iNKT cells have an invariant TCR (Vα24Jα18), represent less than 2% of T cells in the liver, and specifically recognize self‐antigens or microbial glycosphingolipids.33 These cells have been shown to play an essential role in disease progression in AIH mouse models.34 They have been detected in the liver of children with AIH, associated with an increase in hepatic Vα24 transcripts, and have been observed with a decreased frequency in peripheral blood.35 Our study is the first to report a decrease in the iNKT cell population in adult AIH patients. The number of circulating iNKT cells detected was extremely low and our findings reinforce the fact that the role of iNKT cells in AIH needs to be addressed in future research.
This work proposes a global view of the lymphocyte dynamics during AIH and raises concerns regarding the efficacy of nonspecific immunosuppressive treatment and the consequence on the high risk of relapse.
During the active phase of the disease, blood and liver immunostainings strongly suggest the involvement of CD4, CD8, and MAIT cells in the inflammatory process occurring in the liver. Consistent with previous studies, we also observed an enrichment of Foxp3‐positive cells in the liver of AIHn patients, suggesting the migration of regulatory T cells to the liver in an unsuccessful attempt to control the disease.14
In patients in biological remission under standard immunosuppressive therapy, the hepatic lobules were clear of CD8 T cells, but several immune parameters remained altered: The frequencies of circulating Th1/Th17 CD4 T cells and MAIT cells were still low. Moreover, there was a persistence of CD4 T cells and MAIT cells in their liver (portal tracts), and a decreased number of intrahepatic Foxp3 positive cells as previously observed by Taubert et al.14 This decrease of intrahepatic regulatory T cells under treatment and the persistence of immune alterations in the blood and in the liver described in our study could participate actively in the high risk of relapse after treatment withdrawal.
Conflicting results have been reported regarding the alteration of the Treg compartment in the blood of AIH patients.9, 10, 11, 12, 13, 14 The absence of modification we observed on adult patients suggests that these discrepancies could be due to the form of the disease: The Vergani and Longhi group clearly demonstrated blood alterations of Tregs in pediatric AIH patients,9, 10, 11, 12 whereas alterations were not observed in adult AIH patients, by us, or others.13, 14
In conclusion, this is an effort to perform an exhaustive immune phenotyping in AIH patients. On the one hand, the fact that we did not confirm alterations of some subsets reported by others (e.g., Tfh16, 17) might be due to cohort specificities and reinforces the need for joining efforts to create large cohorts, a difficult task for rare diseases such as AIH. On the other hand, we confirmed the involvement of some subsets and identified new ones. Th1/Th17 CD4 T cells and a subset of cytotoxic CD8+CD161+ T cells are possible actors of the liver injury in AIH, and MAIT cells are probably involved in the inflammatory and fibrosis process during AIH. The characterization of the specific self‐reactivity of Th1/Th17 CD4 T cells and CD8+CD161+ in AIH might be the next step toward new therapeutic approaches to permanently control this disease.
Abbreviations
- AIH
autoimmune hepatitis
- AIHc
AIH patients with controlled disease
- AIHn
patients with new onset of AIH
- ALT
alanine aminotransferase
- ANA
antinuclear antibodies
- AST
aspartate aminotransferase
- CD
clusters of differentiation
- FoxP3
forkhead box P3
- GrB
granzyme B
- IFN‐γ
interferon gamma
- iNKT
invariant natural killer T cells
- MAIT
mucosal‐associated invariant T cells
- PBMC
peripheral blood mononuclear cell
- SLA
soluble liver antigen
- SMA
smooth muscle antibodies
- TCR
T cell receptor
- Tfh
follicular helper T cell
- Type 1 helper, Th1; Type 17 Helper, Th17; Tregs
regulatory T cells
Supporting information
Additional Supporting Information may be found at http://onlinelibrary.wiley.com/doi/10.1002/hep4.1200/full.
Potential conflict of interest: Nothing to report.
Supported by the National Research Agency through the IHU‐Cesti project (ANR‐10‐IBHU‐005) and the LabEX IGO program (ANR‐11‐LABX‐0016‐01). The IHU‐Cesti project is also supported by Nantes Métropole and the Pays de la Loire Region. This work was also supported by the Association pour la lutte contre les maladies inflammatoires du foie et des voies biliaires and by AFEF‐Société Française d'Hépatologie.
References
- 1. Wang Q, Yang F, Miao Q, Krawitt EL, Gershwin ME, Ma X. The clinical phenotypes of autoimmune hepatitis: a comprehensive review. J Autoimmun 2016;66:98‐107. [DOI] [PubMed] [Google Scholar]
- 2. Sebode M, Hartl J, Vergani D, Lohse AW, International Autoimmune Hepatitis Group (IAIHG) . Autoimmune hepatitis: from current knowledge and clinical practice to future research agenda. Liver Int 2018;38:15‐22. [DOI] [PubMed] [Google Scholar]
- 3. Manns MP, Czaja AJ, Gorham JD, Krawitt EL, Mieli‐Vergani G, Vergani D, et al. Diagnosis and management of autoimmune hepatitis. Hepatology 2010;51:2193‐213. [DOI] [PubMed] [Google Scholar]
- 4. Schramm C, Weiler‐Normann C, Wiegard C, Hellweg S, Müller S, Lohse AW. Treatment response in patients with autoimmune hepatitis. Hepatology 2010;52:2247‐2248. [DOI] [PubMed] [Google Scholar]
- 5. European Association for the Study of the Liver . EASL clinical practice guidelines: autoimmune hepatitis. J Hepatol 2015;63:971‐1004. [DOI] [PubMed] [Google Scholar]
- 6. Heneghan MA, Yeoman AD, Verma S, Smith AD, Longhi MS. Autoimmune hepatitis. Lancet 2013;382:1433‐1444. [DOI] [PubMed] [Google Scholar]
- 7. Hoeroldt B, McFarlane E, Dube A, Basumani P, Karajeh M, Campbell MJ, et al. Long‐term outcomes of patients with autoimmune hepatitis managed at a nontransplant center. Gastroenterology 2011;140:1980‐1989. [DOI] [PubMed] [Google Scholar]
- 8. Liberal R, Krawitt EL, Vierling JM, Manns MP, Mieli‐Vergani G, Vergani D. Cutting edge issues in autoimmune hepatitis. J Autoimmun 2016;75:6‐19. [DOI] [PubMed] [Google Scholar]
- 9. Longhi MS, Hussain MJ, Mitry RR, Arora SK, Mieli‐Vergani G, Vergani D, et al. Functional study of CD4+CD25+ regulatory T cells in health and autoimmune hepatitis. J Immunol 2006;176:4484‐4491. [DOI] [PubMed] [Google Scholar]
- 10. Grant CR, Liberal R, Holder BS, Cardone J, Ma Y, Robson SC, et al. Dysfunctional CD39(POS) regulatory T cells and aberrant control of T‐helper type 17 cells in autoimmune hepatitis. Hepatology 2014;59:1007‐1015. [DOI] [PMC free article] [PubMed] [Google Scholar]
- 11. Liberal R, Grant CR, Yuksel M, Graham J, Kalbasi A, Ma Y, et al. Treg conditioning endows activated Teff with suppressor function in autoimmune hepatitis/autoimmune sclerosing cholangitis. Hepatology 2017;66. [DOI] [PMC free article] [PubMed] [Google Scholar]
- 12. Liberal R, Grant CR, Holder BS, Cardone J, Martinez‐Llordella M, Ma Y, et al. In autoimmune hepatitis type 1 or the autoimmune hepatitis‐sclerosing cholangitis variant defective regulatory T‐cell responsiveness to IL‐2 results in low IL‐10 production and impaired suppression. Hepatology 2015;62:863‐875. [DOI] [PubMed] [Google Scholar]
- 13. Peiseler M, Sebode M, Franke B, Wortmann F, Schwinge D, Quaas A, et al. FOXP3+ regulatory T cells in autoimmune hepatitis are fully functional and not reduced in frequency. J Hepatol 2012;57:125‐132. [DOI] [PubMed] [Google Scholar]
- 14. Taubert R, Hardtke‐Wolenski M, Noyan F, Wilms A, Baumann AK, Schlue J, et al. Intrahepatic regulatory T cells in autoimmune hepatitis are associated with treatment response and depleted with current therapies. J Hepatol 2014;61:1106‐1114. [DOI] [PubMed] [Google Scholar]
- 15. Ferri S, Longhi MS, De Molo C, Lalanne C, Muratori P, Granito A, et al. A multifaceted imbalance of T cells with regulatory function characterizes type 1 autoimmune hepatitis. Hepatology 2010;52:999‐1007. [DOI] [PubMed] [Google Scholar]
- 16. Ma L, Qin J, Ji H, Zhao P, Jiang Y. Tfh and plasma cells are correlated with hypergammaglobulinaemia in patients with autoimmune hepatitis. Liver Int 2014;34:405‐415. [DOI] [PubMed] [Google Scholar]
- 17. Kimura N, Yamagiwa S, Sugano T, Setsu T, Tominaga K, Kamimura H, et al. Possible involvement of CCR7(‐) PD‐1(+) follicular helper T cell subset in the pathogenesis of autoimmune hepatitis. J Gastroenterol Hepatol 2018;33:298–306. [DOI] [PubMed] [Google Scholar]
- 18. Zhao L, Tang Y, You Z, Wang Q, Liang S, Han X, et al. Interleukin‐17 contributes to the pathogenesis of autoimmune hepatitis through inducing hepatic interleukin‐6 expression. PLoS ONE 2011;6:e18909. [DOI] [PMC free article] [PubMed] [Google Scholar]
- 19. Oo YH, Banz V, Kavanagh D, Liaskou E, Withers DR, Humphreys E, et al. CXCR3‐dependent recruitment and CCR6‐mediated positioning of Th‐17 cells in the inflamed liver. J Hepatol 2012;57:1044‐1051. [DOI] [PMC free article] [PubMed] [Google Scholar]
- 20. Hennes EM, Zeniya M, Czaja AJ, Parés A, Dalekos GN, Krawitt EL, et al. Simplified criteria for the diagnosis of autoimmune hepatitis. Hepatology 2008;48:169‐176. [DOI] [PubMed] [Google Scholar]
- 21. Ishak K, Baptista A, Bianchi L, Callea F, De Groote J, Gudat F, et al. Histological grading and staging of chronic hepatitis. J Hepatol 1995;22:696‐699. [DOI] [PubMed] [Google Scholar]
- 22. Salou M, Nicol B, Garcia A, Baron D, Michel L, Elong‐Ngono A, et al. Neuropathologic, phenotypic and functional analyses of mucosal associated invariant T cells in multiple sclerosis. Clin Immunol 2016;166‐167:1‐11. [DOI] [PubMed] [Google Scholar]
- 23. Duhen T, Campbell DJ. IL‐1β promotes the differentiation of polyfunctional human CCR6+CXCR3+ Th1/17 cells that are specific for pathogenic and commensal microbes. J Immunol 2014;193:120‐129. [DOI] [PMC free article] [PubMed] [Google Scholar]
- 24. Kurioka A, Walker LJ, Klenerman P, Willberg CB. MAIT cells: new guardians of the liver. Clin Transl Immunology 2016;5:e98. [DOI] [PMC free article] [PubMed] [Google Scholar]
- 25. Böttcher K, Rombouts K, Saffioti F, Roccarina D, Rosselli M, Hall A, et al. MAIT cells are chronically activated in patients with autoimmune liver disease and promote pro‐fibrogenic hepatic stellate cell activation. Hepatology 2018. doi: 10.1002/hep.29782. [DOI] [PubMed] [Google Scholar]
- 26. Fergusson JR, Hühn MH, Swadling L, Walker LJ, Kurioka A, Llibre A, et al. CD161(int)CD8+ T cells: a novel population of highly functional, memory CD8+ T cells enriched within the gut. Mucosal Immunol 2016;9:401‐413. [DOI] [PMC free article] [PubMed] [Google Scholar]
- 27. Paroni M, Maltese V, De Simone M, Ranzani V, Larghi P, Fenoglio C, et al. Recognition of viral and self‐antigens by TH1 and TH1/TH17 central memory cells in patients with multiple sclerosis reveals distinct roles in immune surveillance and relapses. J Allergy Clin Immunol 2017;140:797‐808. [DOI] [PubMed] [Google Scholar]
- 28. Serriari N‐E, Eoche M, Lamotte L, Lion J, Fumery M, Marcelo P, et al. Innate mucosal‐associated invariant T (MAIT) cells are activated in inflammatory bowel diseases. Clin Exp Immunol 2014;176:266‐274. [DOI] [PMC free article] [PubMed] [Google Scholar]
- 29. Magalhaes I, Pingris K, Poitou C, Bessoles S, Venteclef N, Kiaf B, et al. Mucosal‐associated invariant T cell alterations in obese and type 2 diabetic patients. J Clin Invest 2015;125:1752‐1762. [DOI] [PMC free article] [PubMed] [Google Scholar]
- 30. Hengst J, Strunz B, Deterding K, Ljunggren H‐G, Leeansyah E, Manns MP, et al. Nonreversible MAIT cell‐dysfunction in chronic hepatitis C virus infection despite successful interferon‐free therapy. Eur J Immunol 2016;46:2204‐2210. [DOI] [PubMed] [Google Scholar]
- 31. Jeffery HC, van Wilgenburg B, Kurioka A, Parekh K, Stirling K, Roberts S, et al. Biliary epithelium and liver B cells exposed to bacteria activate intrahepatic MAIT cells through MR1. J Hepatol 2016;64:1118‐1127. [DOI] [PMC free article] [PubMed] [Google Scholar]
- 32. Bonnel AR, Bunchorntavakul C, Reddy KR. Immune dysfunction and infections in patients with cirrhosis. Clin Gastroenterol Hepatol 2011;9:727‐738. [DOI] [PubMed] [Google Scholar]
- 33. Gao Y, Williams AP. Role of innate T cells in anti‐bacterial immunity. Front Immunol 2015;6:302. [DOI] [PMC free article] [PubMed] [Google Scholar]
- 34. Doherty DG. Immunity, tolerance and autoimmunity in the liver: a comprehensive review. J Autoimmun 2016;66:60‐75. [DOI] [PubMed] [Google Scholar]
- 35. Cherñavsky AC, Paladino N, Rubio AE, De Biasio MB, Periolo N, Cuarterolo M, et al. Simultaneous expression of Th1 cytokines and IL‐4 confers severe characteristics to type I autoimmune hepatitis in children. Hum Immunol 2004;65:683‐691. [DOI] [PubMed] [Google Scholar]
Associated Data
This section collects any data citations, data availability statements, or supplementary materials included in this article.
Supplementary Materials
Additional Supporting Information may be found at http://onlinelibrary.wiley.com/doi/10.1002/hep4.1200/full.