

Abstract
The Taiwan Biobank (TWB) aims to build a nationwide research database that integrates genomic/epigenomic profiles, lifestyle patterns, dietary habits, environmental exposure history and long-term health outcomes of 300,000 residents of Taiwan. We describe here an investigation of the population structure of Han Chinese on this Pacific island using genotype data of 591,048 SNPs in an initial freeze of 10,801 unrelated TWB participants. In addition to the North-South cline reported in other Han Chinese populations, we find the Taiwanese Han Chinese clustered into three cline groups: 5% were of northern Han Chinese ancestry, 79.9% were of southern Han Chinese ancestry, and 14.5% belonged to a third (T) group. We also find that this T group is genetically distinct from neighbouring Southeast Asians and Austronesian tribes but similar to other southern Han Chinese. Interestingly, high degree of LD between HLA haplotype A*33:03-B*58:01, an MHC allele being of pathological relevance, and SNPs across the MHC region was observed in subjects with T origin, but not in other Han Chinese. This suggested the T group individuals may have experienced evolutionary events independent from the other southern Han Chinese. Based on the newly-discovered population structure, we detect different loci susceptible to type II diabetes in individuals with southern and northern Han Chinese ancestries. Finally, as one of the largest dataset currently available for the Chinese population, genome-wide statistics for the 10,810 subjects are made publicly accessible through Taiwan View (https://taiwanview.twbiobank.org.tw/index; date last accessed October 14, 2016) to encourage future genetic research and collaborations with the island Taiwan.
Introduction
The Taiwan Biobank (TWB) is establishing a scientific infrastructure that is accessible to biomedical researchers to increase our understanding of the relationships among genetics, environment, diet and the aetiology/progression of diseases. This effort is based on the recruitment and monitoring of a cohort of 200,000 individuals from the general Taiwanese population with no history of cancer and another 100,000 patients with chronic diseases of public health importance. TWB aims to improve the health of future generations and facilitate genomic research in Taiwan. The progressive elucidation of risk factors and of the molecular pathogenesis of disease will both improve disease prevention and facilitate the development of individualized prevention and therapy. In addition to the ongoing establishment of recruitment centres throughout Taiwan and collection of information and specimens from participants, TWB is currently focusing on disease gene mapping. The aim of the present study is to construct a population-specific reference of whole-genome genotyping and investigate the structure of the Taiwanese population.
Taiwan is an island (35,801 km2) in the Pacific Ocean with a population of ∼23 million people (1). As an immigrant population, the majority (>95%) of Taiwanese are of Han Chinese ancestry, whereas ∼2% are of aboriginal ancestry (Austronesian) (1). The Taiwanese Han Chinese population can be divided into Min-Nan (also known as Holo), Hakka and Mainlanders according to their geographic origins (1). Overpopulation in the southeastern coastal provinces of Fujian and Guangdong in China and the close proximity of these provinces to Taiwan led the ancestors of the Min-Nan and Hakka to move to Taiwan during the past few centuries (2). The two populations have been reported to share similar genetic backgrounds, as they are descendants of an admixture of Han Chinese and the southeast coastal indigenous population (Yueh) of China (3). All other Han Chinese are referred to as Mainlanders, and most moved from mainland China to Taiwan after World War II and registered themselves as originating from other provinces of China (1). In a recent survey, 73.3% of Taiwanese self-reported as Min-Nan, 13.4% as Hakka, 8% as Mainlanders, and 1.9% as Taiwanese aborigines (non-Han Chinese) (4). The present study focused on Taiwan’s Han Chinese population.
Investigation of population structure and history through principal components analysis (PCA) is notoriously difficult without incorporating other sources of information such as from archaeology, linguistics, or geography (5,6). In fact, non-genic variations could also contribute to top principal components to varying degrees depending on the data quality (6,7). Previous examinations of Han Chinese structures from mainland China found that a one-dimensional North-to-South cline explains the most amount of genetic variation (8,9). The findings were largely reliant on the high correlation between the genetic coordinate (the first principal component (PC) of PCA) and the geographic location (the latitude of resident site) of the subjects. However, few insights emerged from the second or lower PCs in these studies. This could be due to relatively small sample sizes or the incomplete sampling of mainland Han Chinese in these studies.
In this study, we designed the Axiom Genome-Wide TWB genotyping array for Taiwan’s Han Chinese, which is particularly suited for analyzing southern Han Chinese populations. TWB has genotyped more than 12,000 samples for the current data release. We investigated the population structure of the genotyped Han Chinese Taiwanese, which was previously assumed to be a homogeneous population given previous results of structure of Han Chinese (10–14) and the known migration history of Taiwanese (1). However, our deeper investigation showed a biological interpretation for the second PC, driven by the MHC region that strongly shaped the structure of present day Taiwanese, and thus has implication on the population history of Taiwan as well as the health of present day Taiwanese.
Results
Samples and genotyping
For this study, 12,350 DNA samples from 12,183 recruited individuals and 167 quality-control duplicates were genotyped using the TWB array, a genome-wide association study (GWAS) array designed for Taiwan’s Han Chinese population. All participants self-reported as being of Han Chinese ancestry. The analysis focused on 10,801 unrelated samples passing stringent quality controls, by excluding 80 samples with low call rates, the 167 replicates, 1183 samples from individuals with uncertain kinship, and 119 samples from individuals without follow-up visits. The average call rate for the 10,801 samples was 99.69 ± 0.23% (standard deviation, SD), and the average concordance rate among the 167 pairs of replicates was 99.80 ± 0.11%. A total of 591,048 autosomal single-nucleotide polymorphisms (SNPs) passed quality control. SNPs on the X and Y chromosomes, as well as those on mitochondrial DNA, were also included for data release (Supplementary Material, Table S1). The samples were from 5,359 males and 5,442 females ranging in age from 30 to 70 years.
Population structure of Han Chinese in Taiwan
We first performed a principal component analysis (PCA, implemented in EIGENSTRAT (15)) with a global (GLOBAL) set of samples (the 10,801 TWB samples and 2,504 samples from the 1000 Genomes Project (1000G) (16)). To overcome the possible influence from inter-marker linkage disequilibrium (LD) on the PCA (17) and to fulfil the limitation of number of SNPs for running later admixture analysis, 16,824 autosomal SNPs were selected to be evenly distributed across the human genome and virtually independent of the neighbouring SNPs. Here, we constrained the selection by inter-marker LD r2 < 0.3 within 5-Mb sliding windows, which is more stringent than in previous studies (8,9,18,19). The scatter plot of the first two principal components (PC1 and PC2), accounting for 66% and 22% of variation, respectively, showed that the TWB samples and 1000G samples clustered into three large groups, East Asians, Africans and a third group that included Europeans, admixed Americans and Southern Asians (Supplementary Material, Fig. S1A). As expected, all of the TWB samples and the 1000G East Asians (EAS) samples belong to the East Asian cluster. The 1000G EAS samples include Chinese Dai in Xishuangbanna, China (CDX), Han Chinese in Bejing, China (CHB), Southern Han Chinese, China (CHS), Japanese in Tokyo, Japan (JPT) and Kinh in Ho Chi Minh City, Vietnam (KHV). We then performed PCA with the ASIAN subset (the 10,801 TWB samples and the 504 1000G EAS samples). The first two PCs, accounting for 18.4% and 12.3% of variation, showed a triangle, in which the JPT samples clustered together at the top-left vertex, the CDX and KHV sampled located at the bottom left vertex and all of the Han Chinese samples sprayed across the central to the third vertex (Supplementary Material, Fig. S1B). The Han Chinese samples themselves also formed an inner triangle in which most of the CHB samples were located close to the top angle, the CHS samples were dispersed in the centre of the triangle, and the majority of the TWB samples were located along the long side opposed to the top angle (Supplementary Material, Fig. S1B). Comparison between the 7,792 Min-nan and 1,002 Hakka subjects of TWB (defined as subjects who self-reported that both parents were of Min-nan and Hakka origins respectively) showed a significant difference in PC1 (Wilcoxon rank-sum test P < 0.0001) but not in PC2. In particular, the Min-nan individuals showed a greater variance along PC1 axis than the Hakka individuals (Supplementary Material, Fig. S1C). However, as the two subgroups could not be clearly discriminated based on PC1 and PC2 (Supplementary Material, Fig. S1C), we grouped these two subgroups in further analyses.
Interestingly, a north-to-south trend, starting with the JPT samples and sequentially followed by the Han Chinese samples (CHB, CHS and TWB), the KHV samples and the CDX samples, lay along PC1. In particular, the positions on PC1 for the TWB subjects were roughly analogous to the latitudes of their self-reported ethnic origins on the TWB questionnaire (Supplementary Material, Fig. S1D); this pattern is consistent with those reported in previous studies of Han Chinese population structure (8,9). On the other hand, a unique spread of TWB samples along PC2 was noted (Supplementary Material, Fig. S1B) that has not been noted in previous studies of Chinese populations (8,9). To explore this further, we performed the following analyses to dissect subpopulations in the TWB and reference populations.
We carried out admixture analysis (implemented in ADMIXTURE (20)), based on the same 16,824 SNPs, with a subset of the GLOBAL set that comprised all of the 2504 1000G samples and 450 TWB samples to avoid influence by a large sample size used from a single population. The minimum cross-validation error rate was obtained at K = 9 for our analysis. In the admixture plot (Supplementary Material, Fig. S1E), all East Asian groups shared higher proportions of the ancestry-assigning probabilities of K5 and K9. The six groups lay down along PC1 in the ASIAN PCA plot in an order that reflected decreasing K5 proportion, or the north-to-south trend (JPT, CHB, CHS, TWB, KHV and CDX).
Considering that within-population variations in TWB could be overshadowed and undetectable in the combined analysis with all of the 1000G multi-ethnic samples, we repeated the admixture analysis using only the ASIAN set. The minimum cross-validation error rates was obtained at K = 4, suggesting the existence of four components of ancestry. Further hierarchical clustering based on the four ancestry-assigned probabilities was also performed. Under the assumption of four ancestry populations (K1 – K4), all of the Japanese samples (denoted as J) showed a higher proportion of K2, which might present a norther origin (Fig. 1A). On the other hand, the CDX and KHV samples (denoted as D and K, respectively) shared a higher proportion of K4, which might present a southern origin (Fig. 1A). These three groups were firstly differentiated in the hierarchical cluster tree (Fig. 1B).
Figure 1.

Admixture analysis, hierarchical cluster tree and PCA plot of TWB and 1000G East Asian samples. (A) Admixture analysis. Individual probabilities for all samples were assigned under the model of four (K = 4) ancestry populations. The samples were clustered into six groups: Japanese in Tokyo, Japan (J), Chinese Dai in Xishuangbanna, China (D), Kinh in Ho Chi Minh City, Vietnam (K) and three Chinese groups (indicated by S, N and T) from TWB, and the Chinese in 1000G, including CHB (Han Chinese in Beijing, China) and Southern Han Chinese, China (CHS). The Han Chinese samples were further clustered into 9 subgroups (T1–4, N1–2 and S1–3) based on the hierarchical cluster tree below. (B) Hierarchical cluster tree based on the ancestry-assigned probabilities for the TWB and 1000G Asian samples. The Han Chinese samples, TWB, CHB and CHS, clustered in three major groups, namely northern Han Chinese (N), southern Han Chinese (S), and an unknown ancestral group of Taiwanese Han Chinese (T), whereas Japanese (J) samples clustered in another group. (C) PCA plot for the TWB, CHB, CHS, JPT, CDX and KHV populations. PC1 and PC2 are the first two components derived from the PCA. The different colours for the samples correspond to their geographical groups (J, D, K, N1–2, S1–3 and T1–4) in the hierarchical cluster tree (Fig 1B). O, others unable to be defined.
Interestingly, a novel pattern appeared among the Han Chinese samples (Fig. 1A). In addition to the north-south two-way partition, the Han Chinese samples clustered into three large groups. By the self-reported parental origins of the TWB samples (Supplementary Material, Table S2), one group was classified as the northern (N) Han Chinese, which shared the northern origin (K2) with the Japanese group. The second group was classified as the southern (S) Han Chinese, which shared the southern origin (K4) with CDX and KHV. Both S and N shared a higher proportion of K1, which indicated a major origin of Han Chinese. In addition to the S and N subgroups with higher proportions of K1, K2 and K4, a third group (T) with a relatively high K3 was detected (Fig. 1A). The emergence of this unique T group was further demonstrated by the hierarchical cluster tree; the S and N groups clustered together before the T group merged into this large branch (Fig. 1B).
Of particular note is that the newly identified T group is not a minority one. Of the TWB samples, 14.5% were classified into the T group, and 79.9 and 5% were classified into the S and N groups, respectively (Table 1). Equally interesting is that the T group is not unique in TWB, and is found in 10.7% of CHB individuals, 6.7% of CHS individuals, 2% of KHV individuals (Table 1). To better understand the nature of the T group, we then explored the self-reported ethnicity. Although the T group is more distant from S and N in the hierarchical cluster tree, 98.8% of the S group individuals and 97.1% of the T group individuals self-reported that both parents were of southern Han Chinese origin (i.e. Min-Nan, Hakka and individuals originally from other southern China provinces) compared with only 49.1% for the N group (Supplementary Material, Table S2).
Table 1.
Number and percentage of subjects of the ethnicity clusters in TWB and 1000G East Asian subjects
| Sample | T1 | T2 | T3 | T4 | T-Total | S1 | S2 | S3 | S-Total | N1 | N2 | N-Total | K | D | J | O+ | Total* |
|---|---|---|---|---|---|---|---|---|---|---|---|---|---|---|---|---|---|
| TWB | 96 | 139 | 1234 | 102 | 1571 | 126 | 5589 | 2920 | 8635 | 446 | 99 | 545 | 10 | 4 | – | 36 | 10801 |
| 0.9% | 1.3% | 11.4% | 0.9% | 14.5% | 1.2% | 51.7% | 27.0% | 79.9% | 4.1% | 0.9% | 5.0% | 0.1% | – | – | 0.3% | 100% | |
| CHB | – | 1 | 4 | 6 | 11 | 1 | 17 | – | 18 | 34 | 38 | 72 | – | – | – | 2 | 103 |
| – | 1.0% | 3.9% | 5.8% | 10.7% | 1.0% | 16.5% | – | 17.5% | 33.0% | 36.9% | 69.9% | – | – | – | 1.9% | 100% | |
| CHS | – | 1 | 4 | 2 | 7 | 11 | 55 | 26 | 92 | 2 | 1 | 3 | – | – | – | 3 | 105 |
| – | 1.0% | 3.8% | 1.9% | 6.7% | 10.5% | 52.4% | 24.8% | 87.6% | 1.9% | 1.0% | 2.9% | – | – | – | 2.9% | 100% | |
| JPT | – | – | – | – | – | – | – | – | – | – | - | – | – | – | 104 | – | 104 |
| – | – | – | – | – | – | – | – | – | – | - | – | – | – | 100% | – | 100% | |
| CDX | – | – | – | – | – | – | – | – | – | – | - | – | 8 | 70 | – | 15 | 93 |
| – | – | – | – | – | – | – | – | – | – | - | – | 8.6% | 75.3% | – | 16.1% | 100% | |
| KHV | – | 1 | 1 | – | 2 | 3 | – | – | 3 | – | - | – | 44 | 29 | – | 21 | 99 |
| – | 1.0% | 1.0% | – | 2.0% | 3.0% | – | – | 3.0% | – | - | – | 44.4% | 29.3% | – | 21.2% | 100% |
Number of individuals and percentage by row.
+Others, unable to be defined.
We further annotated the groups in the PCA plot of the ASIAN set (Fig. 1C). The PC1 values reflected the geographic latitudes of the ancestral origins of the J, N, S, K and D samples from north to south. PC2, on the other hand, distinguish the T group from the N and S groups (Fig. 1C). This unique pattern substantially departs from the north–south division in Han Chinese that has been observed in previous studies (8,9) and is reminiscent of a distinct T group (T1, which differentiated very early from the rest of the sample in hierarchical clustering) forming a gradient of different proportion of admixture with the S group in this sample of Han Chinese from Taiwan.
Given these patterns, we then focused on the three-group division model of Taiwanese and further divided the three groups into nine subgroups (S1-S3, N1-N2 and T1-T4) by hierarchical clustering (Fig. 1B). Notably, although the T group could be detected in CHB and CHS samples, none of the CHB or CHD individuals belonged to the T1 subgroup (Table 1). The fixation index (FST) (21) was also estimated among the nine subgroups of TWB (Supplementary Material, Table S3). The FST values were small (0–0.008) but reflected, in part, the inter-group correlations revealed by the admixture analysis.
We annotated the nine subgroups under the assumption of K = 4 ancestry populations in the PCA plot of the ASIAN set (Fig. 1C). Three Han Chinese subgroups located at the vertices of the triangle (N2, S2 and T1) represent three distant populations, whereas the other Han Chinese subgroups, except for S1, may represent admixture populations of the three distant populations (Fig. 1C). On the other hand, the S1 samples were sporadically distributed at the southern end of Han Chinese and close to the southern Asian groups K and D, suggesting an admixture of Han Chinese and more southern origins. This is consistent with the observation that the S1 subgroup is genetically distant from the other S subgroups, as suggested by the early split of S1 from the other S samples in the hierarchical cluster tree (Fig. 1B). We note that the four subgroups (N2, S1, S2 and T1) are evenly distributed across the Taiwan Island with no obvious clustering pattern (Supplementary Material, Fig. S2), attesting to the internal homogenization with respect to geography of the island since the immigration event over the last few centuries.
To explore the origin of the T group, we performed additional PCAs to correlate the four distinct groups in Taiwan with the ethnic groups from the HUGO Pan Asian SNP Consortium (PASNP) (22,23). In the PCA plot for TWB and neighbouring PASNP subgroups, although based on different sets of SNPs, the TWB individuals remained in the triangle pattern of geographic distribution (Fig. 2). In particular, the S1 subgroup was close to the Taiwan Austronesian groups (the Ami and Atayal samples of PASNP). This supported the hypothesis that the S1 samples may be an admixture of southern Han Chinese and further origins, possibly Austronesian populations. In the PCA plot, the three distinct groups (N2, S2 and S1) demonstrated the north–south trend in the genetic profiles in terms of PC1 values, whereas T1, with distinct PC2 values, was distinct from all the Asian and Austronesian groups in PASNP (Fig. 2) and 1000G (Fig. 1C), implying that current understanding of the migration history of Han Chinese to Taiwan provides little explanation of the origin of the T group. Because Portuguese, Spanish and Dutch settlements were established in Taiwan during the Age of Discovery in the 17th century before Han Chinese began immigrating to the island (1), it might be that T1 is an admixture of early Taiwanese and Europeans. However, the finding that the T ancestral origin can also be found in CHB (Table 1), and that it showed no clear affinity towards 1000G European samples (Supplementary Material, Fig. S1A), makes this explanation less plausible. Furthermore, the finding that T1 is distinct from the north–south gradient seen in Asian populations excludes the possibility of Japanese ancestral origin for the T group seen in modern Taiwanese, although Taiwan was occupied and governed by the Japanese for 50 years before World War II (1).
Figure 2.

PCA plots for the TWB and neighbouring ethnic groups from PASNP and 1000G. PCA plot for samples from TWB (TWB), 1000G (CHB and JPT), and PASNP (Min-Nan, Hakka, Ami and Atayal samples from Taiwan; Zhuang, Hmong, Jiamao, Han [Cantonese], and Han [Mandarin] samples from Mainland China; and the Korean samples).
GWASs to differentiate between three groups of Taiwanese Han Chinese
To detect differences between the S and T groups, which could provide clues to the origin of T, a GWAS was carried out (S-T GWAS); the S1 and T4 samples were excluded to avoid the influence of outliers. A total of 4,416 SNPs showed genome-wide significance (P < 10−50, Fig. 3A), including 1,285 top SNPs with extremely low P-values (P < 10−300). Interestingly, all of the 1285 top SNPs were located across the major histocompatibility complex (MHC) region of chromosome 6.
Figure 3.

GWASs among the subgroups of TWB samples. (A) Manhattan plot for the S-T GWAS comparing the majority of the S samples (S2 and S3) of TWB to the majority of the T samples (T1–T3) of TWB. S1 and T4 were excluded to eliminate the influence of outliers. (B) Manhattan plot for the N-S GWAS comparing the northern samples (N) of TWB to the southern samples (S2 and S3) of TWB.
Given the very-stringent criterion to select independent SNPs used in analyses, it is interesting that the top SNPs were all located in the MHC region. Therefore, it is notable that long-range LD (r2 > 0.8) was found among the 1285 top SNPs in the MHC region in the southern Han Chinese (Fig. 4A) but not in the northern Han Chinese (Fig. 4B). A gradient from high to low major allele frequency (MAF) of these SNPs among subgroups was noted (Fig. 4C). Within the T1 subgroup, most major alleles (hereafter denoted as T1-alleles) for the 1285 SNPs had the highest average allele frequency of 0.85 (SD = 0.15), compared with 0.51 (SD = 0.10) for T2 and T3 and 0.13 (SD = 0.09) for S2 and S3 (Fig. 4C). This strongly suggested the T1-alleles to be the signature alleles of the T group.
Figure 4.

SNPs in the MHC region differentiate the T and other groups of TWB samples. (A) Long-range LD between the top 1,285 SNPs in the MHC region identified by the S-T GWAS for the southern Han Chinese. Many pairs of SNPs showed high degree of LD (r2> 0.9; coloured in red) in the southern Han Chinese. In contrast, no such long-range LD was found in northern Han Chinese (B). (C) Allele frequencies of major alleles (with respect to the T group) of the top SNPs identified in the S-T GWAS. (D) Haplotype similarity heat map of the MHC region of chromosome 6 among the S, N and T groups of TWB. Fifty representative samples were randomly selected from each of the other nine subgroups.
In comparison, another GWAS comparing the northern (N) and southern (S2 and S3) groups (N-S GWAS) showed a different picture. A total of 958 SNPs showed significant differences between the two groups, with P < 10−10 (Fig. 3B). A trend in allele frequencies was seen from the northern to the southern subgroups at some of these SNPs (Supplementary Material, Fig. S3). However, inconsistency in the north–south trend at many of these top SNPs demonstrated the complex blending between the northern and southern Han Chinese.
Because most of the top SNPs of the two GWASs clustered in the MHC region, exploration of the haplotype structure of this region was essential to understand the origin of the T group. We employed fineSTRUCTURE (24) to examine the degree of haplotype similarity among groups and subgroups based on a combined set of 5,677 top SNPs located in the MHC region (29∼33Mb) on chromosome 6. At the group level, these SNPs could clearly differentiate the T group from the non-T groups, including N and S, but they could not differentiate N from S (Fig. 4D). At the individual level, the haplotype similarity was higher among individuals from the same subgroup than from different subgroups (Supplementary Material, Fig. S4).
Correlation between the T group and the human leukocyte antigen (HLA) a*33:03-B*58:01 haplotype
Based on the observations of (a) the long-range LD among the MHC SNPs of the S-T GWAS, (b) the spectrum of T1-allele frequencies across the subgroups of S and T and (c) the higher haplotype similarity within each of the subgroups in T, we hypothesized that there might be two major groups of underlying ancestral MHC haplotypes in the southern Han Chinese (S and T), one with the T1-alleles and one without. This led us to explore the relationship between the T1-alleles and the traditional HLA genotypes in an independent reference of 442 Taiwanese Han Chinese (25) that were HLA-genotyped. Of the eight most common HLA A-B haplotypes (frequency > 2%, Supplementary Material, Table S4), A*11:01-B*40:01 was the most common in Taiwanese, but, interestingly, A*33:03-B*58:01 was the most common in the T group. Furthermore, A*33:03-B*58:01 was linked to the T1-allele of a representative SNP (rs2233947), whereas the other major haplotypes were linked to the alternative allele (Supplementary Material, Table S5). These results support the model of two-haplotype groups in the MHC region. We then imputed genotypes at the HLA-A and -B loci for the TWB samples using HIBAG (26) with 36,763 SNPs on chromosome 6. The proportion of A*33:03-B*58:01 was estimated to be 91.2% for the T1 subgroup and 49.6% for the T group, showing a decreasing trend from T1 to T4 (Supplementary Material, Fig. S5), consistent with what was seen in the PCA (Fig. 1C). In sharp contrast, this haplotype was relatively rare in the S or N groups (Supplementary Material, Fig. S5). Thus, A*33:03-B*58:01 could be considered a genetic marker to trace the T group. We further genotyped the HLA*A and B loci in a set of 200 southern Han Chinese randomly selected from S and T groups. A*33:03-B*58:01 showed much higher LD (r2) with SNPs across the MHC region than the other HLA A-B haplotypes (Fig. 5), particularly in the region (highlighted in Fig. 5) containing the SNPs showing significance in the S-T GWAS analysis.
Figure 5.
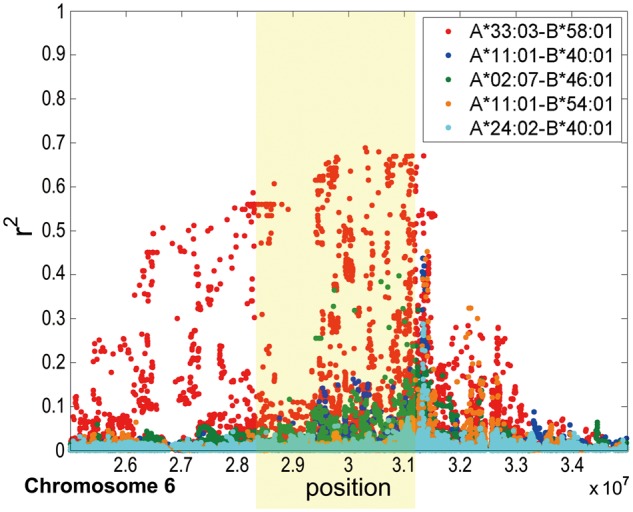
The LD (r2) between HLA A-B haplotype and SNPs in MHC regions. The HLA A*33:03-B*58:01 haplotype showed the strongest LD within the S-T GWAS-significant MHC region of Chromosome 6. The highlighted region contains the significant SNPs detected in the S-T GWAS.
Physical height differs significantly among ethnic groups
Our suggestion, based on the genetic evidence presented above, of the distinct population structure of modern Taiwanese or Chinese would be strengthened by evidence of phenotypic differences. However, the relatively limited sources of immigration into Taiwan and the Taiwanese-specific lifestyle and dietary patterns developed over the past 60 years that are shared by most Taiwanese individuals regardless of their ancestral or geographic origins in China suggest that phenotypic differences, if they exist, could be minimal. In general, our findings are in line with this assumption, as no significant differences were found in physical measures (e.g. lung function) or biochemical indices (e.g. cholesterol or uric acid) among groups or subgroups. The only exception was height; among male participant in the TWB, height differed significantly among subgroups (P < 0.0001). In particular, the subgroups with northern Han Chinese origins (N) or admixtures with northern Han Chinese ancestry (T4) were taller than the subgroups with southern Han Chinese ancestry (S2–S3, T1–T3). This finding of a northern-to-southern decrease in height is consistent with what has been observed in other populations (27–29). More notably, the comparison between S2/S3 (i.e. southern Han Chinese without T origin) and T1–T4 (southern Han Chinese with T origin) revealed a significant difference in height (Supplementary Material, Fig. S6). Because height is a classical polygenic trait that can provide general insights into the genetic architecture of human populations (27–29), the unique features and differences in height among groups favours the presence of the T origin of modern Taiwanese.
GWAS for type 2 diabetes
To illustrate the use of the phenotypes of the TWB subjects and the population structure discovered, we performed two GWASs for type 2 diabetes, one for the southern Han Chinese (S and T, excluding T4 and S1) and one for the northern Han Chinese (N1 and N2). The GWAS for the southern Han Chinese showed a stretch of 82 SNPs, located in the CDKL1 (cyclin-dependent kinase 5 regulatory subunit associated protein 1-like 1) gene on chromosome 6, reached the genome-wide significance (P < 9.4×10⁻⁹, Fig. 6A). The CDKL1 gene has been showed to be associated with type 2 diabetes and to be associated with decreased pancreatic β-cell function (30). Note that all SNPs, including the SNPs in CDKL1, did not show significant evidence in the GWAS for the norther Han Chinese (Fig. 6B). In particular, 41 of the 82 top SNPs showed moderate heterogeneity between the southern and northern Han Chinese of TWB (I2 ranged from 10.9 to 67.9). Further heterogeneity tests showed no evidence of heterogeneity between the S and T groups of TWB with respect to these top SNPs (80 of the 82 SNPs had I2 < 1.0).
Figure 6.

GWASs of type 2 diabetes in the southern and northern Han Chinese of TWB samples. (A) Manhattan plot for the GWAS of type 2 diabetes comparing within the southern samples of TWB (S and T, where S1 and T4 were excluded to eliminate the influence of outliers). (B) Manhattan plot for the GWAS of type 2 diabetes comparing with the northern samples (N1 and N2) of TWB. Red lines in Manhattan plots indicate the level of GWAS significance (P < 9.4 × 10⁻⁹).
Taiwan view
The Taiwan View website (https://taiwanview.twbiobank.org.tw/index; date last accessed October 14, 2016) was developed in association with this TWB project to ensure public access to the annotations and summary statistics of the TWB, i.e. chromosome, position, SNP ID, reference allele, alternative allele, counts of three genotypes and call rate. This website also provides an online query webpage for SNP information and an online GWAS platform that allows users to upload their genotype data and perform GWASs using the Cochran–Armitage trend test. The number of autosomal SNPs covered by Taiwan View has been extended by imputation from the original 591,048 SNPs to 5,314,467 SNPs.
Discussion
This study provides a broad view of the genetic background of the Han Chinese populations in Taiwan and may lead to a better understanding of the genetic ancestry of the tens of millions of Chinese who reside outside of China, many of whom, similar to Taiwanese, share ancestral origins in the southeast provinces of Fujian and Guangdong in China (31). Our findings suggest that the Taiwanese Han Chinese not only share a common genetic background with other Han Chinese populations worldwide, with different proportions of northern and southern Han Chinese ancestry, but, importantly, there are within-southern-Han Chinese distinctions that were not previously reported. We estimate that ∼14.5% of the current Taiwanese population (∼3.4 million people) belongs to this T group, dominated by a specific haplotypic pattern of the MHC locus: the long-range LD in the MHC region and the high frequency of the HLA haplotype A*33:03-B*58:01 (9%) in the Taiwanese Han Chinese. HLA A*33:03-B*58:01 is specifically distributed in populations residing in the southeastern coast of Asia, with the highest proportion detected in Fujian and Guangdong of China (6–8%) (Supplementary Material, Fig. S7, prepared based on http://www.allelefrequencies.net/; date last accessed October 14, 2016). This proportion is gradually decreasing in populations in northern and distant inner regions of China. The high frequency of HLA A*33:03-B*58:01 in the Han Chinese in Taiwan and overseas Han Chinese populations could largely be due to the fact that the majority of their ancestors were from Fujian and Guangdong. The distribution of HLA A*33:03-B*58:01 in Asian populations could be modelled by setting Fujian and Guangdong as the origins of this haplotype before its recent migration/expansion into East Asia.
However, the S-T GWAS analysis revealed a high degree of similarity between the S and T groups. As all of the top associated SNPs in the S-T GWAS were found in the MHC region indicated that, except the MHC region, the S and T groups are similar, in terms of the allele frequency distribution, across the genome. In fact, when we performed PCA of the TWB sample with the 1000G East Asian samples across over 170,000 SNPs genome-wide (Supplementary Material, Fig. S8A), we saw the similar triangle pattern and the locations of the subgroups to our earlier findings (Fig. 1C) when chromosome 6 was included. However, the PCA analysis without chromosome 6 showed that all members of the T group were located near the centre of the southern Han Chinese (Supplementary Material, Fig. S8B). This clearly indicated that the delineation of the T group depended solely on the extended haplotype containing HLA A*33:03-B*58:01. This raises one possibility that HLA A*33:03-B*58:01 is locally adaptive in the ancestors of these southern Han Chinese, particularly given the more extended haplotypic pattern in southern Han Chinese compared to northern Han Chinese (Fig. 4A and B). Although the effect is likely not nearly as strong, this is reminiscent of the high-altitude adaptation in Han and Tibetan Chinese (32). Furthermore, the slower decay of LD of the extended haplotype containing HLA A*33:03-B*58:01 might result from fewer recombination events between the ancestry haplotype containing A*33:03-B*58:01 and other ancestry haplotypes. This suggested the other not-mutually exclusive possibility that A*33:03-B*58:01 carriers (presumably the T group) entered the southern Han Chinese in the more recent past. The timing, origin, and the pattern of spread of A*33:03-B*58:01 haplotype will require further investigation and may require samples from Han Chinese living on the southeast coast of China and from Taiwanese aboriginal tribes.
It has been suggested that regions with long-range LD, such as the MHC region, should be excluded from PCA as these regions could dominate particular PC axes and thus dilute other genome-wide patterns of variation. In light of these worries, we applied stringent criteria to prune SNPs by LD to lessen the impact of long-range LD. Given the biological importance of the MHC region in shaping the evolution of a population, our investigation of the region, motivated by the strong influence it has on an otherwise homogeneous population of Han Chinese in Taiwan, led to valuable insights. Our conclusions point to an important role the MHC region has played on establishing Taiwanese Han Chinese population structure, which would not have been detected if the region is simply removed from the analysis despite its known importance.
The identification of the T group is meaningful in two ways. First, this is the first study to dissect the population structure of a particular Han Chinese population along the second PC, whereas previous studies (8,9) could only relate the north–south trend (the first PC) to latitude of the subjects and left the large variation along the second (and lower) PC unexplained. While it is possible that the MHC-driven pattern of the second PC may be particular to the Taiwanese population due to their relatively homogeneous origin from the southeast coast of China, our framework to investigate lower PCs that do not clearly correlate with geography may be useful for bringing biological insights in interpreting other studies of population structure. The unique genetic pattern of the T group also provides insight for personalized medical research in the Taiwanese/southern Han Chinese in the future. For example, the T1-allele/A*33:03-B*58:01 has been suggested to be associated with the development of nasopharyngeal carcinoma (33), which shows low incidence throughout most populations in the world but is common in southern Chinese and southeast Asian populations (34). We have also recently demonstrated a causal link between the T1 allele and the development of severe side-effects from allopurinol, a drug commonly used to reduce uric acid and to treat gout (35).
Our findings also underscore the importance of the large sample sizes generated by the biobanks worldwide. For example, in the PCAs with three subsets of 1679 (15%), 3467 (32%) and 7200 (67%) samples selected randomly from TWB and all samples of the 1000G Asian groups, the S and T groups clustered together in the first two PCs (the upper panels of Supplementary Material, Fig. S9A–C) and the differentiation among them was only detected in the third PC of the 3467 and 7200 sets (the lower panels of Supplementary Material, Fig. S9A–C). Previous GWAS of Taiwanese Han Chinese (10–14) had failed to detect the tripartite population stratification that we highlight here, likely due to the limitation of small sample sizes (all less than 2,500) of these previous studies. On the other hand, the successful replication of the association between CDKL1 and type 2 diabetes in the southern Han Chinese demonstrated the advantage of using a large sample with a homogeneous genetic background. However, obtaining large numbers of reference samples with a genetic background matched to disease samples is difficult for logistical and ethical reasons. To the best of our knowledge, TWB is the first and largest publically available Asian reference cohort. Through this study, the TWB has released the largest genome-wide genotype statistics for Han Chinese, providing appropriate statistical power to detect susceptibility variants (Supplementary Material, Table S6), and the publicly accessible web-based calculation platform, Taiwan View (36), has been built to carry out GWASs using current control data.
The southern Han Chinese population, including Taiwanese, is one of the largest populations in the world undergoing substantial lifestyle changes and, consequently, disease/health transitions, owing to an economic boom in recent decades. The findings of this study and the associated database provide crucial and unique information and tools for exploring population-specific genes and environment/diet interactions and for developing individualized disease prevention and intervention strategies.
Materials and Methods
Sample collection and QC
As of the submission date, 60,000 reference participants have been recruited across Taiwan by the TWB. Written informed consent was obtained from each participant in accordance with institutional requirements and the Declaration of Helsinki principles. This study is approved by the IRB on Biomedical Science Research/IRB-BM Academia Sinica, Taiwan, and by the Ethics and Governance Council (EGC) of Taiwan Biobank, Taiwan. Taiwan Biobank is governed by the EGC and the Ministry of Health and Welfare. All participants self-reported as being of Han Chinese ancestry. For the present study, we genotyped 12,350 individuals for the current data release, including 167 technical replicates. We further excluded 80 samples with low call rates, 1183 samples from individuals with uncertain kinship, and 119 samples from individuals without follow-up visits. The remaining 10,801 individuals formed the primary analysis dataset for this study. Details of the detection of uncertain kinship and the ethnicity outliers are given in Supplementary Material, Fig. S10.
Design of the TWB genotype array
To efficiently obtain maximal genetic information from samples obtained from Taiwanese Han Chinese, we designed the TWB genotype array for the high-throughput Affymetrix Axiom genotyping platform. SNPs on the Axiom Genome-Wide CHB 1 Array plate (Affymetrix, Inc., Santa Clara, CA, USA) with MAFs ≥5% in a set of 1950 samples from Taiwanese Han Chinese previously genotyped at the National Center of Genome Medicine of the Academia Sinica, Taipei, Taiwan were selected for the new TWB array. SNPs in exons were also selected if the MAFs were >10% in a test set of 600 Taiwanese Han Chinese using the Human Exome BeadChip (Illumina, Inc., San Diego, CA, USA). The TWB array also included SNPs previously reported in ancestry information panels (37), GWASs and cancer studies (38), and pharmacogenetic panels (39). The number of selected SNPs was greater than that allowed on the chip, and thus a representative subset of ∼650,000 SNPs was selected to provide maximal coverage (R2 > 0.8) of the human genome. To evaluate the genotyping accuracy of the TWB chip, 70 unrelated Taiwanese Han Chinese individuals were genotyped using both the TWB array and the CHB array, and the results showed a high average concordance rate (99.55%) for the 512,065 SNPs in the 70 samples. The design of the TWB array was a joint effort of the TWB, the National Center of Genome Medicine, and Affymetrix, Inc. All genotyping was performed by the National Center of Genome Medicine in Taiwan.
Population stratification and detection of uncertain kinships
To avoid the influence of inter-marker LD on the following analyses, a set of 16,824 presumably unlinked SNPs evenly spaced across the human genome were selected from the overlapping set of SNPs from the TWB array and a set of 44,524 SNPs from a previous cross-population GWAS (18). These SNPs were selected to have pairwise LD < 0.3 in a sliding window of 5 Mb, which is more stringent than in previous studies (8,9,18,19)
Detection of population stratification was carried out using TWB samples and 2,504 samples from 1000G (40). PCA was performed using EIGENSTRAT (15) to construct the graphical location (coordinates PC1 and 2) of the individuals (Supplementary Material, Fig. S10A). Detection of uncertain kinships was carried out based on the identity by state (IBS) scores implemented in PLINK 1.07 (http://pngu.mgh.harvard.edu/purcell/plink/; date last accessed October 14, 2016, (41)) with the 16,824 SNPs (Supplementary Material, Fig. S10B).
Admixture and hierarchical clustering analyses
Using the set of 16,824 SNPs described above, admixture analysis was performed using a cross-validation algorithm implemented in ADMIXTURE (20) to estimate the probability that each individual was accurately assigned to each ancestral population. The procedure was performed using different numbers of ancestral populations, denoted as K. The best estimate of K was with the lowest cross-validation error. The assigned ancestral probabilities based on the best estimate of K were then used to cluster the individuals into homogenous groups using agglomerative hierarchical clustering with average linkage. The fixation index between clusters, FST (21), was calculated using R/snpStats (42).
Genome-wide association study (GWAS)
GWASs using Armitage's trend test (implemented in PLINK (41)) were performed to compare the clusters identified by the admixture analysis. Haplotype frequency estimation for the clusters was carried out in regions with multiple significant GWAS-identified SNPs using Haplo.stat (http://www.mayo.edu/research/labs/statistical-genetics-genetic-epidemiology/software; date last accessed October 14, 2016) and Haploview (43). Gene ontology analysis implemented in MetaCore (Thomson Reuters, New York, NY, USA) was performed to link functions to the top SNPs in the GWAS.
fineSTRUCTURE analysis
The fineSTRUCTURE analysis (24) was carried out based on all 5,678 top SNPs located in the MHC regions on chromosome 6. Fifty representative samples were randomly selected from each of the other nine subgroups. Pre-analysis haplotype phasing was carried out using SHAPEIT (https://mathgen.stats.ox.ac.uk/genetics_software/shapeit/shapeit.html; date last accessed October 14, 2016).
Imputation
The imputation of the data from the 10,801 individuals was carried out using IMPUTE2 (version 2.2.0, http://mathgen.stats.ox.ac.uk/impute/impute_v2.html; date last accessed October 14, 2016) with a reference derived from the 1000G Project (1000 Genomes Phase I integrated variant set, NCBI B37, http://mathgen.stats.ox.ac.uk/impute/data_download_1000G_phase1_integrated.html; date last accessed October 14, 2016). For each SNP and each individual, an imputed genotype was initially specified using the probability of each of the three possible genotypes. The genotype with the maximum probability was considered the genotype if the maximum probability was ≥0.9 (the calling threshold). Genotypes with probabilities of <0.9 were classified as missing. Further quality-control filters were also applied for each SNP: call rate > 95%, MAF > 0.01 and Hardy-Weinberg equilibrium test P > 10−2.
Analysis of type 2 diabetes using TWB
A subject would be categorized as a case of type 2 diabetes if he/she self-reported being diagnosed with type 2 diabetes or 8-h fasting blood glucose greater than 126 mg/dl or HbA1c greater than 6.5% at the time of examination. A subject would be categorized as a control if he/she self-reported never being diagnosed with type 2 diabetes and, at the time of examination, the 8-h fasting blood glucose was less than 100 mg/dl and HbA1c was between 4–6%. The logistic regression model was used to test the association between the disease status and each SNP, adjusted for age, sex, BMI, and the first 10 PCs. Imputed data of 30,046,744SNPs were filtered through the above QC criteria. A total of 5,303,129 qualified SNPs were advanced to further tests. The genome-wide significance level was then set at 9.4×10⁻⁹, after adjusted for multiple comparisons.
Supplementary Material
Supplementary Material is available at HMG online.
Supplementary Material
Acknowledgements
We thank Dr. Tien-Chun Chang of National Taiwan University Hospital, Taipei, Taiwan and Dr. Cathy S.J. Fann of Academia Sinica, Taipei, Taiwan, for providing us the HLA genotype data.
Conflict of Interest statement. None declared.
Funding
Taiwan Biobank is a national infrastructure, and is operated by the national health and science budget of Taiwan. This study is partially supported by Academia Sinica, Taipei, Taiwan (Academia Sinica Genomic Medicine Multicenter Study). C.W.K.C. is supported by a National Institutes of Health (NIH) grant T32NS048004 from National Institute of Neurological Disorders and Strokes.
References
- 1. Executive Yuan, the Republic of China (Taiwan) (2013) The Republic of China Yearbook, 2013.
- 2. Lee M.T., Chen C.H., Chen Y.T. (2012) Genomic Medicine in Taiwan: Research and Developments, In Genomics and Health in the Developing World, Oxford University Press, ISBN-13: 9780195374759, pp. 874–885. [Google Scholar]
- 3. Lin M., Chu C.C., Chang S.L., Lee H.L., Loo J.H., Akaza T., Juji T., Ohashi J., Tokunaga K. (2001) The origin of Minnan and Hakka, the so-called "Taiwanese", inferred by HLA study. Tissue Antigens, 57, 192–199. [DOI] [PubMed] [Google Scholar]
- 4. Hakka Affairs Council, Executive Yuan, Taiwan (R.O.C.) (2004) Survey on National Hakka Population Basic Data., Taipei, Taiwan. [Google Scholar]
- 5. Reich D., Price A.L., Patterson N. (2008) Principal component analysis of genetic data. Nat. Genet., 40, 491–492. [DOI] [PubMed] [Google Scholar]
- 6. McVean G. (2009) A genealogical interpretation of principal components analysis. PLoS Genet., 5, e1000686.. [DOI] [PMC free article] [PubMed] [Google Scholar]
- 7. Goldinger A., Henders A.K., McRae A.F., Martin N.G., Gibson G., Montgomery G.W., Visscher P.M., Powell J.E. (2013) Genetic and nongenetic variation revealed for the principal components of human gene expression. Genetics, 195, 1117–1128. [DOI] [PMC free article] [PubMed] [Google Scholar]
- 8. Xu S., Yin X., Li S., Jin W., Lou H., Yang L., Gong X., Wang H., Shen Y., Pan X., et al. (2009) Genomic dissection of population substructure of Han Chinese and its implication in association studies. Am. J. Hum. Genet., 85, 762–774. [DOI] [PMC free article] [PubMed] [Google Scholar]
- 9. Chen J., Zheng H., Bei J.X., Sun L., Jia W.H., Li T., Zhang F., Seielstad M., Zeng Y.X., Zhang X., et al. (2009) Genetic structure of the Han Chinese population revealed by genome-wide SNP variation. Am. J. Hum. Genet., 85, 775–785. [DOI] [PMC free article] [PubMed] [Google Scholar]
- 10. Tsai F.J., Yang C.F., Chen C.C., Chuang L.M., Lu C.H., Chang C.T., Wang T.Y., Chen R.H., Shiu C.F., Liu Y.M., et al. (2010) A genome-wide association study identifies susceptibility variants for type 2 diabetes in Han Chinese. PLoS Genet., 6, e1000847.. [DOI] [PMC free article] [PubMed] [Google Scholar]
- 11. Tsai F.J., Lee Y.C., Chang J.S., Huang L.M., Huang F.Y., Chiu N.C., Chen M.R., Chi H., Lee Y.J., Chang L.C., et al. (2011) Identification of novel susceptibility Loci for kawasaki disease in a Han chinese population by a genome-wide association study. PLoS One, 6, e16853. [DOI] [PMC free article] [PubMed] [Google Scholar]
- 12. Lee M.T., Chen C.H., Lee C.S., Chen C.C., Chong M.Y., Ouyang W.C., Chiu N.Y., Chuo L.J., Chen C.Y., Tan H.K., et al. (2011) Genome-wide association study of bipolar I disorder in the Han Chinese population. Mol. Psychiatry, 16, 548–556. [DOI] [PubMed] [Google Scholar]
- 13. Liou Y.J., Wang H.H., Lee M.T., Wang S.C., Chiang H.L., Chen C.C., Lin C.H., Chung M.S., Kuo C.C., Liao D.L., et al. (2012) Genome-wide association study of treatment refractory schizophrenia in Han Chinese. PLoS One, 7, e33598. [DOI] [PMC free article] [PubMed] [Google Scholar]
- 14. Lee Y.C., Kuo H.C., Chang J.S., Chang L.Y., Huang L.M., Chen M.R., Liang C.D., Chi H., Huang F.Y., Lee M.L., et al. (2012) Two new susceptibility loci for Kawasaki disease identified through genome-wide association analysis. Nat. Genet., 44, 522–525. [DOI] [PubMed] [Google Scholar]
- 15. Price A.L., Patterson N.J., Plenge R.M., Weinblatt M.E., Shadick N.A., Reich D. (2006) Principal components analysis corrects for stratification in genome-wide association studies. Nat. Genet., 38, 904–909. [DOI] [PubMed] [Google Scholar]
- 16. The 1000 Genomes Project, C., Abecasis G.R., Auton A., Brooks L.D., DePristo M.A., Durbin R.M., Handsaker R.E., Kang H.M., Marth G.T., McVean G.A. (2012) An integrated map of genetic variation from 1,092 human genomes. Nature, 491, 56–65. [DOI] [PMC free article] [PubMed] [Google Scholar]
- 17. Price A.L., Weale M.E., Patterson N., Myers S.R., Need A.C., Shianna K.V., Ge D.L., Rotter J.I., Torres E., Taylor K.D., et al. (2008) Long-range LD can confound genome scans in admixed populations. Am. J. Hum. Genet., 83, 132–135. [DOI] [PMC free article] [PubMed] [Google Scholar]
- 18. Cho Y.S., Chen C.H., Hu C., Long J., Ong R.T., Sim X., Takeuchi F., Wu Y., Go M.J., Yamauchi T., et al. (2012) Meta-analysis of genome-wide association studies identifies eight new loci for type 2 diabetes in east Asians. Nat. Genet., 44, 67–72. [DOI] [PMC free article] [PubMed] [Google Scholar]
- 19. Lazaridis I., Patterson N., Mittnik A., Renaud G., Mallick S., Kirsanow K., Sudmant P.H., Schraiber J.G., Castellano S., Lipson M., et al. (2014) Ancient human genomes suggest three ancestral populations for present-day Europeans. Nature, 513, 409–413. [DOI] [PMC free article] [PubMed] [Google Scholar]
- 20. Alexander D.H., Novembre J., Lange K. (2009) Fast model-based estimation of ancestry in unrelated individuals. Genome Res., 19, 1655–1664. [DOI] [PMC free article] [PubMed] [Google Scholar]
- 21. Weir B.S., Cockerham C.C. (1984) Estimating F-Statistics for the Analysis of Population-Structure. Evolution, 38, 1358–1370. [DOI] [PubMed] [Google Scholar]
- 22. Consortium, H.P.-A.S., Abdulla M.A., Ahmed I., Assawamakin A., Bhak J., Brahmachari S.K., Calacal G.C., Chaurasia A., Chen C.H., Chen J., et al. (2009) Mapping human genetic diversity in Asia. Science, 326, 1541–1545. [DOI] [PubMed] [Google Scholar]
- 23. Ngamphiw C., Assawamakin A., Xu S., Shaw P.J., Yang J.O., Ghang H., Bhak J., Liu E., Tongsima S. and Consortium, H.P.-A.S. (2011) PanSNPdb: the Pan-Asian SNP genotyping database. PLoS One, 6, e21451.. [DOI] [PMC free article] [PubMed] [Google Scholar]
- 24. Lawson D.J., Hellenthal G., Myers S., Falush D. (2012) Inference of Population Structure using Dense Haplotype Data. PLoS Genetics, 8. [DOI] [PMC free article] [PubMed] [Google Scholar]
- 25. Hsieh A.R., Chang S.W., Chen P.L., Chu C.C., Hsiao C.L., Yang W.S., Chang C.C., Wu J.Y., Chen Y.T., Chang T.C., et al. (2014) Predicting HLA genotypes using unphased and flanking single-nucleotide polymorphisms in Han Chinese population. BMC Genomics, 15, 81.. [DOI] [PMC free article] [PubMed] [Google Scholar]
- 26. Zheng X., Shen J., Cox C., Wakefield J.C., Ehm M.G., Nelson M.R., Weir B.S. (2014) HIBAG–HLA genotype imputation with attribute bagging. Pharmacogenomics J., 14, 192–200. [DOI] [PMC free article] [PubMed] [Google Scholar]
- 27. Turchin M.C., Chiang C.W., Palmer C.D., Sankararaman S., Reich D., Genetic Investigation of, A.T.C. and Hirschhorn, J.N. (2012) Evidence of widespread selection on standing variation in Europe at height-associated SNPs. Nat. Genet., 44, 1015–1019. [DOI] [PMC free article] [PubMed] [Google Scholar]
- 28. Berg J.J., Coop G. (2014) A population genetic signal of polygenic adaptation. PLoS Genet., 10, e1004412.. [DOI] [PMC free article] [PubMed] [Google Scholar]
- 29. Robinson M.R., Hemani G., Medina-Gomez C., Mezzavilla M., Esko T., Shakhbazov K., Powell J.E., Vinkhuyzen A., Berndt S.I., Gustafsson S., et al. (2015) Population genetic differentiation of height and body mass index across Europe. Nat. Genet., 47, 1357–1362. [DOI] [PMC free article] [PubMed] [Google Scholar]
- 30. Pascoe L., Tura A., Patel S.K., Ibrahim I.M., Ferrannini E., Zeggini E., Weedon M.N., Mari A., Hattersley A.T., McCarthy M.I., et al. (2007) Common variants of the novel type 2 diabetes genes CDKAL1 and HHEX/IDE are associated with decreased pancreatic beta-cell function. Diabetes, 56, 3101–3104. [DOI] [PubMed] [Google Scholar]
- 31. Overseas Community Affairs Council, R.o.C.T. (1982) 50 Years of Overseas Community Affairs.
- 32. Yi X., Liang Y., Huerta-Sanchez E., Jin X., Cuo Z.X., Pool J.E., Xu X., Jiang H., Vinckenbosch N., Korneliussen T.S., et al. (2010) Sequencing of 50 human exomes reveals adaptation to high altitude. Science, 329, 75–78. [DOI] [PMC free article] [PubMed] [Google Scholar]
- 33. Hildesheim A., Apple R.J., Chen, et al. (2002) Association of HLA class I and II alleles and extended haplotypes with nasopharyngeal carcinoma in Taiwan. J. Natl Cancer Inst., 94, 1780–1789. [DOI] [PubMed] [Google Scholar]
- 34. Chang E.T., Adami H.O. (2006 Oct) The enigmatic epidemiology of nasopharyngeal carcinoma. Cancer Epidemiol Biomarkers Prev., 15, 1765–1777. [DOI] [PubMed] [Google Scholar]
- 35. Ko T.M., Tsai C.Y., Chen S.Y., et al. Use of HLA-B*58:01 genotyping to prevent allopurinol induced severe cutaneous adverse reactions in Taiwan: national prospective cohort study. BMJ, 351, h4848.. [DOI] [PMC free article] [PubMed] [Google Scholar]
- 36. https://taiwanview.twbiobank.org.tw/index; date last accessed October 14, 2016.
- 37. Kidd J.R., Friedlaender F.R., Speed W.C., Pakstis A.J., De La Vega F.M., Kidd K.K. (2011) Analyses of a set of 128 ancestry informative single-nucleotide polymorphisms in a global set of 119 population samples. Investig. Genet., 2, 1.. [DOI] [PMC free article] [PubMed] [Google Scholar]
- 38. Welter D., MacArthur J., Morales J., Burdett T., Hall P., Junkins H., Klemm A., Flicek P., Manolio T., Hindorff L., et al. (2014) The NHGRI GWAS Catalog, a curated resource of SNP-trait associations. Nucleic Acids Res., 42, D1001–D1006. [DOI] [PMC free article] [PubMed] [Google Scholar]
- 39.Affymetrix DMET Plus array, Affymetrix Inc., Santa Clara, CA, USA.
- 40.(2003) The International HapMap Project. Nature, 426, 789–796. [DOI] [PubMed] [Google Scholar]
- 41. Purcell S., Neale B., Todd-Brown K., Thomas L., Ferreira M.A., Bender D., Maller J., Sklar P., de Bakker P.I., Daly M.J., et al. (2007) PLINK: a tool set for whole-genome association and population-based linkage analyses. Am. J. Hum. Genet., 81, 559–575. [DOI] [PMC free article] [PubMed] [Google Scholar]
- 42. Clayton D. (2015). snpStats: SnpMatrix and XSnpMatrix classes and methods. R package version 1.22.0.
- 43. Barrett J.C., Fry B., Maller J., Daly M.J. (2005) Haploview: analysis and visualization of LD and haplotype maps. Bioinformatics, 21, 263–265. [DOI] [PubMed] [Google Scholar]
Associated Data
This section collects any data citations, data availability statements, or supplementary materials included in this article.