Abstract
We demonstrate a hybrid microfluidic system that combines fluidic trapping and acoustic switching to organize an array of single cells at high density. The fluidic trapping step is achieved by balancing the hydrodynamic resistances of three parallel channel segments forming a microfluidic trifurcation, the purpose of which was to capture single cells in a high-density array. Next, the cells were transferred into adjacent larger compartments by generating an array of streaming micro-vortices to move the cells to the desired streamlines in a massively parallel format. This approach can compartmentalize single cells with efficiencies of ≈67%, in compartments that have diameters on the order of ~100 um, which is an appropriate size for single cell proliferation studies, and other single cell biochemical measurements.
Keywords: single cell isolation, high throughput, bulk acoustic waves, lab-on-a-chip, microfluidics, acoustofluidics
Introduction
Single cell analysis is enabling new insights into the heterogeneity within a cell population that were previously concealed using traditional bulk ensemble measurement techniques.1–3 The field is currently receiving significant attention4–7 and is expected to open up a plethora of applications in basic and clinical research for fields ranging from oncology, to immunology, neuroscience, and beyond.8–12 Accordingly, there has been great interest in innovating new techniques that can organize single cells into discrete chambers and monitor their response to various stimuli, such as the presence of a drug, growth factor, or another cell.
One of the earliest single cell organization approaches is fluorescent activated cell sorting (FACS) which to this day is still being used to deposit single cells into each well of a 96-well or 384-well plate.13 However, this plate-based format severely limits the number of cells that can be analyzed in parallel. Additionally, the large volumes used in plate-based FACS sorting is poorly suited for growing single cells in isolation and many types of single cell measurements, such as the analysis of secreted cytokines, and cell-cell communication. Due to their smaller volumes, microfabricated single cell analysis platforms are better suited to these types of measurements6, 7, 14, and have the additional advantage of increasing the imaging speed and reducing the consumption of expensive reagents.
Single cell arrays have been organized with passive cell capture mechanisms, such as sedimentation into micro-wells or fluidic trapping in weirs,15–22 and active capture mechanisms based on the use of magnetic, electric, or acoustic field to transport cells to desired locations.23–26 Passive separation mechanisms are usually high throughput and have the advantage of reduced complexity; however, these approaches have various limitations, such as low single cell organization efficiency in the case of stochastic sedimentation approaches27–29 or high fluidic shear of progeny in the case of hydrodynamically trapped cells,21 and both are generally incapable of organizing more than one type of single cell into an array. Variations on these approaches have shown the ability to transfer the trapped cells to larger chambers, such as by inverting a microfluidic device30, 31 or by exploiting the deformability of cells to squeeze them into an adjacent compartment.32 However, it can be a challenge to automate the passive sedimentation process and exchange fluids, such as fresh media and drugs, without disturbing the assembled cell pattern. Additionally, cell damage can occur during cell deformation-based trapping approaches, which can reduce the viability of the transferred cells.
Alternatively, active field-based manipulation approaches are more programmable and can control the positions of single cells with micron precision; however, they require multi-layer devices and external power sources, which both increases complexity and suffers from other fundamental limitations. For example, magnetic circuit approaches have the advantage of easy scaling to control many thousands of single cells in parallel; however, magnetic systems require magnetic nanoparticles to label the cells and manipulate them by a magnetic force.33, 34 Dielectrophoretic approaches have the potential for label-free cell manipulation by utilizing the dielectric contrast of cells relative to the surrounding media; however, this technique is not amenable to high ionic strength fluids, such as cell culture media, and necessitates the use of isotonic buffers to allow the electric fields to penetrate the fluid. Recently developed optoelectronic approaches have similar problems as dielectrophoretic systems,35, 36 though some of these limitations have recently been surmounted with the development of phototransistors that can operate directly in cell culture media.37, 38
Acoustic approaches have demonstrated the ability to control the positions and orientations of single cells in a label-free manner, and they can additionally be operated directly in cell culture media. Importantly, these approaches have been previously shown to hold multiple cells individually39 and cluster groups of cells in microwells.40 “Bulk acoustic wave” (BAW) devices can be built from single layer silicon or glass microfluidic channels and designed to resonate at well-characterized frequencies that correspond to the device geometry.41–45 Moreover, these systems can be operated with a simple piezoelectric transducer mounted underneath the device; however, BAW devices have limited ability to change the position of the focusing nodes, and thus have mainly been used in bulk continuous flow sorting applications. Surface acoustic wave (SAW) devices can overcome some of these limitations by allowing the pressure nodes to be controlled independently of the microfluidic channel geometry.46–49
Thus, given the constraints above, it is reasonable to assert that a combination of both passive and active methods should offer the most adaptable, gentle, and parallelizable approach to organize a single cell array. Towards this end, we have developed a “trap and transfer” process, which exploits the synergistic combination of passive hydrodynamic trapping to establish the initial positions of the single cells in an array, and then an active acoustic transfer step to move the cells to larger chambers that are more suitable for single cell measurements. After considering the different acoustic transfer approaches, we ultimately decided to use a BAW transfer mechanism because of its simplicity, biocompatibility, and because the microfluidic and acoustic functionality can be seamlessly integrated into a single device layer. Uniquely, our hybrid BAW transfer process demonstrates for the first time the parallel, high-precision manipulation of individual cells with an array of acoustically induced streaming vortices. With this approach, we have generated an array of single cells in low-shear compartments with an efficiency of ≈67 %.
Results and Discussion
The basic setup is shown in Figure 1(a-b), presenting one of several different chip designs. This chip has dimensions consistent with a glass slide (i.e. 25 × 75 mm) and fits 3,840 individual compartments. This design consists of 96 parallel microfluidic channels, each having 40 compartments in series at an areal density of approximately 4 compartments per mm2 (cmpts/mm2). We have also tested smaller devices with the same basic design that have a footprint of 15 mm x 25 mm consisting of 16 parallel channels with 31 compartments in series with a total of 496 compartments. To demonstrate the feasibility of higher density designs, we also tested chips that have a density of ≈12 cmpts/mm2, allowing for more than 5,000 cells to be organized in a device the size of a glass slide (see Electronic Supplementary Information for Alternative Microfluidic Designs).
Figure 1.
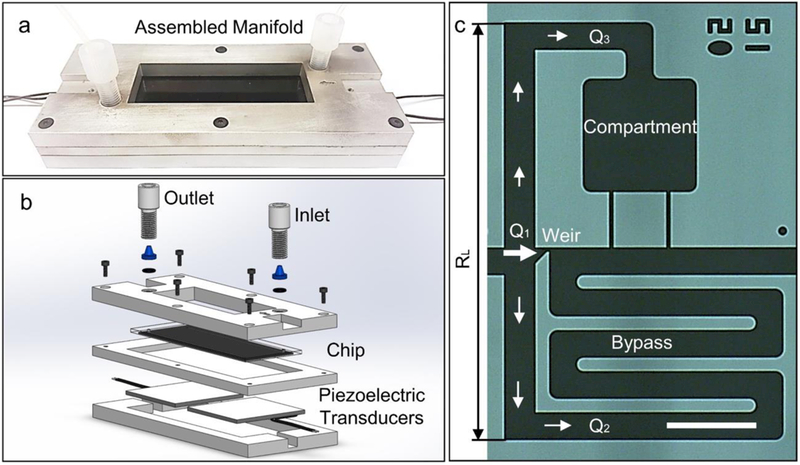
Acoustofluidic single cell array. (a) Image of chip in the aluminum manifold. (b) Schematic of entire set-up indicating the location of the chip, inlet, outlet, and piezoelectric transducers. Here, the piezoelectric transducers were acoustically coupled to the microfluidic chip using electrode gel (see Materials and Methods for more details).” (c) Image of individual acoustofluidic element with characteristic length (RL) and comprised of a weir (1), bypass (2), and compartment region (3). Scale bar indicates 100 μm.
The basic switching junction is a trifurcation, consisting of the weir (i.e. primary trap site), a bypass channel, and a cellular compartment (Figure 1(c)). The hydrodynamic flow profile was finely tuned to reliably capture single cells at the weirs, without unintentionally transferring the cells into the compartments, except when desired.
Design of Hydrodynamic Circuit
We optimized the hydrodynamic trapping step by tuning the three volumetric flow rates (Q1,Q2,and Q3), in which the hydrodynamic resistance of each branch is carefully controlled. The overall pressure drop across the trifurcation allows the fluidic path to be modeled as three parallel resistive paths, with each segment approximated by the well-known approximation for hydrodynamic resistance in a rectangular channel:50
| (1) |
where η is the dynamic viscosity of the fluid, L is the length of the channel, and where w and h represent the cross-sectional dimensions of the channel, in which the smaller of the two dimensions is defined as h. The geometry of the weirs is designed such that an unoccupied weir has the lowest fluidic resistance, whereas an occupied weir has higher fluidic resistance than the bypass channel. This design ensures that after a weir traps a single cell, subsequent cells are diverted towards the bypass channel until one of them gets trapped in the next unoccupied weir. This process allows the weirs across the entire chip to be loaded within minutes.
Since our device was fabricated through single-level Silicon etch, we tuned the fluid resistances by adjusting the lengths and widths of each channel section. The bypass channel was designed to have a width commensurate to several cell diameters (in our case 35 μm), which helped to reduce clogging but required long serpentine bypass channels to match the desired resistance ratios. The weirs have widths of 6 μm and lengths of 4 μm, from which we derive a condition that the length of the bypass channel must be at least ~1mm long to maintain the condition R2/R1>2, which ensures that most fluid flow goes through the trap as compared to the bypass segment, thus increasing the probability of capturing cells in the weirs. To avoid unintentionally moving cells into the compartments prematurely, we included physical constrictions in the compartment region to raise the fluidic resistance. This section was designed to achieve a resistance ratio R3/R2>2 with a similar purpose of biasing most fluid flow to go through the bypass segment compared to the compartment. To visualize the flow patterns, we show COMSOL calculations of the normalized velocity for the case when the weir is occupied (Figure 2(a)) or is empty (Figure 2(b)). As expected, the flow velocity is highest through the unoccupied weir, followed by the bypass region, and finally lowest through the compartment region and occupied weir (Figure 2(c)).
Figure 2.
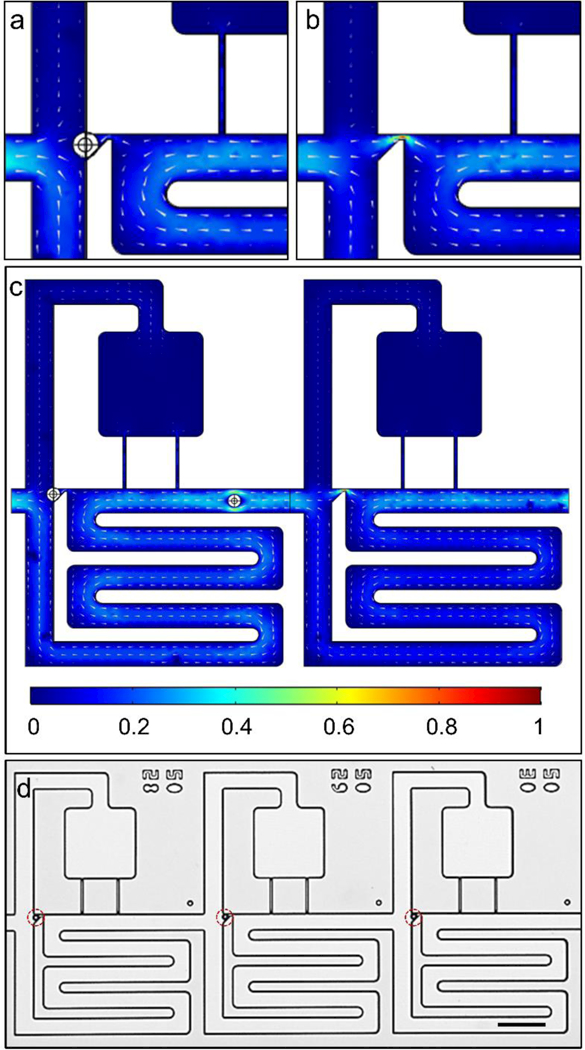
Demonstration of hydrodynamic trapping in trifurcation design. COMSOL simulation of an (a) occluded weir, (b) unoccupied weir, and (c) the entire acoustofluidic element. (d) Beads captured in trap sites of acoustofluidic array. Legend indicates normalized velocity and scale bar represents 100 μm.
Based on these simulations for the velocity field, we calculated the volumetric flow rate by averaging the velocity across planes entering the trap, bypass, and compartment region then multiplying by the corresponding cross-sectional area. In this way, we obtained values of Q1/Q2 ≈ 2.4 and Q2/Q3 ≈ 3.6, which is consistent with our analytical predictions. To confirm these predictions, we injected 15 μm polystyrene beads (50,000 beads/mL; Sigma Aldrich Corp.) into the device and flowed them through the chip at a flow rate of 50 μL/min. We used large beads for the purpose of completely occluding the weir, which causes the flow profile through the region to more closely match the expected behavior of deformable cells entering the trap. As expected, beads first populate the weir, thus decreasing flow through this region and causing subsequent beads to travel through the bypass (Figure 2(d), see Supplementary Movie 1). In this way, cells and beads can be hydrodynamically loaded into weirs, then intentionally transferred into the compartment region when an acoustic force is activated.
Optimization of Acoustic Transfer Step
After hydrodynamic trapping (Figure. 3(a)), the beads or cells can be transferred into the compartment regions by reversing the fluid flow to release them from their weirs and then establishing a slow forward flow to move them into the adjacent compartments under acoustic excitation. As can be seen, acoustic excitation of the chip caused the beads to be strongly attracted to the leading corner of the compartment region, which is defined here as the transfer point depicted as the end point of the dashed line trajectory in Figure 3(b). Thereafter, the acoustic transducer was turned off and forward pressure was used to push the beads into the low-shear compartment regions (Figure 3(c), see Electronic Supplementary Information for Shear Stress Through the Acoustofluidic Element) to the final loading sites (Figure 3(d), see Supplementary Movie 2). Thus, the purpose of the acoustic switch is to move the beads into the streamlines that pass through the compartment. It is important to note that during this acoustic switching step, we kept the flow at a low speed (e.g. < 50 μm/s) to allow the acoustic force to dominate fluid convection.
Figure 3.
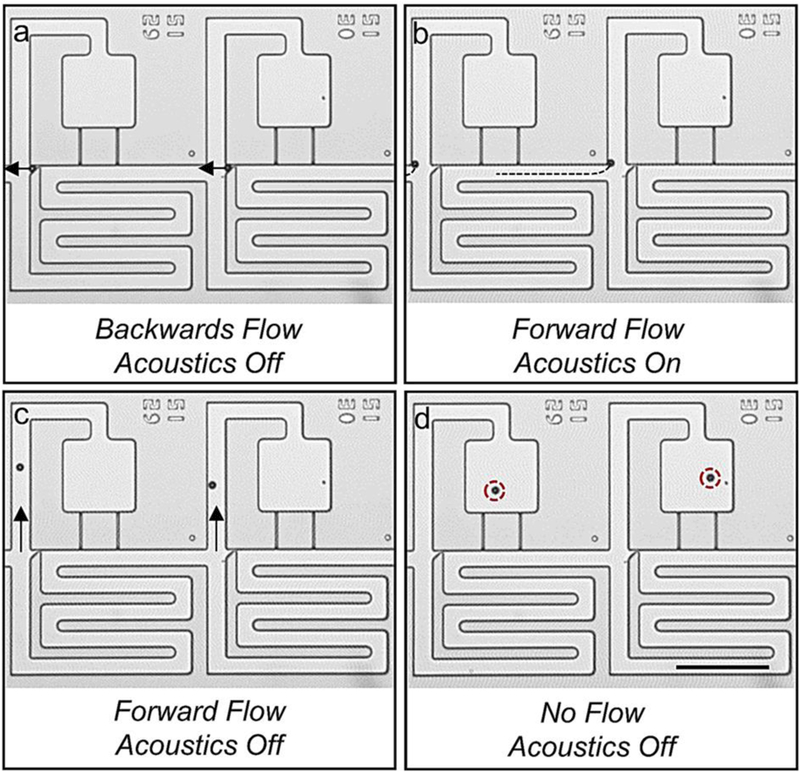
Image sequence detailing the acoustic switching mechanism. (a) Beads are captured in weirs using an oscillatory pressure profile. Once each site is occupied, beads are unloaded from weirs using backward flow. (b) Beads are slowly propelled towards the trifurcation junction (their paths are indicated by the dotted lines) using positive pressure and are acoustically trapped at the leading corner of the compartment region. (c) Beads are flowed into the compartment region. (d) Beads are loaded in the compartment region. Scale bar indicates 200 μm.
To find the optimal parameters for acoustic attraction to the corners, we injected 8.5 μm polystyrene beads (50,000 beads/mL; Sigma Aldrich Corp.) into the chip and tracked the bead motion towards the corner at frequencies ranging from 1.1 to 1.6 MHz and applied voltages ranging from 2 to 5 Vpp (as read by the oscilloscope following amplification). This frequency range coincides with the expected structural resonance of the microfluidic channel (RL, Figure 1), which was 555 μm long and is matched to an acoustic wavelength of 1.35 MHz. Our method involved first applying backward pressure to remove the beads from the weirs and away from the switching junction, and next applying slow forward pressure to move towards the switching junction when the acoustic field was turned on. A successful switching event is one in which the bead was captured by the corner within 5 seconds. We used a 10X objective to visualize many switching processes simultaneously in a large field of view, which allowed us to obtain at least 6 measurements for each voltage/frequency pair, and the results are provided in Figure 4. As a visual aid, the data points are color-coded, in which red depicts 100% capture on the corner and blue depicts 0% capture. As a guide to the eye, we also provide a contour plot to show the conditions where trapping was most efficient, which was in the range of 1.35 – 1.42 MHz and at higher voltages.
Figure 4.
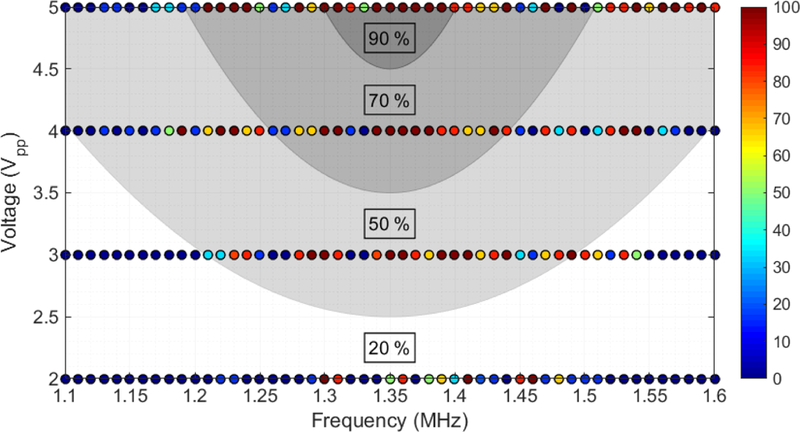
Color plot of switching efficiencies of polystyrene beads onto the leading corners of the compartment region upon acoustic excitation (n=6 compartments). Shaded regions indicate average switching efficiencies over the specified range.
To confirm that this optimal frequency was caused by the channel dimensions and not by a characteristic resonance of the PZT actuator, we additionally tested this effect with PZT transducers having different resonant frequencies (705 kHz, 1.35 MHz, 2.9 Mhz). In all cases, the devices showed peak performance around 1.40 MHz, similar to the results shown in Figure 4. It is clear from Figure 4 that the particle switching effect has strong frequency dependence, which would imply that the acoustic fields are amplified due to certain structural features of the microfluidic channel; however, these measurements alone were not sufficient to conclude whether the effect was due to the acoustic radiation force in a standing acoustic wave or whether the particles are following the flow patterns produced by streaming vortices near the sharp corner.
To better understand the acoustically excited flow patterns, we next injected 200 nm red fluorescent tracer particles (0.1 wt % in CTAB; Sigma Aldrich Corp) into the fluid and used long exposures to enable visualization of the streaming patterns near the trifurcation. In the absence of an acoustic field, the flow patterns are random as expected (see Supplementary Movie 3). When the transducer was actuated at 1.4 MHz and 5 Vpp, we observed very clear streaming vortices, which spanned the length of the channels and were present with minor variations across all the junctions in each field of view (Figure 5(a)). The high consistency of the streaming vortices across the entire chip indicated that it is caused by the specific structural features of the compartment rather than the specific position of the PZT transducer, overall size of the chip, or other macroscale features. Streaming vortices form at all the sharp corners in the microfluidic channels and establish steady state circulatory flow, which rotates in different directions depending on the excitation frequency. Micron-sized objects are attracted to the center of these vortices and rotate continuously inside them. Since the acoustic transducer is excited only when the forward flow is established, the beads or cells are captured at the first vortex that they experience, which is usually the leading corner as specified in Figure 5(a). From there, these objects are carried along the laminar flow paths that terminate inside the compartments when the acoustic transducer is turned off and forward flow is applied. We note here that while only streaming vortices present at the trifurcation point are used for our transfer mechanism, multiple vortices form throughout the device, particularly at locations with sharp edges and low flow (e.g. entrance corner to the compartment region, upper bend in the compartment region, throat of the compartment region).
Figure 5.
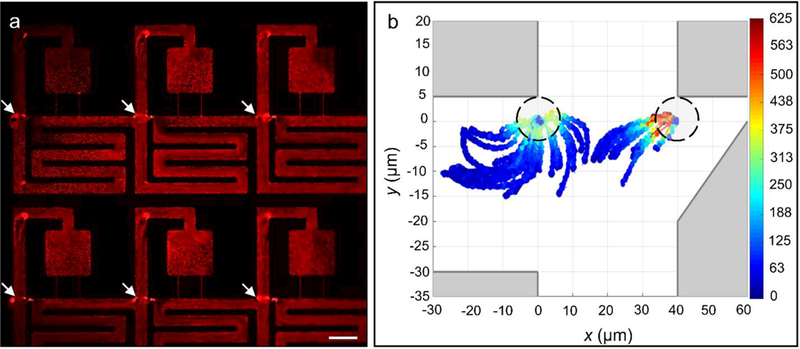
(a) Red fluorescent image of nanoparticles under acoustic excitation at 1.4 MHz and 5 Vpp. (b) Normalized velocity magnitudes of 8.5 μm polystyrene beads approaching the entrance corner of the compartment region. Here, the dashed circles indicate the outline of the bead (or cell) at its final position. Scale bar indicates 100 μm.
Further evidence that the transfer effect is due to the presence of streaming vortices was obtained by tracking the trajectories of individual beads in the vicinity of each corner. Using the same 8.5 μm beads described above, we tracked the trajectories of ≈44 individual particles upon acoustic excitation at 1.4 MHz and 5 Vpp and overlaid them on the same plot (Figure 5(b)). As a visual aid, the data points are colored according to their instantaneous velocity. The overall shapes of the trajectories, their good match with the shapes of the streaming vortices, as well as the strong spatial dependence of the bead velocity, all provide strong evidence that acoustic confinement at the entrance corner of the compartment region is due to acoustic streaming. This finding is consistent with previous studies in which large particles and cells were trapped in steady acoustic streaming patterns around oscillating edges.51–54
Following this, to better characterize the strength and driving mechanism of the acoustic switching effect, we also measured the peak velocity of the beads as a function of the applied voltage. These measurements were taken with a high-speed camera at 240 frames per second, which could quantify trajectories of up to ~1 mm/s. The highest velocities were recorded close to the sharp corner, which allowed us to approximately measure the contact force based on extrapolation from the fluid drag on a sphere Figure 6(a). The results indicate that the peak contact force is linearly related to the magnitude of the applied voltage, similar to the linear relationships observed by others at high acoustic excitations.55 We estimate that at the strongest acoustic excitations, the contact force is less than 100 pN, and should thus be gentle on the cells. As can be seen, however, this contact force is sufficient to hold the particles in place at the entrance corner to the compartment region during our transfer process. From Figure 6(b), it is clear that the peak contact force scales linearly with voltage, which contrasts with the acoustic radiation force that should roughly scale quadratically with the excitation voltage.41 Further, as a final piece of evidence, we note that both highly elastic PDMS-based microparticles and stiff polystyrene beads are attracted to the same position with comparable velocities. Since it is well known that PDMS particles suspended in aqueous fluids exhibit an effective negative acoustic contrast factor, whereas polystyrene beads exhibit a positive acoustic contrast, these two materials should not be attracted to the same points in an acoustic energy landscape (see Electronic Supplementary Information for Material Dependence of Acoustic Radiation Force). The combination of these measurements thus allows us to reasonably conclude that the acoustic switching mechanism is based on acoustic streaming rather than an acoustic radiation force.41
Figure 6.
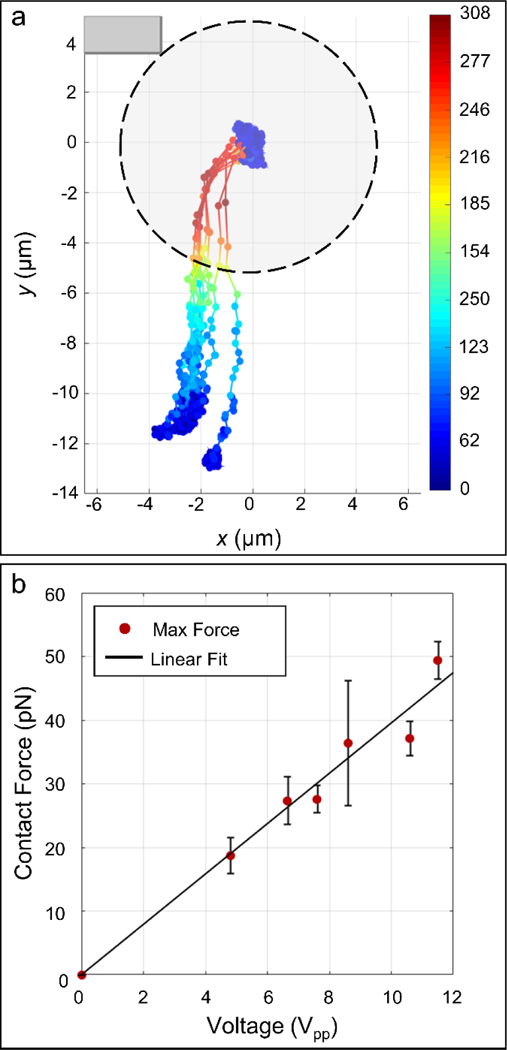
(a) Trajectories of 8.5 μm polystyrene beads approaching the entrance corner of the compartment region. (b) Plot of maximum force before contact versus voltage. R2 = 0.9656.
Generation of Single Cell Arrays
After optimizing the acoustic transfer step, we next sought to demonstrate the feasibility of this trap and transfer approach to organize a single cell array in a highly parallel manner. Towards this end, we first quantified the ability to fluidically trap PC9 cancer cells (400,000 cells/mL) in the weirs and demonstrated the consistent ability to achieve a weir occupancy efficiency of 80 ± 5 % single cells (Figure 7(a-e)). Blue, cyan, yellow, and red indicate 0, 1, 2, and 3 trapped cells, respectively. We expect that the efficiency can be improved by reducing the number of cell doublets entering the chip, and limiting cellular debris, which leads to clogging of some of the channel (two blockages are clearly shown in Figure 7(c), and doublets are colored in yellow).
Figure 7.
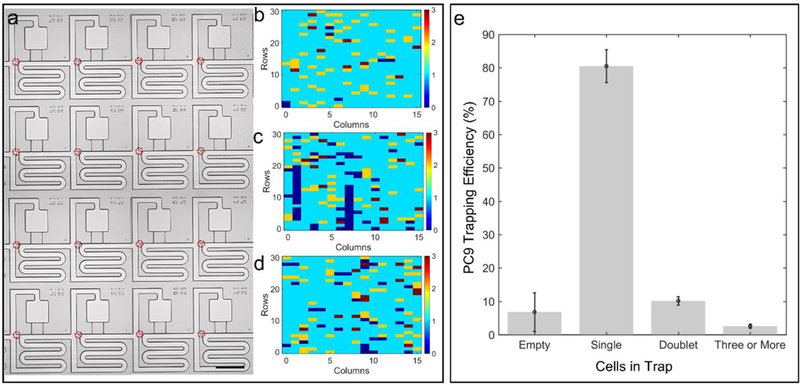
Trapping efficiency for PC9 cells in the weirs of the trifurcation. (a) Representative image of trapped cells. Number of cells captured in individual trap sites for trial (b) one, (c) two, and (d) three. (e) Distribution of cells in n = 3 acoustofluidic chips. Scale bar indicates 200 μm.
Next, we transferred the cells into their corresponding adjacent compartments using an acoustic sweep from 1.35 to 1.42 MHz, with a sweep rate of 1 Hz for over one second at an excitation of 16 Vpp (Figure 8(a), see Supplementary Movie 4). As can be seen, after the second step of this process, we were able to consistently obtain a single cell array with an efficiency of 67 ± 4 % (Figure 8(b-e)).
Figure 8.
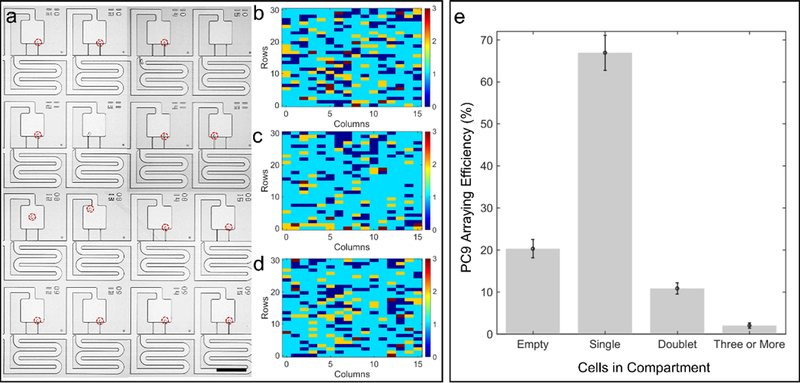
Arraying efficiency for PC9 cells in the compartment region of the trifurcation. (a) Representative image of arrayed cells. Number of cells captured in individual array sites for trial (b) one, (c) two, and (d) three. (e) Distribution of cells in n = 3 acoustofluidic chips. Scale bar indicates 200 μm.
This number represents the fraction of single cells present in the compartment regions of the acoustofluidic chip, and is dependent on the number of single cells originally trapped in the weirs prior to acoustic switching. Accordingly, this data indicates that the acoustic switching efficiency is approximately 83 %.
Conclusion
In conclusion, we have demonstrated a trap and transfer process for organizing a high-density array of single cells. This approach relies on a combination of hydrodynamic capture of cells in weirs and then transfer of the cells into more spacious compartment chambers using an array of acoustic streaming vortices as local switches. To our knowledge, this is the first demonstration of the consistent generation of an array of streaming vortices for use in massively parallel acoustic control of single cells. We used this approach to generate a single cell array with an arraying efficiency of ≈67 %, allowing us to array thousands of cells on a glass slide sized device. These efficiencies may be improved by functionalizing the microfluidic channels with a non-fouling brush and by refining our protocols to remove and prevent the formation of cell doublets. Importantly, due to the versatile nature of our acoustic forces, our technique does not require a cell-labeling step, and allows for the microfluidic channels and acoustic switching functionality to be integrated into a single device layer, which improves manufacturability, allows for the facile exchange of fluids, provides a good substrate for optical imaging, and has high chemical compatibility for patterning different biomolecules, which can be used for incubating cells and probing their molecular processes in future studies.
Materials and Methods
Device Fabrication
Three acoustofluidic arrays were tested in this study. Two had topside access ports in which holes were drilled through the glass prior to bonding. The other was fabricated by through-wafer etching of inlet/outlet ports and then bonding to unpatterned glass to enable backside fluidic access ports.56 Photopatterning was achieved by spin coating Shipley S1838 photoresist (MicroChemicals, GmbH) onto 6” silicon wafer (University Wafer, Inc.) at a spin speed of 3000 rpm, baking them a 115°C for 60 seconds, then exposing them to 126 mJ of 365 nm UV radiation with a mask aligner (MA6/BA6, Karl Süss). These patterns served as a polymer mask for etching the microfluidic channels to a depth of approximately 18 μm using deep reactive ion etching (Pegasus deep silicon etcher; SPTS Technologies, Ltd.). We diced individual chips from the wafer when using the devices with topside access ports. For backside access ports, we used a second lithography step, in which the dice lines and inlets/outlet ports were patterned on the backside of the wafer in AZ9260 photoresist (MicroChemicals, GmbH), which was spin coated at 1800 rpm for 60 s, baked at 110°C for 3 min, then exposed to 3600 mJ of irradiation in the mask aligner. Subsequently, the wafer was bonded to a carrier and a through-silicon etch was performed using deep reactive ion etching. For both configurations, individual chips were cleaned in piranha and anodically bonded to precut glass cover slips (Borofloat® Glass; Schott AG) to form a hermetic seal (see Electronic Supplementary Information for Fabrication Routine for the Acoustofluidic Chip).
Device Assembly
The acoustofluidic chip was housed in a three-part aluminum manifold. The top component of the manifold uses standard ¼−28 threaded fittings (Idex Corp.) to make high pressure (i.e. > 100 bar) world-to-chip connection to the acoustofluidic device with pressure tight fittings. The middle manifold had a recess along the top to hold the chip and another along the bottom to mount the zirconate titanate (PZT) transducers (1 1/8” x 1 1/16”, resonant frequency, fo = 1.35 MHz; APC International, Ltd.), which were bonded to the manifold with cyanoacrylate glue (Loctite® 495; Loctite Corp.). We improved the acoustic transmission into the chip by spreading a layer of electrode gel (Spectra® 360; Parker Laboratories, Inc.) between the chip and manifold. Finally, the bottom component encloses the transducer in the manifold to enable a closed chamber for a temperature probe. For the backside configuration, access ports were included in the middle component (see Electronic Supplementary Information for Acoustofluidic Assembly with Backside Access Ports).
Cell Preparation
The PC9 cell line was cultured in RPMI 1640 with 10 % fetal bovine serum (FBS) and 1% penicillin/streptomycin and maintained at 37°C in 5 % CO2. All cell lines were purchased from the Duke University Cell Culture Facility (CCF).
Device Loading
For microparticle studies, the chip was primed by sequentially rising with 190 proof ethanol (Sigma-Aldrich Corp.) and deionized water. After the chip was primed, 8.5 μm polystyrene beads (50,000 beads/ mL, Sigma Aldrich Corp.) suspended in 0.5 wt. % hexadecyltrimethylammonium bromide (CTAB) in deionized water were injected into the device. For cell studies, the chip was primed by sequentially rising with 190 proof ethanol (Sigma-Aldrich Corp.), 1X PBS buffer, and cell media (see cell preparation above). PC9 cells (400cells/ μL) were mixed with a biocompatible surfactant (Pluronic® F-68; Life Technologies, 0.1 % v/v) and loaded into weirs under an oscillatory pressure profile (i.e. switching between pulses of −20 mbar for 8 seconds and 60 mbar for 2 seconds) from a reservoir at the outlet of the microfluidic chip using a pressure-controlled system (OB1 Pressure Controller; Elveflow). The oscillatory pressure profile was used to prevent cell adhesion or the formation of cell clusters on the back-side of weirs. After loading in the weirs, cells were transported to compartment sites using a three-step process. First, cells were withdrawn from weirs with negative pressure driven flow (i.e. −30 mbar) for 3 seconds then subsequently propelled towards the compartment region at various pressures for 10 seconds. Next, when the particle reached the corner, the acoustic generator was switched ON, exciting the attached piezoelectric transducer with an acoustic sweep from 1.35 to 1.42 MHz with a sweep rate of 1 Hz and at over one second at an excitation of 16 Vpp. Finally, after visually confirming that the particles in each field of view were captured at the corner, acoustics were turned off and cells were transported into compartment regions with positive pressure driven flow. We applied a positive pressure of ~30 mbar for relatively long durations of ~10 seconds, because this section had higher fluidic resistance and thus lower flow rates. Since there is a net positive pressure bias for each transfer cycle, cells that move into the compartments remain trapped there permanently. Meanwhile, it was possible to repeat this approach for cells that were missed during a previous cycle and still trapped in the weirs. After repeating this process 4–5 times, we were able to transfer a large percentage of the cells that were trapped in the first step.
Data Acquisition
Switching efficiencies were determined by visually inspecting the particle trajectories when the acoustic field was turned on. Particle tracking data was extracted using a custom MATLAB program, which cropped a region of interest, stabilized the video, and extracted particle positions with circle tracking and thresholding. To quantify the frequency dependence of the trapping process, we used acoustic excitations at varying voltages and frequencies, and visually inspected the number of particles in the field of view (n=6) that were captured on the corners. An efficiency map was generated using a custom MATLAB script, with dark red circles indicating 100 % capture and blue circles indicating 0 % capture.
Additionally, to quantify the arraying efficiency across the chip acoustofluidic chips, we developed a custom Metamorph program (Molecular Devices, Inc.), which controlled the DMI-6000B microscope, XY automated stage (MS-2000; Applied Scientific Instrumentation) and camera to enable high-throughput imaging of each compartment in the array. Briefly, we first calculated the focal plane along the chip surface using fiducial alignment marks, and next bright field and fluorescent images were acquired in series along a prescribed XY path to map the entire array. The files were saved using a custom naming format, and then manually inspected to quantify the occupancy in the trap and compartment regions of the acoustofluidic element. Heat maps were created by recording the number of cells in each compartment in a table using a custom MATLAB script to generate a color-coded grid indicating the occupancy of each compartment, with blue representing no cells and deep red representing three or more cells.
Supplementary Material
Acknowledgements
We would like to thank Elijah Weinreb for assistance in developing the Metamorph script and 3D printing the aluminum housings. This work was supported by an NSF graduate research fellowship (1106401) to K.A.O, a National Institutes of Health grants (R21GM111584, R21CA220082, and R01GM1234542), NSF’s Research Triangle Materials Research Science and Engineering Center (DMR- 1121107), the Duke-Coulter Translational Partnership Grant Program, and was performed in part at the Duke University Shared Materials Instrumentation Facility (SMIF), a member of the North Carolina Research Triangle Nanotechnology Network (RTNN), which is supported by the National Science Foundation (Grant ECCS-1542015) as part of the National Nanotechnology Coordinated Infrastructure (NNCI).
Footnotes
Author Contributions
K.A.O. assisted in the design of the microfluidic chips, fabricated the devices, performed experiments, and prepared the manuscript. S.T.K. performed experiments and assisted in manuscript preparation. J.D.M. performed experiments and provided useful discussions for manuscript preparation. K.H.L. and K.C.W. provided cells for the experiments and useful discussions for manuscript preparation. B.B.Y. assisted in the design of the microfluidic chips and manuscript preparation.
References
- 1.Elowitz MB, Levine AJ, Siggia ED and Swain PS, Science, 2002, 297, 1183–1186. [DOI] [PubMed] [Google Scholar]
- 2.Shalek AK, Satija R, Shuga J, Trombetta JJ, Gennert D, Lu D, Chen P, Gertner RS, Gaublomme JT, Yosef N, Schwartz S, Fowler B, Weaver S, Wang J, Wang X, Ding R, Raychowdhury R, Friedman N, Hacohen N, Park H, May AP and Regev A, Nature, 2014, 510, 363–369. [DOI] [PMC free article] [PubMed] [Google Scholar]
- 3.Kalisky T and Quake SR, Nat Methods, 2011, 8, 311–314. [DOI] [PubMed] [Google Scholar]
- 4.Shalek AK and Benson M, Sci Transl Med, 2017, 9. [DOI] [PMC free article] [PubMed] [Google Scholar]
- 5.Vallejos CA, Risso D, Scialdone A, Dudoit S and Marioni JC, Nature Methods, 2017, 14, 565–571. [DOI] [PMC free article] [PubMed] [Google Scholar]
- 6.Hosic S, Murthy SK and Koppes AN, Anal Chem, 2016, 88, 354–380. [DOI] [PMC free article] [PubMed] [Google Scholar]
- 7.Gross A, Schoendube J, Zimmermann S, Steeb M, Zengerle R and Koltay P, Int J Mol Sci, 2015, 16, 16897–16919. [DOI] [PMC free article] [PubMed] [Google Scholar]
- 8.Tay S, Hughey JJ, Lee TK, Lipniacki T, Quake SR and Covert MW, Nature, 2010, 466, 267–271. [DOI] [PMC free article] [PubMed] [Google Scholar]
- 9.Gawad C, Koh W and Quake SR, Nat Rev Genet, 2016, 17, 175–188. [DOI] [PubMed] [Google Scholar]
- 10.Zhang X, Marjani SL, Hu Z, Weissman SM, Pan X and Wu S, Cancer Res, 2016, 76, 1305–1312. [DOI] [PubMed] [Google Scholar]
- 11.Saadatpour A, Lai SJ, Guo GJ and Yuan GC, Trends Genet, 2015, 31, 576–586. [DOI] [PMC free article] [PubMed] [Google Scholar]
- 12.Wang DJ and Bodovitz S, Trends Biotechnol, 2010, 28, 281–290. [DOI] [PMC free article] [PubMed] [Google Scholar]
- 13.Hu P, Zhang W, Xin H and Deng G, Front Cell Dev Biol, 2016, 4, 116. [DOI] [PMC free article] [PubMed] [Google Scholar]
- 14.Thompson AM, Paguirigan AL, Kreutz JE, Radich JP and Chiu DT, Lab Chip, 2014, 14, 3135–3142. [DOI] [PMC free article] [PubMed] [Google Scholar]
- 15.Love JC, Aiche J, 2010, 56, 2496–2502. [Google Scholar]
- 16.Yamamura S, Kishi H, Tokimitsu Y, Kondo S, Honda R, Rao SR, Omori M, Tamiya E and Muraguchi A, Analytical Chemistry, 2005, 77, 8050–8056. [DOI] [PubMed] [Google Scholar]
- 17.Gierahn TM, Wadsworth MH 2nd, Hughes TK, Bryson BD, Butler A, Satija R, Fortune S, Love JC and Shalek AK, Nat Methods, 2017, 14, 395–398. [DOI] [PMC free article] [PubMed] [Google Scholar]
- 18.Tan WH and Takeuchi S, P Natl Acad Sci USA, 2007, 104, 1146–1151. [DOI] [PMC free article] [PubMed] [Google Scholar]
- 19.Di Carlo D, Wu LY and Lee LP, Lab on a Chip, 2006, 6, 1445–1449. [DOI] [PubMed] [Google Scholar]
- 20.Teshima T, Ishihara H, Iwai K, Adachi A and Takeuchi S, Lab on a Chip, 2010, 10, 2443–2448. [DOI] [PubMed] [Google Scholar]
- 21.Kimmerling RJ, Lee Szeto G, Li JW, Genshaft AS, Kazer SW, Payer KR, de Riba Borrajo J, Blainey PC, Irvine DJ, Shalek AK and Manalis SR, Nat Commun, 2016, 7, 10220. [DOI] [PMC free article] [PubMed] [Google Scholar]
- 22.Mi L, Huang L, Li JX, Xu GQ, Wu Q and Wang WH, Lab on a Chip, 2016, 16, 4507–4511. [DOI] [PubMed] [Google Scholar]
- 23.Liu W, Dechev N, Foulds IG, Burke R, Parameswaran A and Park EJ, Lab on a Chip, 2009, 9, 2381–2390. [DOI] [PubMed] [Google Scholar]
- 24.Chen A, Byvank T, Chang WJ, Bharde A, Vieira G, Miller BL, Chalmers JJ, Bashir R and Sooryakumar R, Lab on a Chip, 2013, 13, 1172–1181. [DOI] [PMC free article] [PubMed] [Google Scholar]
- 25.Mazutis L, Gilbert J, Ung WL, Weitz DA, Griffiths AD and Heyman JA, Nat Protoc, 2013, 8, 870–891. [DOI] [PMC free article] [PubMed] [Google Scholar]
- 26.Guo F, Mao ZM, Chen YC, Xie ZW, Lata JP, Li P, Ren LQ, Liu JY, Yang J, Dao M, Suresh S and Huang TJ, P Natl Acad Sci USA, 2016, 113, 1522–1527. [DOI] [PMC free article] [PubMed] [Google Scholar]
- 27.Love KR, Bagh S, Choi J and Love JC, Trends Biotechnol, 2013, 31, 16–22. [DOI] [PubMed] [Google Scholar]
- 28.Torres AJ, Hill AS and Love JC, Anal Chem, 2014, 86, 11562–11569. [DOI] [PMC free article] [PubMed] [Google Scholar]
- 29.Goldstein LD, Chen YJ, Dunne J, Mir A, Hubschle H, Guillory J, Yuan W, Zhang J, Stinson J, Jaiswal B, Pahuja KB, Mann I, Schaal T, Chan L, Anandakrishnan S, Lin CW, Espinoza P, Husain S, Shapiro H, Swaminathan K, Wei S, Srinivasan M, Seshagiri S and Modrusan Z, BMC Genomics, 2017, 18, 519. [DOI] [PMC free article] [PubMed] [Google Scholar]
- 30.Cheng YH, Chen YC, Brien R and Yoon E, Lab Chip, 2016, 16, 3708–3717. [DOI] [PMC free article] [PubMed] [Google Scholar]
- 31.Lin CH, Hsiao YH, Chang HC, Yeh CF, He CK, Salm EM, Chen C, Chiu IM and Hsu CH, Lab Chip, 2015, 15, 2928–2938. [DOI] [PubMed] [Google Scholar]
- 32.Li Y, Jang JH, Wang C, He B, Zhang K, Zhang P, Vu T and Qin L, Advanced Biosystems, 2017, 1. [DOI] [PubMed] [Google Scholar]
- 33.Abedini-Nassab R, Joh DY, Albarghouthi F, Chilkoti A, Murdoch DM and Yellen BB, Lab on a Chip, 2016, 16, 4181–4188. [DOI] [PMC free article] [PubMed] [Google Scholar]
- 34.Abedini-Nassab R, Joh DY, Triggiano MA, Baker C, Chilkoti A, Murdoch DM and Yellen BB, Adv Funct Mater, 2016, 26, 4026–4034. [DOI] [PMC free article] [PubMed] [Google Scholar]
- 35.Chiou PY, Ohta AT and Wu MC, Nature, 2005, 436, 370–372. [DOI] [PubMed] [Google Scholar]
- 36.Chiou PY, Wong W, Liao JC and Wu MC, Proc Ieee Micr Elect, 2004, 21–24. [Google Scholar]
- 37.Wu MC, Nat Photonics, 2011, 5, 322–324. [Google Scholar]
- 38.Hsu HY, Jamshidi A, Shekarchian S, Lam W, Valley JK, Pei SN and Wu MC, 2011 Ieee 24th International Conference on Micro Electro Mechanical Systems (Mems), 2011, 63–66. [Google Scholar]
- 39.Collins DJ, Morahan B, Garcia-Bustos J, Doerig C, Plebanski M and Neild A, Nat Commun, 2015, 6, 8686. [DOI] [PMC free article] [PubMed] [Google Scholar]
- 40.Vanherberghen B, Manneberg O, Christakou A, Frisk T, Ohlin M, Hertz HM, Onfelt B and Wiklund M, Lab on a Chip, 2010, 10, 2727–2732. [DOI] [PubMed] [Google Scholar]
- 41.Bruus H, Lab on a Chip, 2012, 12, 1014–1021. [DOI] [PubMed] [Google Scholar]
- 42.Adams JD, Thevoz P, Bruus H and Soh HT, Appl Phys Lett, 2009, 95, 254103. [DOI] [PMC free article] [PubMed] [Google Scholar]
- 43.Hagsater SM, Jensen TG, Bruus H and Kutter JP, Lab Chip, 2007, 7, 1336–1344. [DOI] [PubMed] [Google Scholar]
- 44.Ohiri KA, Evans BA, Shields CW, Gutierrez RA, Carroll NJ, Yellen BB and Lopez GP, Acs Applied Materials & Interfaces, 2016, 8, 25030–25035. [DOI] [PubMed] [Google Scholar]
- 45.Shields Iv CW, Wang JL, Ohiri KA, Essoyan ED, Yellen BB, Armstrong AJ and Lopez GP, Lab Chip, 2016, 16, 3833–3844. [DOI] [PubMed] [Google Scholar]
- 46.Ahmed D, Ozcelik A, Bojanala N, Nama N, Upadhyay A, Chen YC, Hanna-Rose W and Huang TJ, Nature Communications, 2016, 7. [DOI] [PMC free article] [PubMed] [Google Scholar]
- 47.Ding X, Li P, Lin SC, Stratton ZS, Nama N, Guo F, Slotcavage D, Mao X, Shi J, Costanzo F and Huang TJ, Lab Chip, 2013, 13, 3626–3649. [DOI] [PMC free article] [PubMed] [Google Scholar]
- 48.Kaynak M, Ozcelik A, Nourhani A, Lammert PE, Crespi VH and Huang TJ, Lab Chip, 2017, 17, 395–400. [DOI] [PMC free article] [PubMed] [Google Scholar]
- 49.Yeo LY and Friend JR, Annu Rev Fluid Mech, 2014, 46, 379–406. [Google Scholar]
- 50.Hsu YH, Moya ML, Abiri P, Hughes CC, George SC and Lee AP, Lab Chip, 2013, 13, 81–89. [DOI] [PMC free article] [PubMed] [Google Scholar]
- 51.Leibacher I, Hahn P and Dual J, Microfluid Nanofluid, 2015, 19, 923–933. [Google Scholar]
- 52.Lieu VH, House TA and Schwartz DT, Analytical chemistry, 2012, 84, 1963–1968. [DOI] [PubMed] [Google Scholar]
- 53.Karimi A, Yazdi S and Ardekani AM, Biomicrofluidics, 2013, 7. [DOI] [PMC free article] [PubMed] [Google Scholar]
- 54.Ozcelik A, Ahmed D, Xie Y, Nama N, Qu Z, Nawaz AA and Huang TJ, Anal Chem, 2014, 86, 5083–5088. [DOI] [PMC free article] [PubMed] [Google Scholar]
- 55.Ovchinnikov M, Zhou J and Yalamanchili S, J Acoust Soc Am, 2014, 136, 22–29. [DOI] [PubMed] [Google Scholar]
- 56.Shields CW, Cruz DF, Ohiri KA, Yellen BB and Lopez GP, Jove-Journal of Visualized Experiments, 2016, DOI: 10.3791/53861. [DOI] [PMC free article] [PubMed] [Google Scholar]
Associated Data
This section collects any data citations, data availability statements, or supplementary materials included in this article.


