

Abstract
Adoptive cell therapy (ACT) with antigen-specific T cells has shown remarkable clinical success, but approaches to safely and effectively augment T cell function, especially in solid tumors, remain of great interest. Here we describe a strategy to “backpack” large quantities of supporting protein drugs on T cells using protein nanogels (NGs) that selectively release these cargos in response to T cell receptor (TCR) activation. We design cell surface-conjugated NGs that respond to an increase in T cell surface reduction potential upon antigen recognition, limiting drug release to sites of antigen encounter such as the tumor microenvironment. Using NGs carrying an IL-15 superagonist complex, we demonstrate that relative to systemic administration of free cytokines, NG delivery selectively expands T cells 16-fold in tumors, and allows at least 8-fold higher doses of cytokine to be administered without toxicity. The improved therapeutic window enables substantially increased tumor clearance by murine T cell and human CAR-T cell therapy in vivo.
Adoptive transfer of tumor-specific T cells has been shown to elicit tumor regression in leukaemias and melanoma, with some patients experiencing durable complete responses1–3. Adjuvant treatments aiming to increase the fraction of responders and to extend ACT to other solid tumors are thus under intensive study4. Administration of supporting cytokines (e.g., interleukins) or tumor microenvironment-modulating factors are two central approaches that have been explored in preclinical and clinical studies to enhance T cell therapy5,6. However, supplying adjuvant drugs at the right time and site appears crucial, as systemically-administered immunomodulators can have toxicities7,8. Genetic engineering of T cells to express adjuvant cytokines in response to TCR-regulated transcription factors has been pursued in an attempt to focus cytokine delivery in the tumor microenvironment, but these approaches to date have still shown substantial toxicity in patients, thought to be due in part to wide variation in T cell gene expression among individuals9.
In previous work, we described a complementary chemistry-based approach to delivering adjuvant drugs during adoptive therapy, via conjugation of drug-loaded lipid nanoparticles (“backpacks”) to the plasma membrane of ACT T cells10–12. Nanoparticles covalently coupled to cell surface proteins were not internalized and allowed for potent autocrine stimulation of transferred T cells, leading to enhanced T cell persistence and function in vivo11. However, two important limitations of this approach were (i) the low drug loading capacity achievable with traditional encapsulation strategies for protein drugs in nanoparticles, and (ii) the lack of regulation of drug release, which was mediated by spontaneous slow leakage of drug cargos from the nanoparticle backpacks.
Here we demonstrate an approach to address these challenges, and describe a strategy chemically linking adjuvant drug delivery to T cell activation, using TCR signalling-responsive nanoparticle backpacks. Using a human IL-15 superagonist (IL-15Sa) as a testbed drug cargo, we found that T cells backpacked with TCR-responsive NGs expanded 16-fold more in tumors than T cells supported by systemic cytokine injections, while remaining largely quiescent in the peripheral blood. This regulated drug release allowed 8-fold more IL-15Sa to be administered safely in animals compared to the free cytokine, enabling substantially improved therapeutic efficacy.
RESULTS
Design of protein NGs responsive to changes in cell surface redox activity
Mammalian cells actively carry out oxidation/reduction reactions in the face of the extracellular oxidizing environment through a family of transmembrane oxidoreductase enzymes13. Motivated by the fact that activated T cells have elevated levels of cell surface free thiols relative to naïve cells (Supplementary Fig. 1a)14, we measured the cell surface reduction activity of naïve or activated T cells using WST-1, a membrane-impermeable compound that forms a colored product following reduction15,16. Primed CD8+ T cells showed elevated cell surface reduction rates compared with naïve T cells (Fig. 1a). However, T cell surface redox activity further increased following stimulation with antigen presenting cells or anti-CD3/CD28-coated beads (Fig. 1a, b and Supplementary Fig. 1b).
Figure 1. Synthesis and characterization of TCR signalling-responsive protein nanogels.
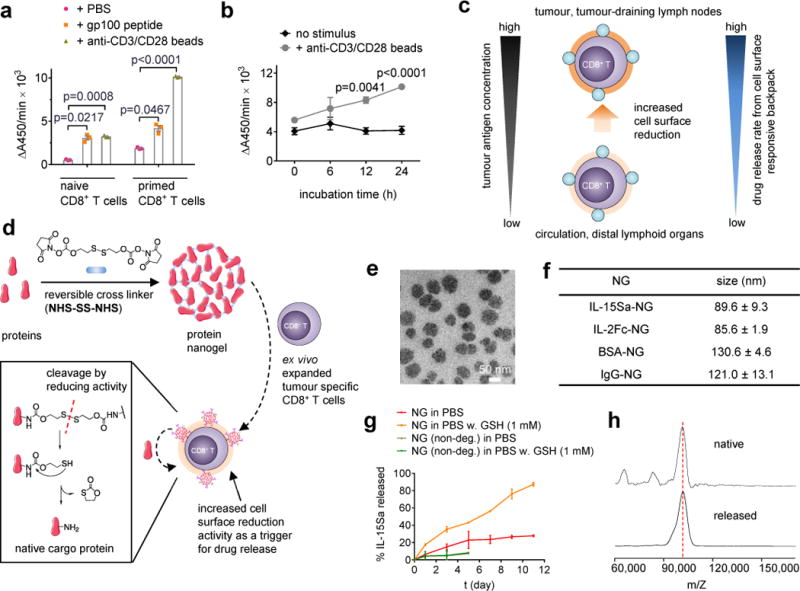
(a) Naïve or con-A-primed CD8+ T cells were incubated in the presence of gp100 peptide (10 μg/mL) or anti-CD3/CD28 beads for 24 hrs followed by measurement of WST-1 cell-surface reduction rate in presence of an intermediate electron acceptor for 1 hr at 37°C. (b) Con-A-primed CD8+ T cells were incubated in the presence of anti-CD3/CD28 beads and the cell-surface reduction rate was measured over time. (c) Proposed strategy for linking elevated surface redox activity of activated CD8+ T cells to accelerated drug release kinetics from a redox-responsive backpack. (d) Scheme for protein nanogel (NG) synthesis, and release of protein in response to reducing activity in the local microenvironment. (e) Representative TEM image of NGs prepared from IL-15Sa. (f) Mean ± s.d. hydrodynamic sizes of different NGs determined by dynamic light scattering (n=3 independent samples). (g) Release kinetics of cytokines from redox-responsive or non-degradable IL-15Sa-NGs in PBS with or without added glutathione (GSH) as a reducing agent. (h) Released and native cytokines were characterized by MALDI mass spectrometry. Data in a, b represent the mean ± s.e.m. (n = 3 biologically independent samples /group) and analysed by One-Way ANOVA and Tukey’s tests. All data are one representative of at least two independent experiments.
We reasoned that increased redox activity at the T cell surface could be exploited to obtain antigen-triggered adjuvant protein release using reduction-responsive nanoparticles bound to the plasma membrane of T cells (Fig. 1c). To this end we generated a “carrier free” protein backpack (Fig. 1d): We synthesized a disulphide-containing bis-N-hydroxy succinimide (NHS) crosslinker (NHS-SS-NHS) and identified conditions where solution-phase reaction of crosslinker and cargo proteins led to the formation of NGs comprised of many copies of the protein crosslinked to itself. NG formation typically required a large molar excess of crosslinker to protein (e.g., 15:1 crosslinker:protein, Supplementary Fig. 2a). NGs formed from several proteins including cytokines and antibodies contained a high mass fraction of protein cargo (~92% of dry weight) with a high incorporation efficiency (>90%, Supplementary Table 1), were relatively homogeneous (~80-130 nm mean hydrodynamic diameters) (Fig. 1e-f), and had slightly negative zeta potentials (Supplementary Table 2). The disulphide crosslinker was designed to cleave in response to reducing conditions at the T cell surface, followed by release of un-adducted protein cargo through a self-immolative reaction (Fig. 1d)17–19. As promising therapeutic cargos, we focused our efforts on IL-2Fc (an IL-2/Fc fusion protein) and ALT-803, a human IL-15 superagonist complex (IL-15Sa) presently in clinical trials against haematological malignancies and solid tumors5,20,21. Consistent with expectations, reducing agents such as glutathione (GSH) accelerated the release of IL-15Sa from NGs in a manner dependent on the NG cleavable disulphide (Fig. 1g and Supplementary Fig. 2b). Cytokine released from NGs exhibited the expected molecular weight and had bioactivity indistinguishable from neat IL-15Sa (Fig. 1h and Supplementary Fig. 2c), suggesting release of intact cytokine without extensive residual chemical groups.
CD45 maintains nanogels at the cell surface
To sustain stimulation, NG backpacks must not be internalized by the carrier cell. We initially attempted to link NGs to T cells through the incorporation of maleimide- or NHS-activated crosslinkers into the NG structure, for covalent coupling to free thiols or amines on cell surface proteins (Supplementary Fig. 3). This approach, which was previously successful for attachment of lipid nanocarriers with encapsulated drug cargos, led to rapid internalization of IL-2Fc or IL-15Sa NGs (Fig. 2a). Endocytosis was not observed with control NGs formed with albumin (Fig. 2a), suggesting internalization was a result of cell surface cytokine receptors binding to the cytokine-NG even before protein was released, triggering natural internalization pathways for these cytokines22.
Figure 2. Nanogel anchoring to CD45 promotes prolonged cell surface retention.
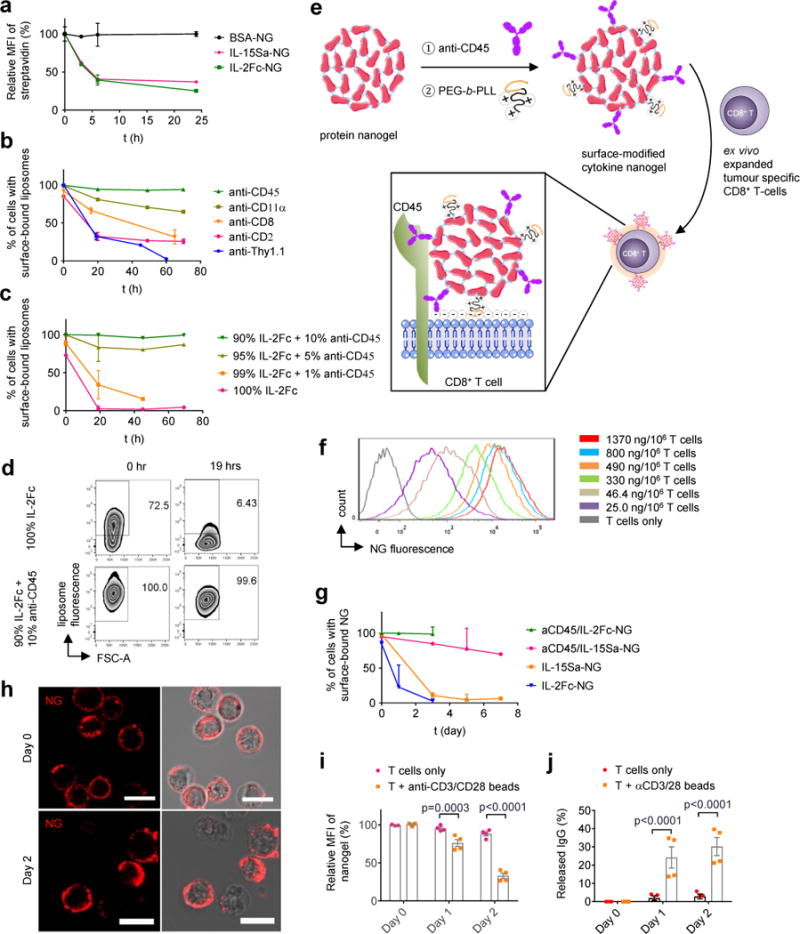
(a) Biotinylated protein NGs were covalently coupled to primed pmel-1 CD8+ T cells via a bis-NHS crosslinker, incubated in medium for indicated times then stained with fluorescent streptavidin (SAv) to detect cell surface-accessible particles and analysed by flow cytometry (n=3 independent samples). (b-d) Biotinylated liposomes functionalized with indicated monoclonal antibodies (b) or a mixture of anti-CD45 and IL-2Fc (c, d) were incubated with primed pmel-1 CD8+ T cells for indicated times, then stained with fluorescent SAv and analysed by flow cytometry to measure cell surface-accessible liposomes. Shown are mean % of cells with surface-accessible liposomes (b, c) and representative flow cytometry plots showing the frequencies of cells with surface-bound liposomes (d). n=3 independent samples in b-d. (e) Scheme for surface modification of cytokine-NGs to facilitate efficient and stable anchoring on T cell surfaces. (f) Primed pmel-1 CD8+ T cells were coupled with fluorescently-labelled aCD45/IL-15Sa NGs at the indicated cytokine levels, and NG levels on each cell were assessed by flow cytometry. (g) Primed pmel-s CD8+ T cells were conjugated with aCD45/cytokine- or cytokine only-biotinylated NGs, incubated for indicated times, then stained with SAv for analysis of cell-surface NGs by flow cytometry (n=3 independent samples). (h) Representative confocal microscopy images of primed pmel-1 CD8+ T cells with fluorescently labelled aCD45/IL-15Sa-NGs (red) on day 0 and day 2. Scale bar, 10 μm. (i-j) Release of fluorescently-labelled IgG from aCD45/IgG-NGs attached to primed pmel-1 CD8+ T cells incubated with or without anti-CD3/CD28 beads as assessed by flow cytometry (i) and HPLC analysis of culture supernatants (j) (n=4 independent samples). Data represent the mean ± s.e.m. and analysed by One-Way ANOVA and Tukey’s tests. All data are one representative of at least two independent experiments.
To increase the cell surface half-life of NGs, we used monoclonal antibody-functionalized liposomes to screen for slowly-internalizing T cell surface proteins that could be used as specific anchors for the NGs. We tested targeting to CD2, CD8, CD11α, CD90, and CD45, candidate receptors we had previously identified in a mass spectrometry analysis of proteins that stably anchored lipid nanocapsules to T cells using maleimide chemistry12. We incubated T cells with antibody/biotin-functionalized liposomes, and measured the fraction of surface-accessible vesicles over time. Liposomes targeted to most of these receptors showed substantial internalization within a few days, with the exception of those targeting CD45, which exhibited prolonged cell surface retention (Fig. 2b). Free anti-CD45 also exhibited a long cell surface half-life when bound in excess to T cells (Supplementary Fig. 4a). IL-2Fc-conjugated liposomes, which exhibited rapid internalization, could be stably retained on the cell surface if they were additionally functionalized with a small quantity of anti-CD45 (Fig. 2c, d). Crosslinking of CD45 via anti-CD45-bearing particles did not inhibit T cell proliferation in response to anti-CD3/CD28 beads (Supplementary Fig. 4b), suggesting that CD45 binding did not inhibit TCR/costimulation/cytokine signalling.
Guided by these findings, we incorporated a small quantity of anti-CD45 into the NGs (10 mole % relative to the IL-15Sa payload) to provide non-covalent attachment of the NGs to cells (Fig. 2e). We also adsorbed a small quantity of poly(ethylene glycol)-b-poly(L-lysine) (PEG-PLL) to the NGs immediately following the synthesis reaction. Covalent coupling of a portion of PEG-PLL to residual crosslinker NHS groups at the particle surfaces provided a uniform positive zeta potential to the particles and promoted initial electrostatic particle/membrane association (Fig. 2e), maximizing the efficiency and total NG loading per cell (Supplementary Tables 2-3). With this approach, T cells could be homogeneously loaded with a desired dose of cytokine NGs, up to ~8 μg IL-15Sa per 106 T cells (Fig. 2f and Supplementary Table 3). Cytokine NGs containing anti-CD45 were retained on the surfaces of unstimulated T cells for at least 7 days (Fig. 2g-h). An analogous approach using human anti-CD45 led to similar cell surface retention of NGs on human CD8+ T cells (Supplementary Fig. 5). Anti-CD45/protein-NGs coupled to primed T cells released protein much faster when the cells were stimulated with anti-CD3/CD28 beads or peptide-pulsed dendritic cells (Fig. 2i-j and Supplementary Fig. 6a-b). Lastly, as a portion of activated effector T cells might be expected to undergo apoptosis in vivo as part of their normal fate, we tested whether cell death would cause acute release of NG payloads that might lead to toxicity. As shown in Supplementary Fig. 6c-d, induction of apoptotic cell death in backpacked T cells using anti-CD95 led to no loss of NGs over several hours, suggesting there are no dramatic changes in cell-bound NGs on dying cells.
Cytokine NGs promote enhanced T cell expansion in vitro
aCD45/IL-15Sa-NG-backpacked T cells stimulated with anti-CD3/CD28 beads expanded ~100-fold in 5 days, a substantial increase over T cells pulsed with the same total quantity of free IL-15Sa for 1 hr and then washed out. Backpacked T cells also expanded more than cells cultured continuously with IL-15Sa, suggesting cell surface localization of the NGs enhanced receptor engagement (Fig. 3a, b). NGs linked to T cells covalently rather than via anti-CD45 (IL-15Sa-NGs) and NGs formed with a non-degradable crosslinker (aCD45/IL-15Sa-NGs (non-deg.)) stimulated weaker T cell expansion than redox-responsive, aCD45/IL-15Sa-NGs (Fig. 3a), suggesting that both stable cell surface retention and release of cytokine from NGs are important for maximal stimulation. Attachment of aCD45/IL-15Sa-NGs to purified polyclonal CD4+ and CD8+ T cells showed similar responsiveness of both T cell subsets to nanogel-promoted expansion (Supplementary Fig. 7a). To assess the impact of a delay between T cell preparation/backpacking and engagement with antigen in tumors, we tested the impact of incubating backpacked T cells with IL-7 for 3 days prior to TCR stimulation. With delayed stimulation, NGs still expanded the T cells in vitro, though to a lesser degree than cells stimulated immediately (Supplementary Fig. 7b). NGs enhanced T cell proliferative responses to anti-CD3/CD28 beads at doses as low as ~30 ng IL-15Sa/106 cells (Fig. 3c). IL-15Sa-backpacked T cells maintained approximately constant levels of IL-15Rβ (CD122) and maintained stimulation of T cells for at least a week in culture, as evidenced by elevated levels of pSTAT5 and Ki67 over 9 days (Fig. 3d). Addition of a CD45 inhibitor did not alter the proliferative response to the NGs (Supplementary Fig. 8), indicating that NG anchoring did not trigger suppressive CD45 phosphatase activity.
Figure 3. IL-15Sa-nanogel backpacks promote T cell expansion in vitro.
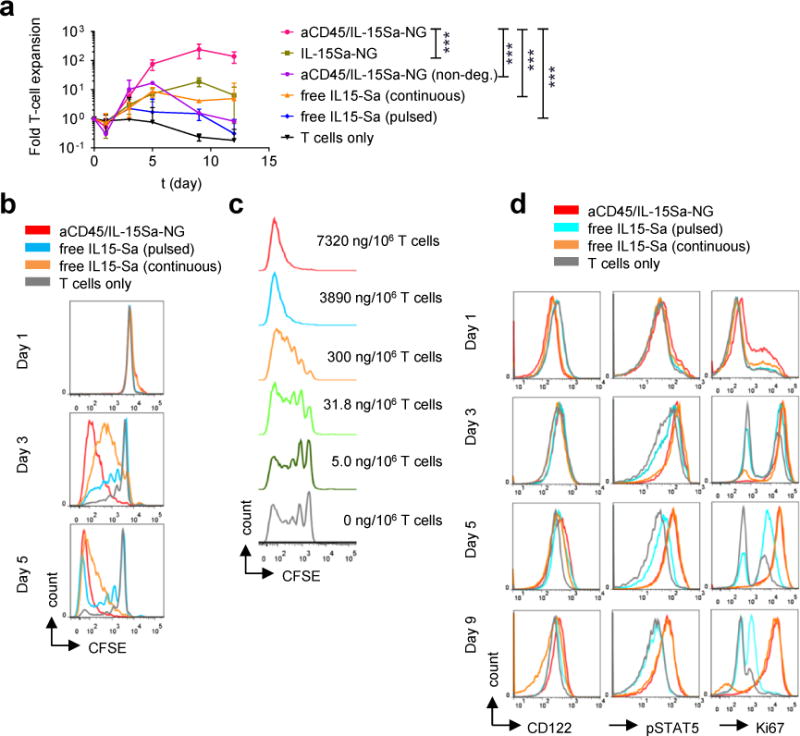
(a) Fold expansion of naïve CD8+ T cells stimulated with anti-CD3/CD28 beads in the presence of surface bound aCD45/IL-15Sa-NGs (7.5 μg IL-15Sa/106 cells), IL-15Sa-NGs, non-degradable NGs (aCD45/IL-15Sa-NGs(non-deg.)), or incubated with free IL-15Sa at equivalent doses either pulsed for 1 hr or continuously cultured with the same cytokine for 12 days. Data represent the mean ± 95%CI. (n=3 independent samples) and analysed by One-Way ANOVA and Tukey’s tests (data at day 9). ***, p < 0.0001. (b) Carboxyfluorescein succinimidyl ester (CFSE)-labelled naïve pmel-1 CD8+ T cells were stimulated with anti-CD3/CD28 beads in the presence of surface bound aCD45/IL-15Sa-NGs (7.5 μg IL-15Sa/106 T cells) or incubated with an equivalent amount of free IL-15Sa for indicated days then analysed by flow cytometry. (c) CFSE dilution of naïve pmel-1 CD8+ T cells stimulated with anti-CD3/CD28 beads in the presence of various densities of surface bound aCD45/IL-15Sa-NGs. (d) Flow cytometry analysis of IL-15 surface receptors, pSTAT5, and Ki67 levels in naïve pmel-1 CD8+ T cells stimulated with anti-CD3/CD28 beads in the presence of surface bound aCD45/IL-15Sa-NGs (7.5 μg IL-15Sa/106 cells) or incubated with an equivalent amount of free IL-15Sa over 9 days. All data are one representative of at least two independent experiments.
T cell expansion in tumors
We next investigated the impact of NG-mediated cytokine delivery on ACT T cell expansion in vivo, via adoptive transfer of pmel-1 TCR-transgenic gp100-specific T cells23 carrying aCD45/IL-15Sa-NGs in the syngeneic B16F10 melanoma mouse model5. C56Bl/6 mice with established subcutaneous (s.c.) B16F10 flank tumors were lymphodepleted, then received intravenous adoptive transfer of primed pmel-1 Thy1.1+CD8+ T cells, followed by intravenous (i.v.) injection of 40 μg free IL-15Sa, or aCD45/IL-15Sa-backpacked T cells at the same cytokine dose (Fig. 4a). Seven days later, tissues were analysed by flow cytometry, using Thy1.1 expression to distinguish ACT vs. endogenous CD8+ T cells (Fig. 4b). ACT adjuvanted by free systemic IL-15Sa led to substantial expansion of both transferred pmel-1 T cells and endogenous T cells in the blood (Fig. 4c), and also expanded NK cells and CD4+ T cells in the systemic circulation (Supplementary Fig. 9). Systemic IL-15Sa also expanded endogenous T cells in tumor-draining lymph nodes (TDLNs) and tumors (Fig. 4d-f). By contrast, IL-15Sa delivered as backpacks expanded the transferred CD8+ T cells but did not expand endogenous T cells in any compartment (Fig. 4c-f). This lack of bystander stimulation is consistent with control experiments where we assessed the transfer of labelled NGs to endogenous innate or adaptive cells in the blood two days after injecting backpacked pmel cells; only a very minor population of endogenous CD8+ T cells (≤1.3%) were found to acquire NG fluorescence (Supplementary Fig. 10). In tumors, where we expected antigen recognition to accelerate IL-15Sa release from the NGs, IL-15Sa-backpacked T cells expanded 16-fold more than pmel-1 cells in the soluble IL-15Sa-adjuvanted group and 1000-fold more than the T cells without cytokine support (Fig. 4b, f). Ranking tissues in order of expected increasing antigen concentration (blood<distal LN<TDLN<tumor), we observed a corresponding increasing ratio of ACT T cell counts in the NG group vs. ACT cells in the free IL-15Sa-adjuvanted group (Fig. 4g). Backpacked T cells in the tumor were also still proliferating and producing effector cytokines (Fig. 4h-i). Further evidence for the antigen-driven stimulation by the NG backpacks came from comparison of T cell expansion in tumor-bearing vs. control non-tumor-bearing animals. As shown in Supplementary Fig. 11, at day 3 post transfer, T cells were already expanded by NGs in tumors, but not in distal LNs or LNs of non-tumor-bearing mice; by contrast, systemic IL-15Sa had modestly expanded T cells in LNs of both groups. Unlike TCR-triggered T cells, B16F10 cells showed no extracellular reducing activity (Supplementary Fig. 12), suggesting that cytokine release in the tumors is mediated by T cell surface redox rather than a reducing microenvironment in the tumors. NG IL-15Sa delivery thus focused cytokine action on the transferred T cells, and preferentially in antigen-bearing microenvironments in vivo.
Figure 4. IL-15Sa-NGs promote specific expansion of adoptively transferred T cells in tumors.
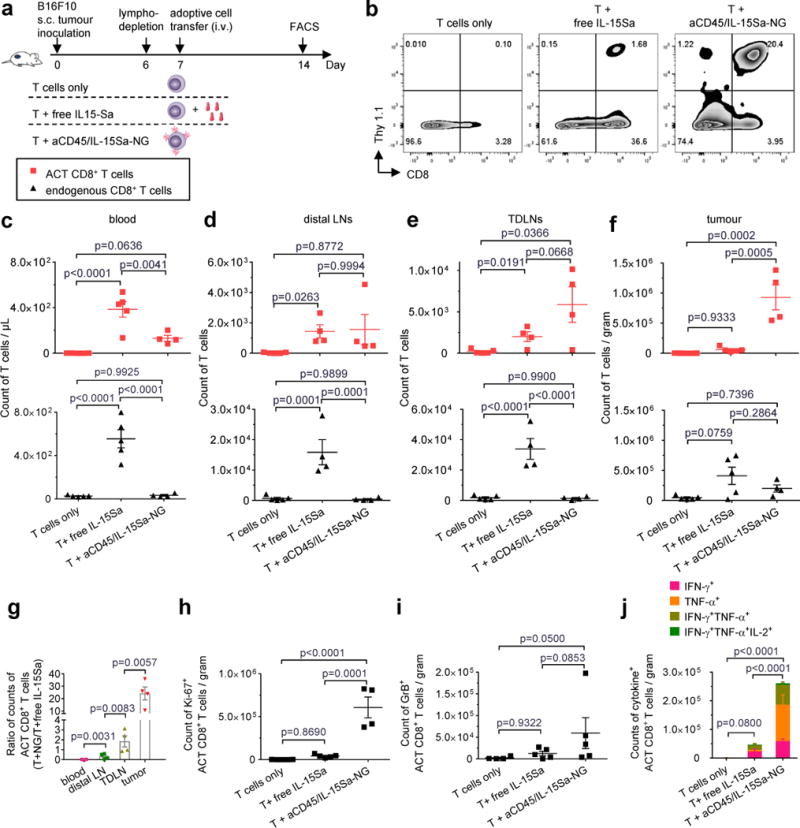
B16F10 tumor cells (0.5 × 10⁶) were injected s.c. in Thy1.2+ C57Bl/6 mice and allowed to establish for 6 days. Animals were then sublethally lymphodepleted by irradiation on day 6 and received i.v. adoptive transfer of 10×106 primed pmel-1 Thy1.1+CD8+ T cells on day 7. Treatment groups included T cells alone, T cells followed by a systemic injection of free IL-15Sa (40 μg), and T cells coupled with aCD45/IL-15Sa-NGs (40 μg). On day 14, mice were sacrificed and tissues were processed and analysed by flow cytometry (n=4 biologically independent animals). (a) Experimental timeline. (b) Representative flow cytometry plots showing the frequencies of tumor infiltrating Thy1.1+CD8+ T cells among all the lymphocytes. (c-f) Counts of adoptively transferred (ACT) Thy1.1+CD8+ T cells (red squares) and endogenous Thy1.1−CD8+ T cells (black triangles) in blood (c, normalized by volume), non-tumor draining lymph nodes (d, distal LNs), tumor draining lymph nodes (e, TDLNs) and tumors (f, normalized by weight). (g) Ratios of counts of ACT CD8+ T cells in the group of T + aCD45/IL-15Sa-NG to that of T + free IL-15Sa in different tissues. (h) Counts of Ki67+ ACT CD8+ T cells in tumors analysed by intracellular staining and flow cytometry. (i) Counts of GranzymeB+ ACT CD8+ T cells in tumors analysed by intracellular staining and flow cytometry on Day 10 (n=5 biologically independent animals). (j) Counts of polyfunctional ACT CD8+ T cells in tumors by intracellular cytokine staining. Data represent the mean ± s.e.m. and are analysed by One-Way ANOVA and Tukey’s tests. All data are one representative of at least two independent experiments.
Increased therapeutic window for adjuvant cytokine therapy
We noted that animals receiving free high-dose IL-15Sa lost weight following therapy, which prompted us to explicitly evaluate the toxicity of IL-15Sa as a function of dose and delivery modality. We treated tumor-bearing mice with pmel-1 T cells and IL-15Sa in different dosing schemes (Fig. 5a). Animals receiving >10 μg of free IL-15Sa steadily lost weight and eventually succumbed to lethal immunotoxicity irrespective of dosing regimen, setting the maximum tolerated dose (MTD) at 10 μg in this model (Fig. 5b). In contrast, when administered in the form of T cell-bound NGs, no overt toxicity was observed up to the maximum achievable IL-15Sa loading per cell (80 μg IL-15Sa/10×106 T cells, Fig. 5b). Free IL-15Sa stimulated cytokine production from both pmel-1 and endogenous T cells in the blood, in contrast to IL-15Sa delivered by NGs, where the majority of both backpacked and endogenous T cells remained quiescent in the systemic circulation (Fig. 5c-d). This lack of systemic stimulation correlated with low levels of detectable free IL-15Sa in the blood for backpacked T cells, even when much higher total doses of cytokine were administered compared to the soluble bolus injections (Supplementary Fig. 13a). In healthy animals, >10 μg free IL-15Sa does not elicit high levels of serum cytokine induction21. However, in this lymphodepletion setting, ACT with >10 μg free IL-15Sa induced systemic cytokine release and elevated liver enzymes (Fig. 5e-f and Supplementary Fig. 13b), whereas backpacked T cells elicited basal levels of these biomarkers up to the maximum administrable dosage.
Figure 5. IL-15Sa-NG backpacks increase the therapeutic window for adjuvant cytokine delivery during ACT.
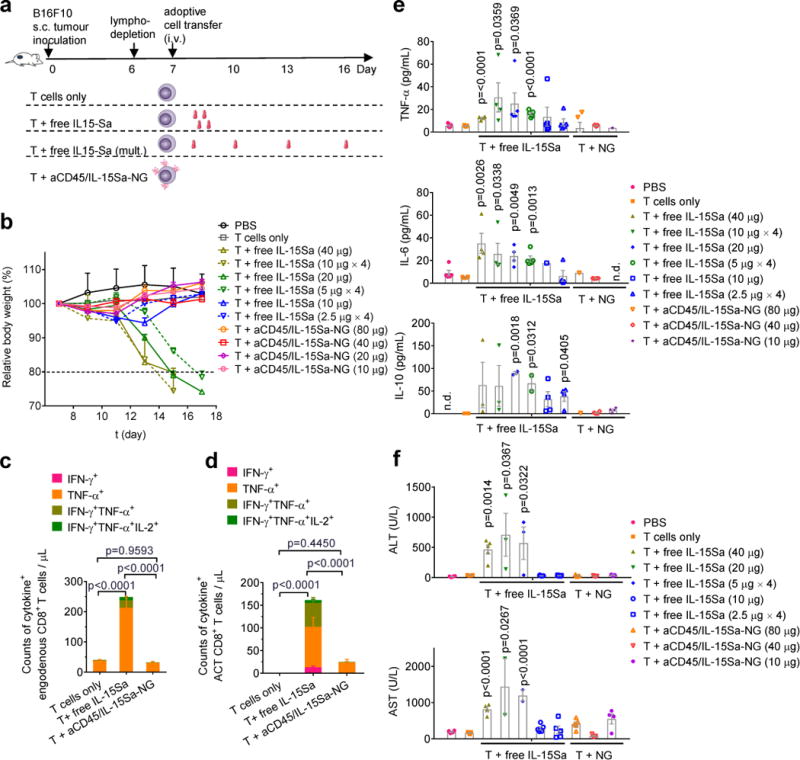
B16F10 tumor cells (0.5 × 10⁶) were injected s.c. in Thy1.2+ C57Bl/6 mice and allowed to establish tumor for 6 days. Animals were then sublethally lymphodepleted by irradiation on day 6 and received i.v. adoptive transfer of 10×106 activated pmel-1 Thy1.1+CD8+ T cells on day 7. Animals received sham injections of PBS, T cells only, T cells followed by different doses of i.v. injected free IL-15Sa as single dose (immediately after adoptive transfer) or split into multiple doses (days 7, 10, 13 and 16), or T cells backpacked with aCD45/IL-15Sa-NG at different doses. Body weights and systemic cytokine/chemokine/liver enzyme levels were analysed over time. (a) Experimental timeline and groups. (b) Body weight normalized to day 7 over time for different treated groups. (c-e) Counts of cytokine+ endogenous CD8+ T cells (c) and ACT CD8+ T cells (d) in blood analysed by intracellular cytokine staining and flow cytometry. (e, f) Serum cytokine levels (e) and liver enzymes (f) were measured from samples collected on day 17 or when the mice were euthanized due to toxicity. Data represent the mean ± s.e.m. (n=5 biologically independent animals) and are compared with control group (T cells only) for statistical analyses using One-Way ANOVA and Tukey’s tests; n.d., not detectable. Shown is one representative of two independent experiments.
To determine the impact of the increased therapeutic window afforded by IL-15Sa-NGs, we compared the anti-tumor efficacy of ACT with T cells only, T cells and free IL-15Sa (at the MTD of 10 μg), or NG-backpacked T cells following the same treatment scheme as Fig. 5a. Tumor growth was substantially delayed in the 10 μg IL-15Sa-NG group compared to T cells with free IL-15Sa support at the same dose (Fig. 6a). However, tumor suppression was further enhanced by increasing the cytokine-NG dose, with animals treated at the maximal 80 μg dose showing a 1.7-fold increase in median survival time relative to animals treated with the MTD of free IL-15Sa (Fig. 6a-b). Notably, despite the use of a xenogeneic (human) IL-15Sa cytokine, no anti-hIL-15Sa antibodies above background were detected in serum following treatment in any of the NG-backpack-treated groups (Supplementary Fig. 14). We also compared NG-mediated IL-15 delivery to cytokine-loaded multilamellar lipid capsules as used in our first report of the backpacking approach11, and found that even when administered at the same total cytokine dose, IL-15-NGs elicited much greater T cell expansion in tumors and greater tumor regression than lipid nanocapsule backpacks (Supplementary Fig. 15). The lack of toxicity associated with NG-T cell transfer allowed us to achieve further anti-tumor efficacy by carrying out multiple injections of backpacked T cells. Administration of a second dose of NG-T cells one week after the first injection led to greatly improved survival and cures in 60% of treated animals, while systemic IL-15Sa and T cells dosed twice led to toxicity (Supplementary Fig. 16).
Figure 6. TCR signalling-responsive NG backpacks improve T cell therapies.
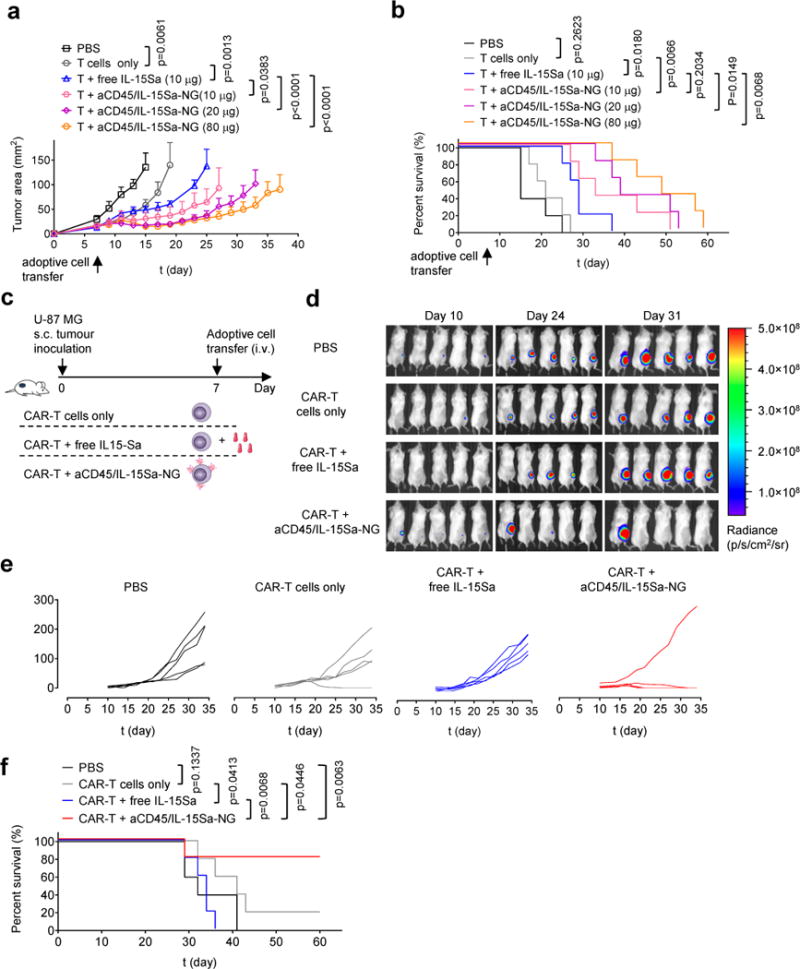
(a, b) B16F10 tumor cells (0.5 × 10⁶) were injected s.c. in Thy1.2+ C57Bl/6 mice (n=5 biologically independent animals) and allowed to establish for 6 days. Animals were then sublethally lymphodepleted by irradiation on day 6 and received i.v. adoptive transfer of 10 × 106 activated pmel-1 Thy1.1+CD8+ T cells on day 7. Animals received sham injections of PBS, T cells only, T cells with 10 μg i.v. injected free IL-15Sa, or aCD45/IL-15Sa-NG-backpacked T cells at indicated IL-15Sa doses. Shown are average tumor growth curves (a) and survival curves (b) of each treatment group. (c-f) Luciferase-expressing U-87 MG human glioblastoma cells (1.0 × 10⁶) were injected s.c. in NSG mice (n=5 biologically independent animals). Animals received i.v. adoptive transfer of human T cells (2.6 × 10⁶ total cells, 38% transduced with EGFR-targeting CAR (1.0 × 10⁶ CAR-T cells)) on day 7. Animals were treated with sham saline injections, CAR-T alone, CAR-T followed by 13.8 μg of free IL-15Sa, or CAR-T cells coupled with aCD45/IL-15Sa-NGs (13.8 μg). (d) In vivo bioluminescence imaging of luciferase-expressing U-87 MG tumors over time. (e-f) Individual tumor growth curves (e) and survival curves (f) of treatment groups are shown. Statistical analyses were performed using Two-Way ANOVA test for tumor growth data and Log-rank test for survival curves. Data represent the mean ± s.e.m. All data are one representative of at least two independent experiments.
Finally, we evaluated whether NG-delivered cytokine could also positively impact the function of CAR-T cells, as an important modality of T cell therapy in the clinic4. For this purpose, we employed human CAR-T cells targeting EGFR in a luciferase-expressing human glioblastoma model in immunodeficient NSG mice (Fig. 6c). CAR-T cells maximally backpacked with IL-15Sa-NGs were compared to CAR-T cells alone or T cells supplemented with an equivalent systemic dose of free IL-15Sa. Transfer of 106 CAR-T cells had a small impact on tumor growth and survival, which did not reach statistical significance; responses were marginally improved by the addition of free IL-15Sa (Fig. 6d-f). By contrast, NG-backpacked CAR T cells eradicated tumors in 4 of 5 animals (Fig. 6d-f). Supportive of clinical protocols working from cryopreserved T cell products, NG-loaded CAR-T cells could also be frozen and retain unmodified cytokine-driven expansion post-thaw (Supplementary Fig. 17). Thus, NG delivery of cytokines also has the potential to enhance CAR-T cell therapy.
DISCUSSION
ACT has recently achieved striking clinical responses in certain haematological cancers24. However, ACT for solid tumors has remained challenging, at least in part due to the immunosuppressive tumor microenvironment1,25. Supporting administration of immunomodulators might overcome this microenvironment, but these drugs are often limited by systemic toxicities7,26. Here, we demonstrated a chemical strategy to increase the efficacy and safety of adjuvant drug therapy for ACT, by linking drug delivery to TCR triggering in the tumor and TDLNs.
Two biological discoveries enabled this approach: First, we found that T cells modulate their cell surface redox state as a function of activation status (naïve vs. primed cells) and immediately following TCR-cognate-peptide-MHC engagement. The mechanisms underlying this redox regulation remain to be defined but may involve altered expression of transmembrane reducing enzymes. The second key finding was the identification of CD45 as a stable, non-internalizing anchor for NGs, even when the particles expose protein ligands that normally trigger endocytosis. Prior studies reported that CD45-targeted nanoemulsions are endocytosed on binding to CD45 expressed by murine macrophages27, suggesting that binding to CD45 may have different outcomes in different immune cell populations. Biochemical studies in Jurkat T cells also reported a half-life for cell-surface CD45 of 6-15 hr28, which may reflect distinct behaviour of free vs. particle-crosslinked CD45 and/or differences in the biology of primary T cells and cell lines. Although CD45 plays important roles in regulating T cell signalling at the immunological synapse29,30, anchoring of NGs to CD45 did not impact proliferative responses to TCR/cytokine stimuli.
The identification of reaction conditions yielding discrete nanoparticles through solution crosslinking of proteins is consistent with prior literature on protein micro- and nano-gels31–33. The NG strategy enabled high per-cell doses of protein to be delivered; by comparison, measurements of maximal T cell loading with an anti-CD45 monoclonal suggested that use of an anti-CD45/cytokine fusion as an alternative would achieve at best a 70-fold lower maximal cytokine payload.
TCR-responsive NGs reduce to practice the approach of spatiotemporally-controlled drug delivery, linking tissue-specific cell signalling (here, antigen recognition) to drug release. The crosslinker system we used responds to local changes in the redox environment, and although some tumors are thought to intrinsically present a reducing state, melanomas by contrast have been shown to generate an oxidative microenvironment34. We detected no extracellular reducing activity in B16F10 tumor cells assayed immediately after removal from established tumors, suggesting cytokine release from the backpacks is primarily driven by T cell-mediated cell surface reduction. However, we can also envision NGs responsive to the dysregulated physiology of the tumor microenvironment itself. Tumors are often hypoxic, acidic, and overexpress various proteases35. Numerous environment-responsive chemistries have been developed in the drug delivery field to achieve tissue-selective drug release, for example, particles responsive to tumor-enriched matrix metalloproteinases36, acidic pH37,38, or other signals35,39. Implementation of these approaches in the NG crosslinker to impart responsiveness to cell surface enzymes, tumor-specific proteases, or pH are a possibility.
This chemical strategy complements genetic engineering approaches to control the location and timing of ACT T cell activation/expansion. Safe delivery of cytokine support is also being pursued by linking cytokine expression to TCR signalling-regulated transcription factors40–42 and expressing membrane-bound cytokines43. These and other44–47 elegant genetic approaches promote spatiotemporal control over CAR-T cell activity. However, chemical backpacking may be more effective with cytokines that are very toxic or whose expression during in vitro preparation of T cells inhibits T cell expansion (e.g., IL-12). A constraint of the backpacking approach is that it is an inherently self-limiting therapy, since stimulation of cell division leads to dilution of the backpacked drug cargo. This does not preclude some durability in stimulation, as evidenced by the NG backpacks continuing to stimulate T cells for at least 9 days in vitro. Self-limiting dosing can also be viewed as an attractive built-in safeguard against runaway stimulation of T cells or on-target/off-tumor T cell activation, which can lead to serious toxicities9,48.
METHODS
Methods and any associated references are available in the online version of the paper.
ONLINE METHODS
Materials
ALT-803, a human IL-15 superagonist (Sa), obtained from Altor BioScience Corporation (Miramar, FL, USA) was generated as described previously49. IL-2-Fc, a bivalent fusion protein of the C-terminus of murine wild type IL-2 linked to a mouse IgG2a backbone, was a generous gift from Dane Wittrup's lab at MIT and was prepared as described previously50. Bovine serum albumin (BSA) was purchased from Sigma-Aldrich (St Louis, MO, USA). Human IgG was purchased from Jackson Immuno Research Labs (West Grove, PA, USA). NH2-PEG10k-NH2 was purchased from Laysan Bio (Arab, AL, USA). Polyethylene glycol-b-polylysine (PEG5k-PLL33k) was purchased from Alamanda Polymers (Huntsville, AL, USA). Bis(sulfosuccinimidyl) suberate was purchased from Thermo Fisher Scientific (Waltham, MA, USA). Anti-mouse CD45RB (clone: MB23G2) was purchased from BioXCell (West Lebanon, NH, USA). Anti-human CD45 (clone: MEM-28) was purchased from Abcam (Cambridge, United Kingdom). Anti-CD3/CD28 beads were purchased from Thermo Fisher Scientific. All other chemicals and solvents were purchased from Sigma-Aldrich unless otherwise noted. All reagents were used as received unless otherwise noted.
Animals and cell lines
Experiments and handling of mice were conducted under federal, state, and local guidelines and with approval from the Massachusetts Institute of Technology IACUC. Six to eight week-old female Thy1.2+ C57Bl/6 mice, TCR-transgenic Thy1.1+ pmel-1 mice, and Nod/SCID/γ−/− (NSG) mice were from the Jackson Laboratory. B16F10 melanoma cells and U-87 MG human glioblastoma cells were acquired from American Type Culture Collection (Manassas, VA, USA) and cultured in DMEM. Click Beetle Red luciferase (CBR-luc) was introduced into U-87 MG cells by lentiviral transduction for bioluminescence imaging.
Isolation of naïve and primed mouse T cells
Spleens from C57Bl/6 or pmel-1 Thy1.1+ mice were ground through a 70-μm cell strainer and red blood cells were removed by incubating with ACK lysis buffer (2 mL per spleen) for 5 min at 25°C. Naïve CD4+ or CD8+ T cells were isolated from splenocytes directly via magnetic negative selection using an EasySep™ Mouse CD4+ or CD8+ T cell Enrichment Kit (Stemcell Technologies, Vancouver, Canada) respectively. For activated CD8+ T cells, the splenocytes were washed with PBS and then cultured in RPMI 1640 medium containing 10% FCS, concanavalin A (con-A) (2 μg/mL) and IL-7 (1 ng/mL) at 37°C for activation. After 2-day incubation, dead cells were removed by Ficoll-Pague Plus gradient separation and CD8+ T cells were isolated using an EasySep™ Mouse CD8+ T cell Enrichment Kit. Purified CD8+ T cells were re-suspended at 1.5×10⁶ per mL in RPMI containing 10 ng/mL recombinant murine IL-2. After 24 h, cells were washed 3 times in PBS and re-suspended in buffer or media for in vitro and in vivo studies. Con-A-primed mouse CD8+ T cells were used as activated T cells for all the in vitro and in vivo studies unless otherwise stated. In a tumor therapy study (Supplementary Fig. 16), pmel-1 splenocytes were isolated as described and cultured in the presence of 1 μM human gp10025–33 and culture media containing mouse IL-2 (10 ng/ml) and IL-7 (1 ng/mL) for 3 days followed by Ficoll-Pague Plus gradient separation. After culture in the media containing mouse IL-7 (10 ng/mL) for one more day, the pmel-1 CD8+ T cells (>95%) were used for adoptive cell transfer.
Isolation of naïve and primed human CD8+ T cells
Total peripheral blood mononuclear cells (PBMCs) were obtained from healthy donors (New York Blood Center, Long Island City, NY, USA). Naïve CD8+ T cells were isolated directly using a RosetteSep™ Human CD8+ T cell Enrichment Cocktail (Stemcell). The human CD8+ T cells were activated in non-tissue culture plated coated with anti-human CD3 (2.5 μg/mL) and anti-human CD28 (1.0 μg/mL) in the presence of human IL-2 (50 UI/mL) for 2 days. Cells were washed 3 times in PBS and re-suspended in buffer or media for in vitro studies.
Measurement of T cell surface reduction activity using WST-1 assay
T cell surface reduction activity was determined using a commercial WST-1 assay kit containing WST-1 and an electron coupling reagent (Roche, Basel, Switzerland). Naïve or con-A-primed CD8+ T cells from C57Bl/6 mice were suspended in Hank's Balanced Salt Solution (HBSS) at 1×10⁶/mL. The commercial WST-1 reagent mixture (10 μL) was added to the T cell suspension (200 μL). The cells were incubated at 37°C for 1 h. WST-1 formazan production rate was measured with a plate reader (Tecan Infinite® M1000 PRO, Tecan, Männedorf, Switzerland) for increased absorbance at 450 nm during the incubation. For the measurement of cell surface reduction in response to TCR triggering, naïve or con-A-activated CD8+ T cells were incubated with anti-CD3/CD28-coated beads (1:1 cell:bead ratio) or gp100 peptide (10 μg/mL) in the presence in IL-7 (1 ng/mL) at 37°C for 24 h. Cells were washed and resuspended in HBSS (1×10⁶/mL) and measured for surface reduction with the same commercial WST-1 reagent mixture after 1-h incubation at 37°C.
Synthesis of NHS-SS-NHS crosslinker
As shown in Supplementary Scheme 1, in a 125 mL round-bottom flask, 2-hydroxyethyl disulphide (1.54 g, 10 mmol) was dissolved in tetrahydrofuran (THF, 30 mL, anhydrous) and added dropwise to the solution of phosgene (15 mL, 15 wt. % in toluene, 22 mmol). The mixture was stirred at 25°C for 10 h followed by the removal of the solvent under vacuum. N-hydroxysuccinimide (NHS) (2.3 g, 22 mmol) was dissolved in THF (30 mL, anhydrous) and added as one portion, and then dry triethylamine (1.57 mL, 11 mmol) was injected. The reaction was carried at 40°C for 16 h. The solvent was removed under vacuum and the mixture was filtered to remove precipitates. The crude product was purified by silica gel column chromatography (dichloromethane/methanol = 10/1) and recrystallized with icy hexane (80 mL). The resulting white solid was dried under vacuum (3.1 g, yield 71%). 1H-NMR (CDCl3, 500 MHz): δ 4.58 (t, 4H), 3.05 (t, 4H), 2.84 (s, 8H). 13C-NMR (CDCl3, 500 MHz): δ 168.77, 151.66, 68.84, 36.68, 25.69. ESI (m/z): calcd for C14H16N2O10S2, 436.4 [M]; found, 459.0 [M+Na]+.
Synthesis of nanogels
NHS-SS-NHS (93.5 μg, 0.214 μmol) was dissolved in 9.35 μL DMSO was added to IL-15-Sa (1320 μg, 0.0143 μmol) solution in 132 μL phosphate buffered saline (PBS) pH 7.4. The mixture was rotated at 25°C for 30 min followed by the addition of 1188 μL PBS buffer. For nanogels (NGs) incorporating the CD45 targeting antibody, anti-CD45 (215 μg, 0.0014 μmol) in 31.7 μL PBS buffer was then added to the diluted solution. The reaction mixture was rotated at 25°C for another 30 min. The preparation of IL-15Sa-NG without anti-CD45 was similar except that anti-CD45 was replaced by NH2-PEG10k-NH2 (715 μg, 0.0715 μmol) in 35.8 μL PBS buffer. Other protein NGs (IL-2Fc-NG, BSA-NG, IgG-NG) were prepared with similar protein concentrations and the same crosslinker/protein mole ratio. The resultant NGs were then washed with PBS (1.5 mL × 3) in an Amicon centrifugal filter (molecular weight cut-off = 100 kDa, Millipore, Billerica, MA, USA). Non-degradable NGs (e.g., aCD45/IL-15Sa-NG (non-deg.)) were prepared using a permanent linker, bis(sulfosuccinimidyl) suberate in lieu of NHS-SS-NHS. To enhance conjugation of aCD45/IL-15Sa-NGs to T cells, prior to T cell coupling freshly prepared aCD45/IL-15Sa-NG solution was diluted to 1 μg/μL followed by the addition of polyethylene glycol-b-polylysine (PEG5k-PLL33k) (43.6 μg, 0.0011 μmol) in 43.6-μL PBS. The mixture was rotated at 25°C for 30 min and used without further purification.
Fluorescence and biotin labelling of NGs
To prepare fluorescently-labelled NGs, cytokine cargos were fluorescently labelled with Alexa Fluor 647 NHS ester (Thermo Fisher Scientific) and purified with Amicon ultra-centrifugal filters (molecular weight cut-off 50kDa). Fluorescent cytokine was mixed with non-labelled cytokine (10 mol% labelled cytokine) for the preparation of fluorescent NGs following the same procedure as described above. For the preparation of biotinylated NGs, NHS-SS-NHS (93.5 μg, 0.214 μmol) dissolved in 9.35 μL DMSO was added to IL-15Sa (1320 μg, 0.0143 μmol) solution in 132 μL PBS buffer. The mixture was rotated at 25°C for 20 min followed by the addition of EZ-Link NHS-LC-LC-Biotin (40.6 μg, 0.072 μmol, Thermo Fisher Scientific) in 7.5 μL DMSO. The mixture was rotated at 25°C for another 20 min and then diluted with 1188 μL PBS buffer followed by the addition of anti-CD45 (215 μg, 0.0014 μmol) in 31.7 μL PBS buffer. The rest procedure was the same as described above.
Characterizations of NGs
NG formation and complete reaction of protein cargos was verified by HPLC with a size exclusion column (BioSep-SEC-s4000, Phenomenex, Torrance, CA, USA). NG sizes were determined by Transmission electron microscopy (FEI Tecnai, Hillsboro, OR, USA) and dynamic light scattering. NGs were dispersed in deionized water to a concentration of 0.5 mg/mL. The hydrodynamic size and ξ-potential were measured with a Malvern Zetasizer (Malvern, United Kingdom). The final concentrations of NGs were determined with a NanoDrop 1000 Spectrophotometer (Thermo Fisher Scientific).
Release kinetics of cytokines from NGs
The NGs were dispersed in PBS (0.1 mg/mL) with or without glutathione (GSH, 1mM) and incubated at 4°C. At selected time intervals, replicates of solution were analysed with HPLC equipped with a size exclusion column to determine the percentage of released cytokine. Released cytokine was also subjected to a MicroFlex Matrix-absorption laser desorption instrument time-of-flight (MALDI-TOF, Bruker, Billerica, MA, USA) to determine the molecular weight.
Coupling of NGs to T cells
In a typical experiment, aCD45/IL-15Sa-NG (950 μg, 0.010 μmol) labelled with Alexa Fluor 647 in 950 μL PBS was added to mouse CD8+ T cells (95 × 106) in 475 μL HBSS followed by incubation at 37 °C for 1 h. The T cells with surface coupled NGs were collected by centrifugation at 800×g for 5 min, washed with PBS (1.0 mL × 2), and resuspended in buffer or media at desired concentrations for in vitro or in vivo studies. For measurements of total NG coupling, fluorescently-labelled NGs were coupled to T cells, and supernatants were collected and measured for fluorescence intensity at excitation/emission wavelengths of 640/680 nm using a plate reader (Tecan Infinite® M1000 PRO). Fluorescence readings were converted to NG concentrations using standard curves prepared from serial dilutions of NG stock solutions. The amount of coupled NG was calculated by subtracting the unbound NG from the total added amount. NG loading per cell was controlled by varying the mass of NGs added to cells for coupling. For the conjugation of NGs lacking anti-CD45 to T cells, IL-15Sa-NG (950 μg, 0.010 μmol) in PBS (950 μL) was first activated with sulfosuccinimidyl 4-(N-maleimidomethyl)cyclohexane-1-carboxylate (218 μg, 0.50 μmol) or bis(sulfosuccinimidyl) suberate (286 μg, 0.50 μmol), collected with Amicon ultra-centrifugal filter (molecular weight cut-off 50 kDa) and washed with PBS (1.5 mL × 3), and then added to CD8+ T cells (95 × 106) in 475 μL HBSS followed by incubation at 37 °C for 1 hr. Cells were washed and collected similarly. The amount of conjugated NG was determined similarly as described above. Coupling of NGs with or without anti-human CD45 to human CD8+ T cells followed the similar procedures as described above.
Release kinetics of proteins from NG coupled on T cell surface
Human IgG-NG with Alexa Fluor 647 fluorescence labelling were prepared and coupled to primed polyclonal C57Bl/6 CD8+ T cells as described above. T cells were incubated in media at 37°C with or without anti-CD3/CD28 beads at a 1/1 beads to T cells ratio. Cell were collected at selected time points and analysed with flow cytometry for measurement of mean fluorescence intensity (MFI) over time.
Preparation of liposomes with surface-conjugated antibodies and/or cytokines
Vacuum dried lipid films composed of 1,2-distearoyl-sn-glycero-3-phospho ethanolamine-N-[maleimide(polyethylene glycol)-2000 (maleimide-PEG2000-DSPE)/ cholesterol/ hydrogenated Soy L-α-phosphatidylcholine (HSPC)/ 1,2-distearoyl-sn-glycero-3-phosphoethanolamine-N-[biotinyl(polyethylene glycol)-2000 (biotin-PEG2000-DSPE) (Avanti Polar Lipids, Alabaster, AL, USA) in a molar ratio of 2.5/27/68/1.5 together with 1% of a fluorescent lipophilic tracer dye DiD were rehydrated in 250 μL of 50-mM 4-(2-hydroxyethyl)-1-piperazineethanesulfonic acid (HEPES)/150-mM NaCl-buffer (pH = 6.5). Lipids were vortexed every 10 min for 1 h at 62°C to form vesicles and size extruded through a polycarbonate membrane (0.2 μm). After washing in excess PBS and spinning down by ultracentrifugation at 110,000 g for 4 h, liposomes were re-suspended in 100 μl PBS per 1.4 mg of lipids. For coupling to maleimide groups of the liposomes, antibody, cytokine and antibody/cytokine mixtures at different molar ratios (2-5 mg/mL) were treated with 1.8 mM dithiothreitol (DTT) in the presence of 10 mM EDTA at 25°C for 20 min to expose hinge region free thiols. DTT was subsequently removed by using Zeba desalting columns before mixing with maleimide-bearing liposomes (1/1 wt./wt. for protein/lipid) in PBS. After incubation for 18 h at 25°C on a rotator, excess protein was removed by ultracentrifugation in excess PBS.
Internalization kinetics of liposomes and NGs by T cells
Antibody-conjugated liposomes (0.7 mg lipids) in 100 μL PBS were incubated with 20×106 primed pmel-1 Thy1.1+ CD8+ T cells in 0.5 ml complete RPMI supplemented with 10% fetal calf serum (FCS) for 30 min at 37°C with gentle agitation every 15 min. Conjugated T cells were washed with PBS (20 mL × 2) to remove unbound liposomes and incubated in RPMI media with recombinant IL-7 (1.5 ng/mL) and 10% FCS at 0.5 ×10⁶ cells/mL at 37°C. T cells with surface-coupled biotin-labelled NGs were prepared as described above and suspended in RPMI media with 10% FCS at 5.0 ×10⁵ cells/mL at 37°C. At staggered time points, replicates of cells were collected, washed with PBS buffer and then stained with streptavidin-PE-Cy7 (eBioscience) conjugate to detect surface-localized liposomes or NGs followed by flow cytometry analysis (FACS Canto, BD Biosciences, Franklin Lakes, NJ). Similar assays were performed with anti-CD3/CD28-activated human CD8+ T cells isolated from human peripheral blood mononuclear cells. For confocal imaging studies, T cells with surface-coupled Alexa Fluor 647-labelled NGs were collected at different time points, washed with PBS, and imaged in chamber slides using an LSM500 laser scanning confocal microscope (Carl Zeiss, Oberkochen, Germany).
In vitro proliferation assay of T cells
Naïve pmel-1 CD8+ T cells were labelled with carboxyfluorescein succinimidyl ester (CFSE) and then conjugated with aCD45/IL-15Sa-NG, IL-15Sa-NG, or aCD45/IL-15Sa-NG (non-deg.) respectively as described above. After removing unbound NGs, T cells were resuspended in RPMI with 10% FCS (5.0×10⁵/mL) and added to anti-CD3/CD28 coated beads at a 1:2 bead:T cell ratio. Free IL-15Sa was added to the cells in control groups at equivalent dose (pulsed or continuous). For the T cells pulsed with free IL-15Sa, cell media was replaced after 1-hr incubation to wash out the free IL-15Sa. For all the groups, cell media were replaced every 3 days and free IL-15Sa was replenished in the continuous treatment group. At selected time points, replicates of T cells were added with counting beads and washed with flow cytometry buffer (PBS with 2% FCS) followed by aqua live/dead staining. Cells were stained for surface markers (CD8, CD122) with antibodies followed by fixation and permeabilization with Intracellular Fixation & Permeabilization Buffer Set (eBioscience). Cells were then stained intracellularly for pSTAT5 and Ki67, and analysed with a flow cytometer (BD Canto, BD Biosciences).
In vivo therapy study and T cell expansion
B16F10 melanoma cells (5.0×10⁵) were injected subcutaneously (s.c.) in the flanks of C57Bl/6 mice on day 0. Animals were sublethally lymphodepleted by total body irradiation (5 Gy) 6 days post tumor inoculation. Primed pmel-1 CD8+ T cells (1.0×10⁷) alone or with surface coupled NGs in 200 μl PBS were administered intravenously (i.v.) at day 7. In other groups, free IL-15Sa was injected i.v. immediately after adoptive cell transfer (ACT) at equivalent total doses (single or multiple doses as indicated). Tumor area (product of 2 measured orthogonal diameters) and body weight were measured every two days. Mice were euthanized when body weight loss was beyond 20% of predosing weight, or tumor area reached 150 mm2 (as predetermined endpoint), or the animal had become moribund.
To monitor in vivo T cell expansion and function, mice were sacrificed on day 14 for necropsy and flow cytometry analyses. Inguinal lymph nodes (distal or tumor draining lymph node) and spleens were ground through a 70-μm cell strainer. Splenocytes were then lysed with ACK lysis buffer (2 mL per spleen) for 5 min at 25°C to remove red blood cells. Blood samples (200 μL) were lysed with ACK lysis buffer (1 mL × 2) for 5 min at 25°C. Tumors were weighed and ground through a 70-μm cell strainer. All cells were added with counting beads and washed with flow cytometry buffer (PBS with 2% FCS) followed by aqua live/dead staining. Cells were stained for surface markers (CD8, Thy1.1, CD4, NK1.1) with antibodies followed by fixation and permeabilization with Cytofix/Cytoperm (BD Biosciences). Cells were then stained intracellularly for Ki67. After washing with FACS buffer, cells were re-suspended in FACS buffer and analysed by flow cytometry. For intracellular cytokine staining, samples in single-cell suspensions were incubated with gp100 peptide (10 μg/mL) at 37°C for 2 h followed by the addition of brefeldin A (eBioscience, San Diego, CA, USA) and incubation for another 4 h. Following surface staining as described above, samples were fixed and permeabilized in the same manner and stained with antibodies against IFN-γ, TNF-α and IL-2. Flow cytometric analysis was carried out using a BD Fortessa (BD Biosciences), and data analysis was performed using FlowJo software (Tree Star, Oregon, USA).
Measurement of serum cytokine levels and liver enzymes for toxicity study
Serum samples from treated mice as described above were collected at day 17 or when the mice were euthanized due to toxicity, and analysed for cytokine levels using Cytometric Bead Array (CBA) Mouse Inflammation Kit (BD Biosciences). Serum samples were also sent to IDEXX Reference Laboratories for analysis of alanine transaminase (ALT) and aspartate transaminase (AST).
Measurement of serum antibody
Serum samples were collected from treated mice in different groups at 30 days post ACT. Serum concentration of anti-IL-15Sa antibody was measured by a standard ELISA procedure with calibration of a monoclonal anti-human IL-15 antibody (eBioscience).
Preparation of CAR-T cells for ACT
The huEGFRscFv-BBz chimeric antigen receptor was designed based on the heavy and light chains of cetuximab to form a single-chain variable fragment, which was fused to a portion of the extracellular and transmembrane domains of human CD8α, followed by the intracellular domains of 4-1BB and CD3ζ. The Bicistronic vector also encoded truncated human CD19 as a selectable marker, and was placed following a T2A ribosomal skip sequence. The plasmid coding hu EGFRscFv-BBz-CAR was synthesized and lentivirus packaging was produced by VectorBuilder. Isolated T cells were derived from purchased leukapheresis products obtained from de-indentified healthy donors under an IRB-approved protocol. T cells were stimulated with Dynabeads Human T Activator CD3/CD28 (Life Technologies) at a bead to cell ratio 3:1. T cells were cultured in RPMI 1640 medium supplemented with 10% fetal bovine serum, Hepes Buffer (20 mM), penicillin and streptomycin (1%) and IL-2 (20 IU/mL). T cells were transduced (TDN) with CAR lentivirus and or left untransduced (UTD) one day following bead stimulation, and then T cells were expanded for 10 days and cryopreserved until used. Surface expression of the CAR was confirmed and quantified with biotinylated human EGFR protein (ACRO Biosystems).
Cytotoxicity assays of human CAR-T cells
The ability of EGFR-specific CAR T cells to kill targets was tested in a 20-h luciferase-based killing assay. Transduced T cells and UTD were thawed and rested for 24 h at 37°C in a six-well plate in T cell medium. The effectors and targets were mixed together at the indicated E:T ratios and cultured in black-walled 96-well flat-bottom plates with 3 × 10⁴ target cells in a total volume of 200 mL per well in T cell medium. Target cells alone were seeded at the same cell density to determine the maximal luciferase expression (relative light units; RLUmax). After 20 h, 100 ml of supernatant per well was removed, and 100 ml of luciferase substrate (Bright-Glo, Promega) was added to the remaining supernatant and cells. Emitted light was measured after 10 min of incubation using the BioTek (SYNERGY NEO2) plate reader. Lysis was determined as [1 − (RLUsample)/ (RLUmax)] × 100. Two replicate experiments were performed; each was done in duplicate.
In vivo therapy study using human Chimeric Antigen Receptor (CAR)-T cells
Luciferase-expressing U-87 MG human glioblastoma cells (1.0 × 10⁶) were injected s.c. into NSG mice on day 0 (Jackson Laboratory). Animals received i.v. adoptive transfer of activated CAR-T cells (1.0 × 10⁶) alone or with surface coupled NGs on day 7. In other groups, free IL-15Sa was injected i.v. immediately after ACT at equivalent doses. Tumor area (product of 2 measured orthogonal diameters) and body weight were measured every two days. Mice were also imaged for bioluminescence every week to monitor the tumor growth. Mice were euthanized when body weight loss was beyond 20% of predosing weight, or tumor area reached 150 mm2 (as predetermined endpoint), or the animal had become moribund.
In vivo bioluminescence imaging
D-Luciferin (PerkinElmer, Waltham, MA, USA) suspended in PBS (15 mg/mL) was injected (150 mg/kg) i.p. 5 min before acquisitions. Bioluminescence images were collected on a Xenogen IVIS Spectrum Imaging System (Xenogen, Alameda, CA, USA). Living Image software Version 3.0 (Xenogen) was used to acquire and quantitate the bioluminescence imaging data sets.
Statistical analyses
Statistical analyses were performed using GraphPad Prism software. All values and error bars are mean ± s.e.m. except where indicated differently. Comparisons of tumor growth over time were performed using Two-way ANOVA tests, and comparisons of multiple groups at a single time point were performed using One-way ANOVA and Tukey’s tests. Survival data were analysed using the Log-rank test. Further information on experimental design is available in the Nature Research Reporting Summary linked to this article.
Ethics statement
Experiments and handling of mice were conducted under federal, state, and local guidelines and with approval from the Massachusetts Institute of Technology IACUC.
Life Sciences Reporting Summary
Further information on experimental design is available in the Life Sciences Reporting Summary.
Data Availability Statements
The authors declare that the data that support the findings of this study are available from the corresponding author upon request.
Supplementary Material
Acknowledgments
This work was supported in part by the Ragon Institute of MGH, MIT, and Harvard, the Melanoma Research Alliance (award 306833), the NIH (Koch Institute Support (core) grant P30-CA14051 from the National Cancer Institute and CA172164), and the Koch Institute Marble Center for Cancer Nanomedicine. L. Tang was funded by Cancer Research Institute (CRI) Irvington Postdoctoral Fellowship and Y. Zheng was supported by a National Science fellowship from the Agency for Science, Technology and Research, Singapore. L. Tang and Y. Xie were supported by ISREC Foundation with a donation from the Biltema Foundation and Swiss National Science Foundation (Project grant 315230_173243). M.V. Maus was supported by NIH CA K08166039. We thank Prof. K. Dane Wittrup (MIT) for the gift of engineered IL-2-Fc constructs. We thank the Koch Institute Swanson Biotechnology Centre for technical support on flow cytometry, IVIS imaging and MALDI mass spectrometry. D.J. Irvine is an investigator of the Howard Hughes Medical Institute.
Footnotes
Note: Any Supplementary Information and Source Data files are available in the online version of the paper.
AUTHOR CONTRIBUTIONS
L.T., Y.Z., M.B.d.M., and D.J.I. designed in vitro and syngeneic murine experiments. H.C.W. and E.K.J. provided ALT-803. L.T., Y.Z., D.J.I., A.P.C., S.B.K., and M.V.M. designed humanized mouse studies. L.T., Y.Z., L.M., M.B.d.M., Y.Q.X., N.L., A.P.C. and S.B.K. performed the experiments. L.T., Y.Z., M.B.d.M. and D.J.I. analysed the data and wrote the manuscript. All authors edited the manuscript.
COMPETING FINANCIAL INTERESTS
D.J.I., L.T., and Y.Z. are inventors on licensed patents related to the technology described in this manuscript. D.J.I. is a co-founder of Torque Therapeutics, which licensed patents related to this technology.
References
- 1.Rosenberg SA, Restifo NP. Adoptive cell transfer as personalized immunotherapy for human cancer. Science. 2015;348:62–68. doi: 10.1126/science.aaa4967. [DOI] [PMC free article] [PubMed] [Google Scholar]
- 2.Gill S, June CH. Going viral: chimeric antigen receptor T cell therapy for hematological malignancies. Immunol Rev. 2015;263:68–89. doi: 10.1111/imr.12243. [DOI] [PubMed] [Google Scholar]
- 3.Corrigan-Curay J, Kiem HP, Baltimore D, O'Reilly M, Brentjens RJ, Cooper L, Forman S, Gottschalk S, Greenberg P, Junghans R, Heslop H, Jensen M, Mackall C, June C, Press O, Powell D, Ribas A, Rosenberg S, Sadelain M, Till B, Patterson AP, Jambou RC, Rosenthal E, Gargiulo L, Montgomery M, Kohn DB. T cell immunotherapy: looking forward. Mol Ther. 2014;22:1564–1574. doi: 10.1038/mt.2014.148. [DOI] [PMC free article] [PubMed] [Google Scholar]
- 4.Johnson LA, Scholler J, Ohkuri T, Kosaka A, Patel PR, McGettigan SE, Nace AK, Dentchev T, Thekkat P, Loew A, Boesteanu AC, Cogdill AP, Chen T, Fraietta JA, Kloss CC, Posey AD, Engels B, Singh R, Ezell T, Idamakanti N, Ramones MH, Li N, Zhou L, Plesa G, Seykora JT, Okada H, June CH, Brogdon JL, Maus MV. Rational development and characterization of humanized anti–EGFR variant III chimeric antigen receptor T cells for glioblastoma. Sci Transl Med. 2015;7:275ra222. doi: 10.1126/scitranslmed.aaa4963. [DOI] [PMC free article] [PubMed] [Google Scholar]
- 5.Klebanoff CA, Finkelstein SE, Surman DR, Lichtman MK, Gattinoni L, Theoret MR, Grewal N, Spiess PJ, Antony PA, Palmer DC, Tagaya Y, Rosenberg SA, Waldmann TA, Restifo NP. IL-15 enhances the in vivo antitumor activity of tumor-reactive CD8+ T Cells. Proc Natl Acad Sci. 2004;101:1969–1974. doi: 10.1073/pnas.0307298101. [DOI] [PMC free article] [PubMed] [Google Scholar]
- 6.Wallace A, Kapoor V, Sun J, Mrass P, Weninger W, Heitjan DF, June C, Kaiser LR, Ling LE, Albelda SM. Transforming growth factor-beta receptor blockade augments the effectiveness of adoptive T cell therapy of established solid cancers. Clin Cancer Res. 2008;14:3966–3974. doi: 10.1158/1078-0432.CCR-08-0356. [DOI] [PMC free article] [PubMed] [Google Scholar]
- 7.Conlon KC, Lugli E, Welles HC, Rosenberg SA, Fojo AT, Morris JC, Fleisher TA, Dubois SP, Perera LP, Stewart DM, Goldman CK, Bryant BR, Decker JM, Chen J, Worthy TYA, Figg WD, Peer CJ, Sneller MC, Lane HC, Yovandich JL, Creekmore SP, Roederer M, Waldmann TA. Redistribution, Hyperproliferation, Activation of Natural Killer Cells and CD8 T Cells, and Cytokine Production During First-in-Human Clinical Trial of Recombinant Human Interleukin-15 in Patients With Cancer. J Clin Oncol. 2015;33:74–82. doi: 10.1200/JCO.2014.57.3329. [DOI] [PMC free article] [PubMed] [Google Scholar]
- 8.Leonard JP, Sherman ML, Fisher GL, Buchanan LJ, Larsen G, Atkins MB, Sosman JA, Dutcher JP, Vogelzang NJ, Ryan JL. Effects of single-dose interleukin-12 exposure on interleukin-12-associated toxicity and interferon-gamma production. Blood. 1997;90:2541–2548. [PubMed] [Google Scholar]
- 9.Zhang L, Morgan RA, Beane JD, Zheng Z, Dudley ME, Kassim SH, Nahvi AV, Ngo LT, Sherry RM, Phan GQ, Hughes MS, Kammula US, Feldman SA, Toomey MA, Kerkar SP, Restifo NP, Yang JC, Rosenberg SA. Tumor-infiltrating lymphocytes genetically engineered with an inducible gene encoding interleukin-12 for the immunotherapy of metastatic melanoma. Clin Cancer Res. 2015;21:2278–2288. doi: 10.1158/1078-0432.CCR-14-2085. [DOI] [PMC free article] [PubMed] [Google Scholar]
- 10.Huang BN, Abraham WD, Zheng YR, Lopez SCB, Luo SS, Irvine DJ. Active targeting of chemotherapy to disseminated tumors using nanoparticle-carrying T cells. Sci Transl Med. 2015;7:291ra294. doi: 10.1126/scitranslmed.aaa5447. [DOI] [PMC free article] [PubMed] [Google Scholar]
- 11.Stephan MT, Moon JJ, Um SH, Bershteyn A, Irvine DJ. Therapeutic cell engineering with surface-conjugated synthetic nanoparticles. Nat Med. 2010;16:1035–1041. doi: 10.1038/nm.2198. [DOI] [PMC free article] [PubMed] [Google Scholar]
- 12.Stephan MT, Stephan SB, Bak P, Chen JZ, Irvine DJ. Synapse-directed delivery of immunomodulators using T cell-conjugated nanoparticles. Biomaterials. 2012;33:5776–5787. doi: 10.1016/j.biomaterials.2012.04.029. [DOI] [PMC free article] [PubMed] [Google Scholar]
- 13.Ghezzi P, Bonetto V, Fratelli M. Thiol–Disulfide Balance: From the Concept of Oxidative Stress to that of Redox Regulation. Antioxid Redox Signaling. 2005;7:964–972. doi: 10.1089/ars.2005.7.964. [DOI] [PubMed] [Google Scholar]
- 14.Lawrence DA, Song R, Weber P. Surface thiols of human lymphocytes and their changes after in vitro and in vivo activation. J Leukoc Biol. 1996;60:611–618. doi: 10.1002/jlb.60.5.611. [DOI] [PubMed] [Google Scholar]
- 15.Berridge MV, Tan AS. Trans-plasma membrane electron transport: A cellular assay for NADH- and NADPH-oxidase based on extracellular, superoxide-mediated reduction of the sulfonated tetrazolium salt WST-1. Protoplasma. 1998;205:74–82. [Google Scholar]
- 16.Berridge MV, Tan AS. Cell-Surface NAD(P)H-Oxidase: Relationship to Trans-Plasma Membrane NADH-Oxidoreductase and a Potential Source of Circulating NADH-Oxidase. Antioxid Redox Signaling. 2000;2:277–288. doi: 10.1089/ars.2000.2.2-277. [DOI] [PubMed] [Google Scholar]
- 17.Riber CF, Smith AA, Zelikin AN. Self-Immolative Linkers Literally Bridge Disulfide Chemistry and the Realm of Thiol-Free Drugs. Adv Healthc Mater. 2015;4:1887–1890. doi: 10.1002/adhm.201500344. [DOI] [PubMed] [Google Scholar]
- 18.Jones LR, Goun EA, Shinde R, Rothbard JB, Contag CH, Wender PA. Releasable luciferin-transporter conjugates: Tools for the real-time analysis of cellular uptake and release. J Am Chem Soc. 2006;128:6526–6527. doi: 10.1021/ja0586283. [DOI] [PubMed] [Google Scholar]
- 19.Xu J, Wang J, Luft JC, Tian S, Owens G, Pandya AA, Berglund P, Pohlhaus P, Maynor BW, Smith J, Hubby B, Napier ME, DeSimone JM. Rendering Protein-Based Particles Transiently Insoluble for Therapeutic Applications. J Am Chem Soc. 2012;134:8774–8777. doi: 10.1021/ja302363r. [DOI] [PMC free article] [PubMed] [Google Scholar]
- 20.Zhu XY, Marcus WD, Xu WX, Lee HI, Han KP, Egan JO, Yovandich JL, Rhode PR, Wong HC. Novel Human Interleukin-15 Agonists. J Immunol. 2009;183:3598–3607. doi: 10.4049/jimmunol.0901244. [DOI] [PMC free article] [PubMed] [Google Scholar]
- 21.Rhode PR, Egan JO, Xu W, Hong H, Webb GM, Chen X, Liu B, Zhu X, Wen J, You L, Kong L, Edwards AC, Han K, Shi S, Alter S, Sacha JB, Jeng EK, Cai W, Wong HC. Comparison of the Superagonist Complex, ALT-803, to IL15 as Cancer Immunotherapeutics in Animal Models. Cancer Immunol Res. 2016;4:49–60. doi: 10.1158/2326-6066.CIR-15-0093-T. [DOI] [PMC free article] [PubMed] [Google Scholar]
- 22.Yu A, Olosz F, Choi CY, Malek TR. Efficient internalization of IL-2 depends on the distal portion of the cytoplasmic tail of the IL-2R common gamma-chain and a lymphoid cell environment. J Immunol. 2000;165:2556–2562. doi: 10.4049/jimmunol.165.5.2556. [DOI] [PubMed] [Google Scholar]
- 23.Overwijk WW, Theoret MR, Finkelstein SE, Surman DR, de Jong LA, Vyth-Dreese FA, Dellemijn TA, Antony PA, Spiess PJ, Palmer DC, Heimann DM, Klebanoff CA, Yu ZY, Hwang LN, Feigenbaum L, Kruisbeek AM, Rosenberg SA, Restifo NP. Tumor regression and autoimmunity after reversal of a functionally tolerant state of self-reactive CD8+ T cells. J Exp Med. 2003;198:569–580. doi: 10.1084/jem.20030590. [DOI] [PMC free article] [PubMed] [Google Scholar]
- 24.Maude SL, Frey N, Shaw PA, Aplenc R, Barrett DM, Bunin NJ, Chew A, Gonzalez VE, Zheng Z, Lacey SF, Mahnke YD, Melenhorst JJ, Rheingold SR, Shen A, Teachey DT, Levine BL, June CH, Porter DL, Grupp SA. Chimeric Antigen Receptor T Cells for Sustained Remissions in Leukemia. N Engl J Med. 2014;371:1507–1517. doi: 10.1056/NEJMoa1407222. [DOI] [PMC free article] [PubMed] [Google Scholar]
- 25.Maus MV, Fraietta JA, Levine BL, Kalos M, Zhao Y, June CH. Adoptive Immunotherapy for Cancer or Viruses. Annu Rev Immunol. 2014;32:189–225. doi: 10.1146/annurev-immunol-032713-120136. [DOI] [PMC free article] [PubMed] [Google Scholar]
- 26.Guo Y, Luan L, Rabacal W, Bohannon JK, Fensterheim BA, Hernandez A, Sherwood ER. IL-15 Superagonist-Mediated Immunotoxicity: Role of NK Cells and IFN-gamma. J Immunol. 2015;195:2353–2364. doi: 10.4049/jimmunol.1500300. [DOI] [PMC free article] [PubMed] [Google Scholar]
- 27.Patel SK, Zhang Y, Pollock JA, Janjic JM. Cyclooxgenase-2 inhibiting perfluoropoly (ethylene glycol) ether theranostic nanoemulsions-in vitro study. PLoS One. 2013;8:e55802. doi: 10.1371/journal.pone.0055802. [DOI] [PMC free article] [PubMed] [Google Scholar]
- 28.Pradhan D, Morrow J. The spectrin-ankyrin skeleton controls CD45 surface display and interleukin-2 production. Immunity. 2002;17:303–315. doi: 10.1016/s1074-7613(02)00396-5. [DOI] [PubMed] [Google Scholar]
- 29.Chang VT, Fernandes RA, Ganzinger KA, Lee SF, Siebold C, McColl J, Jonsson P, Palayret M, Harlos K, Coles CH, Jones EY, Lui Y, Huang E, Gilbert RJC, Klenerman D, Aricescu AR, Davis SJ. Initiation of T cell signaling by CD45 segregation at 'close contacts'. Nat Immunol. 2016;17:574–582. doi: 10.1038/ni.3392. [DOI] [PMC free article] [PubMed] [Google Scholar]
- 30.Johnson KG, Bromley SK, Dustin ML, Thomas ML. A supramolecular basis for CD45 tyrosine phosphatase regulation in sustained T cell activation. Proc Natl Acad Sci. 2000;97:10138–10143. doi: 10.1073/pnas.97.18.10138. [DOI] [PMC free article] [PubMed] [Google Scholar]
- 31.Wang L, Hess A, Chang TZ, Wang YC, Champion JA, Compans RW, Wang BZ. Nanoclusters self-assembled from conformation-stabilized influenza M2e as broadly cross-protective influenza vaccines. Nanomedicine-Nanotechnology Biology and Medicine. 2014;10:473–482. doi: 10.1016/j.nano.2013.08.005. [DOI] [PMC free article] [PubMed] [Google Scholar]
- 32.Scott EA, Nichols MD, Cordova LH, George BJ, Jun YS, Elbert DL. Protein adsorption and cell adhesion on nanoscale bioactive coatings formed from poly(ethylene glycol) and albumin microgels. Biomaterials. 2008;29:4481–4493. doi: 10.1016/j.biomaterials.2008.08.003. [DOI] [PMC free article] [PubMed] [Google Scholar]
- 33.Tan H, Jin H, Mei H, Zhu L, Wei W, Wang Q, Liang F, Zhang C, Li J, Qu X, Shangguan D, Huang Y, Yang Z. PEG-urokinase nanogels with enhanced stability and controllable bioactivity. Soft Matter. 2012;8:2644–2650. [Google Scholar]
- 34.Lin X, Zheng W, Liu J, Zhang Y, Qin H, Wu H, Xue B, Lu Y, Shen P. Oxidative stress in malignant melanoma enhances tumor necrosis factor-alpha secretion of tumor-associated macrophages that promote cancer cell invasion. Antioxid Redox Signal. 2013;19:1337–1355. doi: 10.1089/ars.2012.4617. [DOI] [PubMed] [Google Scholar]
- 35.Koshy ST, Ferrante TC, Lewin SA, Mooney DJ. Injectable, porous, and cell-responsive gelatin cryogels. Biomaterials. 2014;35:2477–2487. doi: 10.1016/j.biomaterials.2013.11.044. [DOI] [PMC free article] [PubMed] [Google Scholar]
- 36.Singh N, Karambelkar A, Gu L, Lin K, Miller JS, Chen CS, Sailor MJ, Bhatia SN. Bioresponsive Mesoporous Silica Nanoparticles for Triggered Drug Release. J Am Chem Soc. 2011 doi: 10.1021/ja206998x. [DOI] [PMC free article] [PubMed] [Google Scholar]
- 37.Au KM, Satterlee A, Min YZ, Tian X, Kim YS, Caster JM, Zhang LZ, Zhang T, Huang L, Wang AZ. Folate-targeted pH-responsive calcium zoledronate nanoscale metal-organic frameworks: Turning a bone antiresorptive agent into an anticancer therapeutic. Biomaterials. 2016;82:178–193. doi: 10.1016/j.biomaterials.2015.12.018. [DOI] [PMC free article] [PubMed] [Google Scholar]
- 38.Ling D, Xia H, Park W, Hackett MJ, Song C, Na K, Hui KM, Hyeon T. pH-Sensitive Nanoformulated Triptolide as a Targeted Therapeutic Strategy for Hepatocellular Carcinoma. ACS Nano. 2014;8:8027–8039. doi: 10.1021/nn502074x. [DOI] [PubMed] [Google Scholar]
- 39.Yang Y, Xie X, Li Z, Yu F, Gong W, Li Y, Zhang H, Wang Z, Mei X. Polymer Nanoparticles Modified with Photo- and pH-Dual-Responsive Polypeptides for Enhanced and Targeted Cancer Therapy. Mol Pharm. 2016;13:1508–1519. doi: 10.1021/acs.molpharmaceut.5b00977. [DOI] [PubMed] [Google Scholar]
- 40.Chmielewski M, Kopecky C, Hombach AA, Abken H. IL-12 Release by Engineered T Cells Expressing Chimeric Antigen Receptors Can Effectively Muster an Antigen-Independent Macrophage Response on Tumor Cells That Have Shut Down Tumor Antigen Expression. Cancer Res. 2011;71:5697–5706. doi: 10.1158/0008-5472.CAN-11-0103. [DOI] [PubMed] [Google Scholar]
- 41.Chinnasamy D, Yu ZY, Kerkar SP, Zhang L, Morgan RA, Restifo NP, Rosenberg SA. Local Delivery of Interleukin-12 Using T Cells Targeting VEGF Receptor-2 Eradicates Multiple Vascularized Tumors in Mice. Clin Cancer Res. 2012;18:1672–1683. doi: 10.1158/1078-0432.CCR-11-3050. [DOI] [PMC free article] [PubMed] [Google Scholar]
- 42.Pegram HJ, Lee JC, Hayman EG, Imperato GH, Tedder TF, Sadelain M, Brentjens RJ. Tumor-targeted T cells modified to secrete IL-12 eradicate systemic tumors without need for prior conditioning. Blood. 2012;119:4133–4141. doi: 10.1182/blood-2011-12-400044. [DOI] [PMC free article] [PubMed] [Google Scholar]
- 43.Weinstein-Marom H, Pato A, Levin N, Susid K, Itzhaki O, Besser MJ, Peretz T, Margalit A, Lotem M, Gross G. Membrane-attached Cytokines Expressed by mRNA Electroporation Act as Potent T cell Adjuvants. J Immunother. 2016;39:60–70. doi: 10.1097/CJI.0000000000000109. [DOI] [PubMed] [Google Scholar]
- 44.Desnoyers LR, Vasiljeva O, Richardson JH, Yang A, Menendez EE, Liang TW, Wong C, Bessette PH, Kamath K, Moore SJ, Sagert JG, Hostetter DR, Han F, Gee J, Flandez J, Markham K, Nguyen M, Krimm M, Wong KR, Liu S, Daugherty PS, West JW, Lowman HB. Tumor-specific activation of an EGFR-targeting probody enhances therapeutic index. Sci Transl Med. 2013;5:207ra144. doi: 10.1126/scitranslmed.3006682. [DOI] [PubMed] [Google Scholar]
- 45.Wu CY, Roybal KT, Puchner EM, Onuffer J, Lim WA. Remote control of therapeutic T cells through a small molecule–gated chimeric receptor. Science. 2015;350 doi: 10.1126/science.aab4077. [DOI] [PMC free article] [PubMed] [Google Scholar]
- 46.Fedorov VD, Themeli M, Sadelain M. PD-1- and CTLA-4-based inhibitory chimeric antigen receptors (iCARs) divert off-target immunotherapy responses. Sci Transl Med. 2013;5:215ra172. doi: 10.1126/scitranslmed.3006597. [DOI] [PMC free article] [PubMed] [Google Scholar]
- 47.Kloss CC, Condomines M, Cartellieri M, Bachmann M, Sadelain M. Combinatorial antigen recognition with balanced signaling promotes selective tumor eradication by engineered T cells. Nat Biotechnol. 2013;31:71–75. doi: 10.1038/nbt.2459. [DOI] [PMC free article] [PubMed] [Google Scholar]
- 48.Morgan RA, Yang JC, Kitano M, Dudley ME, Laurencot CM, Rosenberg SA. Case Report of a Serious Adverse Event Following the Administration of T Cells Transduced With a Chimeric Antigen Receptor Recognizing ERBB2. Mol Ther. 2010;18:843–851. doi: 10.1038/mt.2010.24. [DOI] [PMC free article] [PubMed] [Google Scholar]
- 49.Han KP, Zhu XY, Liu B, Jeng E, Kong L, Yovandich JL, Vyas VV, Marcus WD, Chavaillaz PA, Romero CA, Rhode PR, Wong HC. IL-15:IL-15 receptor alpha superagonist complex: High-level co-expression in recombinant mammalian cells, purification and characterization. Cytokine. 2011;56:804–810. doi: 10.1016/j.cyto.2011.09.028. [DOI] [PMC free article] [PubMed] [Google Scholar]
- 50.Zheng Y, Stephan MT, Gai SA, Abraham W, Shearer A, Irvine DJ. In vivo targeting of adoptively transferred T cells with antibody- and cytokine-conjugated liposomes. J Controlled Release. 2013;172:426–435. doi: 10.1016/j.jconrel.2013.05.037. [DOI] [PMC free article] [PubMed] [Google Scholar]
Associated Data
This section collects any data citations, data availability statements, or supplementary materials included in this article.
Supplementary Materials
Data Availability Statement
The authors declare that the data that support the findings of this study are available from the corresponding author upon request.