

Abstract
Objective: The isobaric tags for relative and absolute quantification (iTRAQ) technique for proteomic analysis was employed to identify diagnostic markers and therapeutic targets of Shenkangling intervention or prednisone tablets in rats with adriamycin nephropathy (AN). Methods: Fifty healthy, clean-grade Sprague-Dawley rats were selected, with 10 rats in the normal group and the remaining 40 rats receiving a tail vein injection of 5.5 mg/kg of adriamycin (ADR) to induce AN. Treatment began 1 week later. The normal group received gastric administration of normal saline. Forty rats with induced AN were further randomly divided into the AN modeling group (n = 10), AN modeling + prednisone treatment group (n = 10), AN modeling + Shenkangling intervention group (n = 10), and AN modeling + prednisone + Shenkangling intervention group (n = 10). iTRAQ was employed in combination with mass spectrometry to analyze the differentially expressed proteins in the urine after 3 weeks of treatment (in the fourth week of the experiment). Results: Compared with normal rats, AN rats had 6 down-regulated proteins and 1 upregulated protein. Compared with AN rats, prednisone rats had 2 down-regulated and 6 upregulated proteins. Compared with AN rats, combined treatment rats had 2 down-regulated and 8 upregulated proteins. Compared with the AN model group, the Shenkangling treatment group had 3 down-regulated and 9 upregulated proteins. Gro, Afamin, Cystatin-related protein 2, Afamin, and isoform CRA_a were considered diagnostic markers of primary nephrotic syndrome (PNS). Telomerase was considered the therapeutic target of prednisone. Urinary protein 2, Apolipoprotein A-II, 45 kDa calcium-binding protein, Vitronectin, and Osteopontin were the therapeutic targets of the Shenkangling intervention. Afamin, isoform CRA_a, Apolipoprotein A-IV, Coagulation factor XII, Prolactin-induced protein, and Coagulation factor XII were the therapeutic targets of the Shenkangling intervention combined with prednisone. Conclusion: The feasibility of urinary proteomics analysis in rats using a large number of proteins with finite molecular weights is controversial. The markers screened in this study may be of clinical value for the diagnosis and treatment of nephropathy. However, these findings should be confirmed in future cohort studies.
Keywords: iTRAQ, Shenkangling intervention, prednisone, proteomics, adriamycin nephropathy
Introduction
Primary nephrotic syndrome (PNS) is caused by heavy proteinuria, which leads to hypoproteinemia, edema, and hyperlipidemia. The incidence of PNS, a common kidney disease in children [1], varies across regions. In the United States, the incidence is one case per million. The incidence in Asia is higher than that in North America or Europe [2]. In China, 85% of children with nephropathy present with minimal change nephrotic syndrome (MCNS), and 80-90% of such pediatric cases relapse. With MCNS, 25-43% of the children have frequently relapsing nephrotic syndrome (FRNS) due to infection or being in a hypercoagulable state [3], which makes treatment of FRNS very difficult.
Tail vein injection of adriamycin (ADR) is a successful method of inducing adriamycin nephropathy (AN) [4]. The pathogenesis of PNS and the proteomic changes induced by Shenkangling intervention remain unknown. Proteomic analyses are generally used in comparative or descriptive studies, focusing on the difference in quantitative or qualitative samples and identification of differentially expressed proteins [5]. Different types of samples can be used in proteomic studies for clinical nephrology [6].
At present, 2D-electrophoresis (2-DE) is applied to cell or tissue isolation in proteomic studies. Matrix-assisted laser desorption ionization time-of-flight mass spectrometry (MALDI-TOF-MS) is used for relative and absolute quantification of postmodification peptides and proteins and is considered necessary for clinical applications [7,8]. Proteomic analysis has been used for detecting diabetic nephropathy [9], glomerular disease [10,11], urinary samples [12,13] and exosomes in urine [14,15]. Plasma is usually used for protein research in disease states because blood samples are easy to acquire and can be collected repeatedly. Plasma proteomics holds immense potential to identify new markers [16]. The benefits of SELDI-TOF-MS include purification and isolation of small-molecular-weight proteins at high efficiency, stability, specificity and sensitivity [17,18]. Moreover, SELDI-TOF-MS is suitable for the semiquantification of small-molecular-weight peptides and proteins, which could be potential diagnostic and prognostic markers that could facilitate the understanding of the pathogenesis of many diseases [19-21]. The iTRAQ technique has presented many advantages since its invention and has been used extensively for the comparison of features of soluble proteins [22,23], especially subproteins in large quantities [24]. However, whether this technique is appropriate for precise quantitative analyses of membrane proteins is not fully known.
According to traditional Chinese medicine, deficiency of kidney and blood stasis syndrome is an important pathologic factor contributing to the development of PNS. The Chinese herbal decoction, Shenkangling, has proven effective in treating PNS.
We combined iTRAQ with tandem mass spectrometry to produce relative and absolute quantifications of urine samples. This method is ideal for identifying new biomarkers. Based on the diagnostic biomarkers of PNS that were screened, we proceeded to analyze the pathogenesis of PNS from a proteomics perspective. The therapeutic targets of Shenkangling intervention were also identified.
Materials and methods
Materials
A Q-exactive Mass spectrometer was purchased from Thermo Finnigan (USA). An iTRAQ Reagent-8plex Multiplex Kit was purchased from AB SCIEX (USA). Doxorubicin Hydrochloride for Injection was manufactured by Pharmacia & Upjohn (Italy). Prednisone was manufactured by Zhejiang Xianju Pharmaceutical Co., Ltd. Healthy clean-grade SD male rats weighing between 210-350 g and aged approximately 3 months were supplied by Shanghai SLAC Laboratory Animal Co., Ltd. (laboratory animal license: SCXK (Shanghai) 2007-0005).
Modeling and treatments
Forty rats in the modeling group received tail vein injections of adriamycin (ADR) at a dose of 5.5 mg/kg on day 1. Rats in the normal group received tail vein injections of normal saline at an equal dose. One week after modeling, rats in the modeling group were randomly divided into (1) an AN model group (n = 10), (2) a prednisone group (n = 10, receiving a gastric administration of 3 ml prednisone suspended in distilled water at a daily dose of 5.5 mg/kg in the morning and a gastric administration of 3 ml distilled water in the afternoon), (3) a Shenkangling plus prednisone treatment group (n = 10, receiving a gastric administration of 3 ml prednisone suspension in the morning and a gastric administration of Shenkangling decoction at a dose of 1 mL/100 g in the afternoon), and (4) a Shenkangling decoction group (n = 10, receiving a gastric administration of Shenkangling decoction in the morning and a gastric administration of 3 ml distilled water in the afternoon). For the normal group and the AN modeling group, 3 ml distilled water was administered intragastrically. The remaining groups received continuous gastric administration for 3 weeks.
Biochemistry and urine protein detection
Blood was sampled from the abdominal aorta and centrifuged. Serum albumin (ALB) and cholesterol (CHOL) were detected using an automatic biochemical analyzer. Urine proteins were detected using the pyrogallol colorimetric method. Urine proteins were quantified once per week throughout the three-week treatment. At the end of the treatment period, each rat was weighed and tested for ALB, CHOL and urine proteins.
Protein purification and iTRAQ labeling
For each rat, a 15-ml urine sample was collected and centrifuged at 5000 g at 4°C for 5 min. The precipitate was discarded and the supernatant was collected, added to precooled acetone (-20°C) at a 1:9 proportion (supernatant: acetone), and mixed well. The sample was placed in a -20°C freezer for 1 h. The sample was then centrifuged at 12,000 g and 4°C for 30 min. The supernatant was discarded, and the sample was air dried. We added 500 µl of SDT lysis buffer to each sample, mixed the samples via vortex, and placed them in a boiling water bath for 10 min. The sample was ultrasonically disrupted (15 repetitions of 150 w, for 10 s, with an interval of 15 s). After treatment in a boiling water bath for 5 min, the sample was centrifuged again, and the supernatant was collected. Proteins were quantified using the BCA method. For each group, two 50 µL urine samples were collected and combined into two internal standards. Then, 300 μg each of the sample and the internal standard were taken and added to DTT at a final concentration of 100 mM. The samples were placed in a boiling water bath for 5 min then cooled to room temperature. A 200 μL UA buffer (8 M Urea, 150 mM TrisHCl pH 8.0) was then added and the samples were mixed well. Centrifugation was performed using a 10 kd ultrafiltration tube at 14,000 g for 14 min. 200 μl UA buffer was further added to the sample and centrifuged at 14,000 g for 15 min. The filtrate was discarded after centrifugation. Then, 100 μL IAA (50 mM IAA in UA) was added and the tube was oscillated at 600 rpm for 1 min. The tube was left to stand in the dark at room temperature for 30 min. The tube was then centrifuged at 14,000 g for 10 min. The sample was added to 100 µL UA buffer and centrifuged at 14,000 g for 10 min. This step was performed twice. The sample was further added to 100 μL dissolution buffer and centrifuged at 14,000 g for 10 min. This step was also performed twice. Next, 40 μl of trypsin buffer (5 μg trypsin in 40 μL dissolution buffer) were added and the tube was oscillated at 600 rpm for 1 min. The tube was left to stand at 37°C for 16-18 h. The tube was replaced and centrifugation was performed at 14000 g for 10 min. The filtrate was collected and protein concentrations was measured at OD280. All labeled peptides were mixed and passed through an SCX column. The thirty eluted fractions were collected and combined into 6 fractions according to the SCX chromatogram for each sample. The samples were freeze dried and desalinized in a C18 Cartridge (Sigma).
Mass spectrometry
Each sample was separated using an Easy-nLC 1000 UHPLC system. After analysis with capillary high performance liquid chromatography, mass spectrometry was performed using a Q-Exactive mass spectrometer (Thermo Finnigan).
Statistical analysis
Original mass spectrometry data were in RAW files. The proteins were identified using Maxquant 1.4.1.2 (standard parameter configuration with Maxquant). The 95% confidence interval was calculated. T-tests were performed for each time point and baseline data. Ratios > 2.0 or < 0.5 between the groups and P < 0.05 indicated differentially expressed proteins.
Bioinformatic analysis of proteomics data
Gene ontology (GO) function enrichment analyses were performed on the iTRAQ data (http://www.geneontology.org/). There were three branches, namely, cellular component, molecular function and biological process. GO slims is a compact version of GO ontologies that consists of subset of GO terms (http://www.geneontology.org/GO.slims.shtml). The differentially expressed proteins were searched against the UniProtKB database (Release 2014_8, UniProtKB/Swiss-Prot and UniProtKB/TrEMBL) using Local Blast (version: 2.2.23+). The E-value = 1e-10 and identity were set to above 30%. GO annotations for aligned hits were used as the annotations of the differentially expressed proteins. An in-house Perl script was used to determine the number of proteins in the different branches.
Results
Establishment of AN models
Tail vein injection of ADR (5.5 mg/kG) was performed to establish AN models. After 1 week, urine protein was quantified as 100.08 mg (± 15.58 mg) in AN rats, which was significantly higher than that in normal rats (5.15 ± 1.29 mg/24 h, P < 0.01). This finding indicates that the model was established successfully.
Urine protein quantification
Urine proteins were quantified at weeks 1, 2 and 3 after model construction (Figure 1). Urine protein concentrations fell within the normal range in the normal group, with no significant changes over time. Compared with the normal group, the AN model group showed continuous increases in urine protein concentrations, and the increase was significant throughout the study. However, urine protein concentration decreased in the Shenkangling intervention group and the prednisone treatment group. The urine protein concentration was significantly lower at weeks 2 and 3 after treatment than after establishment of the AN model, but it was higher in the treated group than in the normal group.
Figure 1.

Urine protein concentrations (mg/day, mean ± SD) in the normal group, AN model group, Shenkangling intervention group, prednisone treatment group, and combined treatment group at weeks 1, 2 and 3 after modeling.
Changes of biochemical indicators at the end of the experiment
Biochemical indicators (Figure 2) were measured at the fourth week of the experiment. ALB was 15.87 ± 1.80 g/L in the AN model group, which was significantly lower than that of the normal group (38.50 ± 2.08 g/L, P < 0.05), indicating that the AN model was created successfully. Compared with the normal group, the AN model group showed a significant decrease in ALB. CHOL increased in the AN model group, but it was still lower than that in the normal group.
Figure 2.

ALB and CHOL levels at the fourth week of modeling. Blue indicates the normal group, red the AN model group, green the Shenkangling intervention group, purple the prednisone treatment group, and light blue indicates the combined treatment group.
Analysis of the physical and chemical properties of proteins
Physical and chemical properties of proteins were characterized by isoelectric point (pI), molecular weight (MW) and residue number, which were analyzed by EMBOSS Pepstats (Figure 3). GRAVY (grand average hydrophobicity) was calculated from the hydrophobicity index of each amino acid.
Figure 3.

A: PI distribution. B: MW distribution. C: Residue number distribution. D: GRAVY value distribution.
Gene ontology
The proteins were classified into three major categories: “biological processes”, “molecular functions” and “cellular components”. The functions of the proteins may be relevant or irrelevant to these categories. Some proteins were mapped to multiple GO terms. For example, 51 proteins were mapped to multiple biological process GO terms, and there were 257 unique biological process GO terms (see Figure S1). Forty-nine proteins were mapped to multiple molecular function GO terms, and there were unique molecular function GO terms (see Figure S2). Fifty-four proteins were mapped to multiple cellular component GO terms, and there were 69 unique cellular component GO terms (see Figure S3). Preliminarily, 90 protein biomarkers were identified. Different proteins had different functions (Figure 4).
Figure 4.
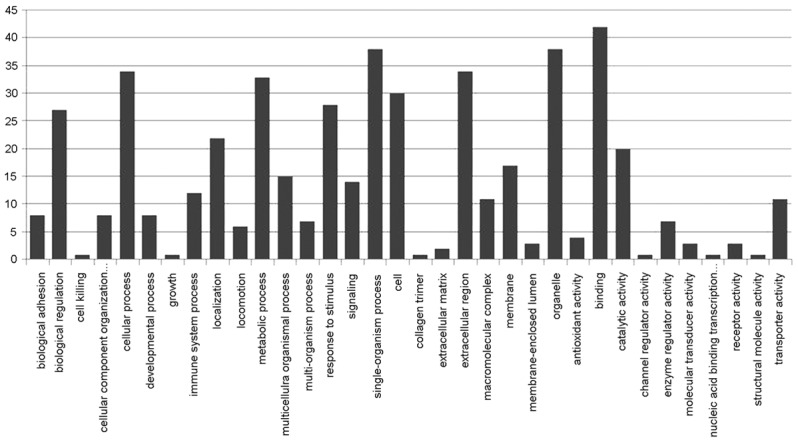
GO term distribution; from left to right, the X axis reflects biological process, cellular component, and molecular function. The Y axis represents the number of functional proteins. Note: (1) GO: Gene Ontology; BP: Biological Process; MF: Molecular Function; CC: Cellular Component; (2) Go slim was used by UniProtKB-GOA goslim (N. Mulder, M. Pruess PMID:12230037 Nov 2002).
KEGG pathway analysis
Differentially expressed proteins were searched against the KEGG protein database using Local Blast (version: 2.2.23+). Alignment hits with 30% identity were mapped to their KO numbers. A Perl script was developed based on the KEGG API used for mapping the proteins to the KEGG pathway. Significance analyses were performed for the pathway based on hyper-geometric distributions, using all KO numbers in the KEGG pathway. There were 12 proteins mapped to the 24 KEGG Pathway map using KEGG IDs (Figure 5).
Figure 5.

Significant enrichment of identified proteins to the corresponding pathways; curves were plotted using the negative logarithm with 10 as the base for the pathways and higher-level pathways.
Different proteomes identified in different groups
Urinary proteomics analyses yielded the following results. Fifty-one proteins satisfied the following criteria: P value < 0.05, EF < 2, at least two unique peptides > 95% confidence level, and a protein expression ratio > 2.0 or < 0.5. Compared with the normal group, the AN model group had 7 differentially expressed proteins, including 6 down-regulated and 1 upregulated proteins (Table 1). Compared with the AN model group, the prednisone group had 8 differentially expressed proteins, including 2 down-regulated and 6 upregulated proteins (Table 2). Compared with the AN model group, the combined treatment group had 10 differentially expressed proteins, including 2 down-regulated and 8 upregulated proteins (Table 3). Compared with the AN model group, the Shenkangling intervention group had 12 differentially expressed proteins (3 down-regulated and 9 upregulated) (Table 4). Protein identification was based on the Swiss-Prot database (http://www.expasy.org/tools/tagident.html).
Table 1.
A. Normal group; B. Modeling group. Seven differentially expressed proteins were considered as the diagnostic markers for PNS
| No. | Protein accession number | Protein name | Mol. weight (kDa) | A | B | B/A ratio | P-Value |
|---|---|---|---|---|---|---|---|
| 1 | gi|220755 | Gro | 10.249 | 3.706 | 0.619 | 0.167 | 0.044 |
| 2 | gi|72679563 | Cystatin related protein 2 | 21.013 | 4.225 | 0.531 | 0.126 | 0.014 |
| 3 | gi|9506847 | Probasin precursor | 20.780 | 4.229 | 0.570 | 0.135 | 0.019 |
| 4 | gi|195927361 | D Chain D, Structure Of E.Coli Gapdh Rat Sperm Gapdh Heterotetramer | 36.077 | 3.998 | 0.279 | 0.070 | 0.001 |
| 5 | gi|7160087 | Prostatic steroid binding protein | 10.730 | 3.558 | 0.4 | 0.112 | 0.009 |
| 6 | gi|157820173 | L-2-hydroxyglutarate dehydrogenase, mitochondrial | 50.732 | 3.359 | 0.483 | 0.144 | 0.025 |
| 7 | gi|149033757 | Afamin, isoform CRA_a | 68.295 | 0.902 | 4.237 | 4.697 | 0.020 |
Table 2.
B. Model group; C. Prednisone treatment group. Eight differentially expressed proteins were considered as therapeutic targets of prednisone
| No. | Protein accession number | Protein name | Mol. weight [kDa] | B | C | C/B ratio | P-Value |
|---|---|---|---|---|---|---|---|
| 1 | gi|149033757 | Afamin, isoform CRA_a | 68.295 | 4.237 | 0.708 | 0.167 | 0.002 |
| 2 | gi|149065418 | Prolactin induced protein, isoform CRA_d | 16.44 | 0.969 | 0.284 | 0.293 | 0.049 |
| 3 | gi|60552712 | Apolipoprotein A-IV | 44.456 | 0.499 | 1.314 | 2.633 | 0.025 |
| 4 | gi|63259209 | Telomerase catalytic subunit isoform c | 6.622 | 0.630 | 6.912 | 10.971 | 0.000 |
| 5 | gi|6978527 | Aquaporin-1 | 28.856 | 0.462 | 1.608 | 3.481 | 0.006 |
| 6 | gi|56541525 | Carboxylesterase 2 | 62.189 | 0.642 | 1.517 | 2.363 | 0.042 |
| 7 | gi|204655 | Haptoglobin (Hp) | 38.555 | 0.442 | 1.375 | 3.111 | 0.011 |
| 8 | gi|298351665 | Coagulation factor XII | 65.843 | 0.458 | 1.056 | 2.306 | 0.047 |
Table 3.
B. Model group; D. Combined treatment group. Ten differentially expressed proteins were considered as therapeutic targets of both prednisone and Shenkangling intervention
| No. | Protein accession number | Protein name | Mol. weight [kDa] | B | D | D/B ratio | P-Value |
|---|---|---|---|---|---|---|---|
| 1 | gi|149033757 | Afamin, isoform CRA_a | 68.295 | 4.237 | 1.237 | 0.292 | 0.000 |
| 2 | gi|6226289 | Urinary protein 2 | 11.068 | 4.391 | 0.774 | 0.176 | 0.000 |
| 3 | gi|202948 | Apolipoprotein A-II, partial | 10.255 | 0.308 | 1.364 | 4.429 | 0.018 |
| 4 | gi|60552712 | Apolipoprotein A-IV | 44.456 | 0.499 | 1.822 | 3.651 | 0.042 |
| 5 | gi|59808174 | Inter alpha-trypsin inhibitor, heavy chain 4 | 103.750 | 0.478 | 1.729 | 3.617 | 0.044 |
| 6 | gi|21263446 | 45 kDa calcium-binding protein | 42.075 | 0.270 | 2.490 | 9.222 | 0.000 |
| 7 | gi|63259209 | Telomerase catalytic subunit isoform c | 6.622 | 0.630 | 3.812 | 6.051 | 0.004 |
| 8 | gi|76780264 | Vitronectin | 54.724 | 0.459 | 1.712 | 3.730 | 0.039 |
| 9 | gi|1871124 | Osteopontin | 34.963 | 0.406 | 1.855 | 4.569 | 0.016 |
| 10 | gi|298351665 | Coagulation factor XII | 65.843 | 0.458 | 1.689 | 3.688 | 0.041 |
Table 4.
B. Model group; E. Shenkangling intervention group. Twelve differentially expressed proteins were considered as therapeutic targets of Shenkangling intervention
| No. | Protein accession number | Protein name | Mol. weight [kDa] | B | E | E/B ratio | P-Value |
|---|---|---|---|---|---|---|---|
| 1 | gi|149033757 | Afamin, isoform CRA_a | 68.295 | 4.237 | 1.034 | 0.244 | 0.003 |
| 2 | gi|149065418 | Prolactin induced protein, isoform CRA_d | 16.440 | 0.969 | 0.371 | 0.383 | 0.038 |
| 3 | gi|6226289 | Urinary protein 2 | 11.068 | 4.391 | 0.757 | 0.172 | 0.000 |
| 4 | gi|202948 | Apolipoprotein A-II, partial | 10.255 | 0.308 | 1.440 | 4.675 | 0.001 |
| 5 | gi|204726 | Ig delta heavy chain constant region, partial | 22.422 | 0.604 | 1.555 | 2.575 | 0.043 |
| 6 | gi|59809147 | Complement factor I | 67.297 | 0.517 | 1.334 | 2.580 | 0.042 |
| 7 | gi|21263446 | 45 kDa calcium-binding protein | 42.075 | 0.270 | 0.894 | 3.311 | 0.010 |
| 8 | gi|56268879 | Complement factor B | 85.120 | 0.498 | 1.309 | 2.629 | 0.038 |
| 9 | gi|76780264 | Vitronectin | 54.724 | 0.459 | 1.182 | 2.575 | 0.043 |
| 10 | gi|1871124 | Osteopontin | 34.963 | 0.406 | 1.575 | 3.879 | 0.003 |
| 11 | gi|298351665 | Coagulation factor XII | 65.843 | 0.458 | 1.295 | 2.828 | 0.026 |
| 12 | gi|300794452 | Receptor-type tyrosine-protein phosphatase H precursor | 107.940 | 0.527 | 1.375 | 2.609 | 0.040 |
Discussion
Protein identification is necessary for understanding the pathogenesis of PNS. Our results indicate that compared with normal rats, AN model rats had 6 down-regulated proteins (gro, cystatin-related protein 2, probasin precursor, D Chain D Structure Of E.Coli Gapdh Rat Sperm Gapdh Heterotetramer, prostatic steroid binding protein, and L-2-hydroxyglutarate dehydrogenase) and 1 upregulated protein (afamin, isoform CRA_a). “Gro” has chemotactic activity on neutrophil granulocytes during inflammatory responses. “Gro” was once identified as a urine diagnostic marker for acute kidney injury (AKI) [25]. “Cystatin-related protein 2” can inhibit or reduce cysteine endopeptidase and hydrolyze peptides via the sulfhydryl group in the cysteine residue in its active site. This mechanism is related to various types of kidney disorders [26]. “Prostatic steroid binding protein” is an important glycoprotein secreted by ventral prostate [27]. “L-2-hydroxyglutarate dehydrogenase of mitochondria” serves as a catalyst of the reaction. “Afamin, isoform CRA_a” was found to be down-regulated in acute renal allograft rejection during pathological diagnosis. Afamin can be used as a diagnostic marker of acute renal allograft rejection [28]. “Gro, Afamin, Cystatin-related protein 2, and Afamin, isoform CRA_a” are involved in the pathogenesis of renal diseases and can be used as diagnostic markers for PNS.
Compared with the AN model group, the prednisone treatment group had 8 differentially expressed proteins, including 2 down-regulated proteins (Afamin, isoform CRA_a and prolactin-induced protein, isoform CRA_d) and 6 upregulated proteins (Apolipoprotein A-IV, telomerase catalytic subunit isoform c, aquaporin-1, carboxylesterase 2, haptoglobin (Hp), and Coagulation factor XII). “Afamin, isoform CRA_a ” has been identified as a diagnostic marker for PNS and a therapeutic target of prednisone. “Apolipoprotein A-IV” plays an important role in the secretion and catabolism of chylomicrons and very-low-density lipoprotein (VLDL). Moreover, this requires the presence of lipoprotein lipase, activated by ApoC-II. “Apolipoprotein A-IV” is an effective catalyst for lecithin cholesterol acyl transferase (LCAT) and is a key active component of high density lipoprotein (HDL) and chylomicrons. “Apolipoprotein A-IV” has been identified as a diagnostic marker for the progression of chronic kidney disease (CKD) [29]. “Aquaporin-1” is involved in forming the erythrocyte membranes and water channels of high-permeability renal proximal tubules, allowing water to move along the osmotic gradient. Hemodialysis (HD) promotes membrane proteomics remodeling, especially aquaporin-1 remodeling [30]. “Haptoglobin” accumulates in the kidneys and is secreted into the urine. Hemoglobin can be captured by free haptoglobin in the blood plasma to promote hepatic circulation of hemoglobin and reduce renal injury. It also has antioxidative and antibacterial effects and regulates acute phase reactions. Haptoglobin and the haptoglobin-hemoglobin complex can be rapidly cleared by the macrophage scavenger receptor CD163, which is expressed on the surface of liver Kupfer cells and acts through the endocytotic and lysosomal pathways. Haptoglobin that is not cleared is also known as fibronectin, which plays an important role in intestinal permeability by allowing for tight junction disassembly and regulating tolerance to foreign antigens and immune balance. The amount of haptoglobin multiplies in focal segmental glomerulosclerosis (FSGS) and it is considered to be a diagnostic marker in urine related to glomerular filtration rate [31]. “Coagulation factor XII” is a seroglycoid involved in the activation of blood coagulation, fibrinolysis, and the generation of bradykinin and angiotensin. Prekallikrein can be cleared by coagulation factor XII to form kallikrein and convert coagulation factor XII intoα-coagulation factor XII, which is further converted into β-coagulation factor XI in the presence of trypsin. α-coagulation factor XIIa can activate the conversion of coagulation factor XI into coagulation factor Xia.
Compared with the AN model group, the combined treatment group had 10 differentially expressed proteins, including 2 down-regulated proteins (Afamin, isoform CRA_a, urinary protein 2) and 8 upregulated proteins (Apolipoprotein A-II, Apolipoprotein A-IV, Inter alpha-trypsin inhibitor, heavy chain 4, 45 kDa calcium-binding protein, Telomerase, Vitronectin, Osteopontin, and Coagulation factor XII). “Afamin, isoform CRA_a” was not only a diagnostic marker for PNS but also therapeutic target of prednisone and the Shenkangling intervention. “Apolipoprotein A-II, partial” can stabilize the structure of HDL by linking to lipids. Apo A-II is an independent favorable prognostic factor for patients with metastatic renal cell carcinoma [32]. “Inter alpha-trypsin inhibitor, heavy chain 4” is involved in inflammatory responses and may contribute to renal disease progression or renal tissue regeneration. Its expression level in blood is positively correlated with the severity of nephrotoxicity, which highlights the relationship between protein expression and clinical chemistry endpoints [33]. “Apolipoprotein A-IV” was upregulated in the prednisone treatment group and further upregulated in the combined treatment group. Thus, “Apolipoprotein A-IV” was a therapeutic marker of both the Shenkangling intervention and prednisone. “Vitronectin” is a cell adhesion molecule and hyaluronidase in the serum and tissues. Vitronectin can bind to glycosaminoglycans and proteoglycans recognized by the integrin family. As a cell-matrix adhesion molecule, vitronectin inhibits membrane damage of the terminal cell lysis complement pathway. Vitronectin can be closely connected to hydroxyapatite to form ore matrix, which plays an important role in interactions between cellular matrices. Vitronectin was detected in the cyst fluid of patients with autosomal dominant polycystic kidney disease [34]. As a cytokine, “Osteopontin” promotes the secretion of interferon-gamma (INF-γ) and interleukin-12 (IL-12), while inhibiting the secretion of interleukin-10 (IL-10). This leads to type I allergic reactions. Osteopontin was discovered as an early diagnostic marker in urine for acute kidney injury (AKI) combined with refractory complications with high sensitivity and specificity. Normal osteopontin levels have a renal protective effect and offer hope for interventional therapy [35]. “Coagulation factor XII” was upregulated in the prednisone treatment group and further upregulated in the combined treatment group. Thus, “coagulation factor XII” may be a potential therapeutic target of both prednisone and Shenkangling.
Compared with the AN model group, the Shenkangling treatment group had 12 differentially expressed proteins, including 3 downregulated proteins (Afamin, isoform CRA_a, Prolactin-induced protein isoform CRA_d, and Urinary protein) and 9 upregulated proteins (Apolipoprotein A-II, Ig delta heavy chain constant region, Complement factor I, 45 kDa calcium-binding protein, Complement factor B, Vitronectin, Osteopontin, Coagulation factor XII, and Receptor-type tyrosine-protein phosphatase H precursor). “Afamin, isoform CRA_a” was upregulated in the AN model group but down-regulated in other groups. This result suggests the potential of using “Afamin, isoform CRA” as a diagnostic marker for PNS and as a therapeutic target of prednisone and Shenkangling. “Apolipoprotein A-II, partial” was upregulated in the combined treatment group and the Shenkangling intervention group. The expression level was similar between the two groups. However, no significant changes were observed in the prednisone treatment group. Therefore, “Apolipoprotein A-II, partial” was considered to be a therapeutic target of Shenkangling decoction but not of prednisone. “Complement factor B” is a component of the complement bypass pathway and is decomposed into two fragments by complete factor D, Ba and Bb. Bb is a serine protease that binds to complement factor 3b to produce C3 or C5 convertase. Bb is involved in the proliferation and differentiation of preactivated B lymphocytes, fast propagation of peripheral blood mononuclear cells, activation of lymphocyte blastogenesis, and erythrocyte lysis. Ba inhibits the proliferation of preactivated B lymphocytes. Proteomics analyses indicated that complement factor B is significantly upregulated in glomerulosclerosis. Complement factor B was considered to be involved in the activation of an alternative pathway for damaged glomeruli. A gradual increase inTGF-ß1 can promote the progression of glomerulosclerosis [35]. “Receptor-type tyrosine-protein phosphatase H precursor” negatively regulates the propagation of oligodendrocyte precursor cells in the embryonic spinal cord and promotes the differentiation of precursors into mature cells, thus achieving spinal cord differentiation of oligodendrocytes. “Receptor-type tyrosine-protein phosphatase H precursor” plays an important role in preventing cell apoptosis and protecting oligodendrocytes and is important in the memory of precedence relations. This process is achieved through transmitting dephosphorylation of important signaling proteins [36].
In conclusion, three proteins (Gro, Afamin, Cystatin-related protein 2, and Afamin, isoform CRA_a) were related to renal diseases in the AN model. They could be used as diagnostic markers for PNS. The expressions of “Telomerase” were significantly different between the prednisone treatment group and the AN model group. Thus, “Telomerase” is a potential therapeutic target of immunosuppressive prednisone. “Urinary protein 2, Apolipoprotein A-II, 45 kDa calcium-binding protein, Vitronectin, and Osteopontin” were the therapeutic targets of the Shenkangling decoction. “Afamin, isoform CRA_a, Apolipoprotein A-IV, Coagulation factor XII, Prolactin-induced protein, and Coagulation factor XII” were the therapeutic targets of both the Shenkangling decoction and prednisone. However, these conclusions should be verified in future clinical trials.
Acknowledgements
This work was supported by the The National Natural Science Foundation of China (Foundation Number: 81173434, 81202835).
Disclosure of conflict of interest
None.
Supporting Information
References
- 1.Lane JC, Kaskel FJ. Pediatric nephrotic syndrome: from the simple to the complex. Semin Nephrol. 2009;29:389–398. doi: 10.1016/j.semnephrol.2009.03.015. [DOI] [PubMed] [Google Scholar]
- 2.Cameron JS, Turner DR, Ogg CS, Sharpstoner P, Brown CB. The nephrotic syndrome in adults with ‘minimal change’ glomerular lesions. Q J Med. 1974;43:461–488. [PubMed] [Google Scholar]
- 3.He K, Li R. Analysis on wean refractory nephropathy. Chin J Pract Integr Med. 2004;4:2621–2622. [Google Scholar]
- 4.Zhang Y, Wei M, Wang Q. Study on the establishment of the model of minimal change nephropathy with adriamycin in rats. J Beijing Univ TCM. 2002;3:16–18. [Google Scholar]
- 5.Traum AZ, Schachter AD. Proteomic analysis in pediatric renal disease. Semin Nephrol. 2007;27:652–657. doi: 10.1016/j.semnephrol.2007.09.009. [DOI] [PubMed] [Google Scholar]
- 6.Yoshida Y, Miyamoto M, Bo X, Yaoita E, Yamamoto T. Overview of kidney and urine proteome databases. Contrib Nephrol. 2008;160:186–197. doi: 10.1159/000125982. [DOI] [PubMed] [Google Scholar]
- 7.Gorg A, Weiss W, Dunn MJ. Current two-dimensional electrophoresis technology for proteomics. Proteomics. 2004;4:3665–3685. doi: 10.1002/pmic.200401031. [DOI] [PubMed] [Google Scholar]
- 8.De Bock M, de Seny D, Meuwis MA, Chapelle JP, Louis E, Malaise M, Merville MP, Fillet M. Challenges for biomarker discovery in body fluids using SELDI-TOF-MS. J Biomed Biotechnol. 2010;2010:906082. doi: 10.1155/2010/906082. [DOI] [PMC free article] [PubMed] [Google Scholar]
- 9.Merchant ML, Klein JB. Proteomics and diabetic nephropathy. Semin Nephrol. 2007;27:627–636. doi: 10.1016/j.semnephrol.2007.09.003. [DOI] [PubMed] [Google Scholar]
- 10.Yoshida Y, Miyazaki K, Kamiie J, Sato M, Okuizumi S, Kenmochi A, Kamijo K, Nabetani T, Tsugita A, Xu B, Zhang Y, Yaoita E, Osawa T, Yamamoto T. Two-dimensional electrophoretic profiling of normal human kidney glomerulus proteome and construction of an extensible markup language (XML)-based database. Proteomics. 2005;5:1083–1096. doi: 10.1002/pmic.200401075. [DOI] [PubMed] [Google Scholar]
- 11.Miyamoto M, Yoshida Y, Taguchi I, Nagasaka Y, Tasaki M, Zhang Y, Xu B, Nameta M, Sezaki H, Cuellar LM, Osawa T, Morishita H, Sekiyama S, Yaoita E, Kimura K, Yamamoto T. In-depth proteomic profiling of the normal human kidney glomerulus using two-dimensional protein prefractionation in combination with liquid chromatography-tandem mass spectrometry. J Proteome Res. 2007;6:3680–3690. doi: 10.1021/pr070203n. [DOI] [PubMed] [Google Scholar]
- 12.Oh J, Pyo JH, Jo EH, Hwang SI, Kang SC, Jung JH, Park EK, Kim SY, Choi JY, Lim J. Establishment of a near-standard two-dimensional human urine proteomic map. Proteomics. 2004;4:3485–3497. doi: 10.1002/pmic.200401018. [DOI] [PubMed] [Google Scholar]
- 13.Pieper R, Gatlin CL, McGrath AM, Makusky AJ, Mondal M, Seonarain M, Field E, Schatz CR, Estock MA, Ahmed N, Anderson NG, Steiner S. Characterization of the human urinary proteome: a method for high-resolution display of urinary proteins on two dimensional electrophoresis gels with a yield of nearly 1400 distinct protein spots. Proteomics. 2004;4:1159–1174. doi: 10.1002/pmic.200300661. [DOI] [PubMed] [Google Scholar]
- 14.Khan A, Packer NH. Simple urinary sample preparation for proteomic analysis. J Proteome Res. 2006;5:2824–2838. doi: 10.1021/pr060305y. [DOI] [PubMed] [Google Scholar]
- 15.Pisitkun T, Shen RF, Knepper MA. Identification and proteomic profiling of exosomes in human urine. Proc Natl Acad Sci U S A. 2004;101:13368–13373. doi: 10.1073/pnas.0403453101. [DOI] [PMC free article] [PubMed] [Google Scholar]
- 16.Hawkridge AM, Muddiman DC. Mass spectrometry-based biomarker discovery: toward a global proteome index of individuality. Annu Rev Anal Chem. 2009;2:265–277. doi: 10.1146/annurev.anchem.1.031207.112942. [DOI] [PMC free article] [PubMed] [Google Scholar]
- 17.Wright GL Jr. SELDI protein chip MS: a platform for biomarker discovery and cancer diagnosis. Expert Rev Mol Diag. 2002;2:549–563. doi: 10.1586/14737159.2.6.549. [DOI] [PubMed] [Google Scholar]
- 18.Tang N, Tornatore P, Weinberger SR. Current developments in SELDI affinity technology. Mass Spectrom Rev. 2004;23:34–44. doi: 10.1002/mas.10066. [DOI] [PubMed] [Google Scholar]
- 19.Zhao H, Ljungberg B, Grankvist K, Rasmuson T, Tibshirani R, Brooks JD. Gene expression profiling predicts survival in conventional renal cell carcinoma. PLoS Med. 2006;3:13. doi: 10.1371/journal.pmed.0030013. [DOI] [PMC free article] [PubMed] [Google Scholar]
- 20.Oberthuer A, Berthold F, Warnat P, Hero B, Kahlert Y, Spitz R, Ernestus K, König R, Haas S, Eils R, Schwab M, Brors B, Westermann F, Fischer M. Customized oligonucleotide microarray gene expression based classification of neuroblastoma patients outperforms current clinical risk stratification. J. Clin. Oncol. 2006;24:5070–5078. doi: 10.1200/JCO.2006.06.1879. [DOI] [PubMed] [Google Scholar]
- 21.Ross PL, Huang YN, Marchese JN, Williamson B, Parker K, Hattan S, Khainovski N, Pillai S, Dey S, Daniels S, Purkayastha S, Juhasz P, Martin S, Bartlet-Jones M, He F, Jacobson A, Pappin DJ. Multiplexed protein quantitation in Saccharomyces cerevisiae using amine-reactive isobaric tagging reagents. Mol Cell Proteomics. 2004;3:1154–1169. doi: 10.1074/mcp.M400129-MCP200. [DOI] [PubMed] [Google Scholar]
- 22.Aggarwal K, Choe LH, Lee KH. Quantitative analysis of protein expression using amine-specific isobaric tags in Escherichia coli cells expressing rhsA elements. Proteomics. 2005;5:2297–2308. doi: 10.1002/pmic.200401231. [DOI] [PubMed] [Google Scholar]
- 23.Hu J, Qian J, Borisov O, Pan S, Li Y, Liu T, Deng L, Wannemacher K, Kurnellas M, Patterson C, Elkabes S, Li H. Optimized proteomic analysis of a mouse model of cerebellar dysfunction using amine-specific isobaric tags. Proteomics. 2006;6:4321–4334. doi: 10.1002/pmic.200600026. [DOI] [PMC free article] [PubMed] [Google Scholar]
- 24.Chen X, Walker AK, Strahler JR, Simon ES, Tomanicek-Volk SL, Nelson BB, Hurley MC, Ernst SA, Williams JA, Andrews PC. Organellar proteomics. Analysis of pancreatic zymogen granule membranes. Mol Cell Proteomics. 2006;5:306–312. doi: 10.1074/mcp.M500172-MCP200. [DOI] [PubMed] [Google Scholar]
- 25.Devarajan P. Proteomics for the investigation of acute kidney injury. Contrib Nephrol. 2008;160:1–16. doi: 10.1159/000125893. [DOI] [PubMed] [Google Scholar]
- 26.Bellei E, Cuoghi A, Monari E, Bergamini S, Fantoni LI, Zappaterra M, Guerzoni S, Bazzocchi A, Tomasi A, Pini LA. Proteomic analysis of urine in medication-overuse headache patients: possible relation with renal damages. J Headache Pain. 2012;13:45–52. doi: 10.1007/s10194-011-0390-9. [DOI] [PMC free article] [PubMed] [Google Scholar]
- 27.Jasavala R, Martinez H, Thumar J, Andaya A, Gingras AC, Eng JK, Aebersold R, Han DK, Wright ME. Identification of putative androgen receptor interaction protein modules: cytoskeleton and endosomes modulate androgen receptor signaling in prostate cancer cells. Mol Cell Proteomics. 2007;6:252–271. doi: 10.1074/mcp.M600169-MCP200. [DOI] [PubMed] [Google Scholar]
- 28.Freue GV, Sasaki M, Meredith A, Günther OP, Bergman A, Takhar M, Mui A, Balshaw RF, Ng RT, Opushneva N, Hollander Z, Li G, Borchers CH, Wilson-McManus J, McManus BM, Keown PA, McMaster WR. Proteomic signatures in plasma during early acute renal allograft rejection. Mol Cell Proteomics. 2010;9:1954–1967. doi: 10.1074/mcp.M110.000554. [DOI] [PMC free article] [PubMed] [Google Scholar]
- 29.Devarajan P. The use of targeted biomarkers for chronic kidney disease. Adv Chronic Kidney Dis. 2010;17:469–479. doi: 10.1053/j.ackd.2010.09.002. [DOI] [PMC free article] [PubMed] [Google Scholar]
- 30.Antonelou MH, Kriebardis AG, Velentzas AD, Kokkalis AC, Georgakopoulou SC, Papassideri IS. Oxidative stress-associated shape transformation and membrane proteome remodeling in erythrocytes of end stage renal disease patients on hemodialysis. J Proteomics. 2011;74:2441–2452. doi: 10.1016/j.jprot.2011.04.009. [DOI] [PubMed] [Google Scholar]
- 31.Kalantari S, Nafar M, Samavat S, Rezaei-Tavirani M, Rutishauser D, Zubarev R. Urinary prognostic biomarkers in patients with focal segmental glomerulosclerosis. Nephrourol Mon. 2014;6:e16806. doi: 10.5812/numonthly.16806. [DOI] [PMC free article] [PubMed] [Google Scholar]
- 32.Vermaat JS, van der Tweel I, Mehra N, Sleijfer S, Haanen JB, Roodhart JM, Engwegen JY, Korse CM, Langenberg MH, Kruit W, Groenewegen G, Giles RH, Schellens JH, Beijnen JH, Voest EE. Two-protein signature of novel serological markers apolipoprotein-A2 and serum amyloid alpha predicts prognosis in patients with metastatic renal cell cancer and improves the currently used prognostic survival models. Ann Oncol. 2010;21:1472–1481. doi: 10.1093/annonc/mdp559. [DOI] [PubMed] [Google Scholar]
- 33.Bandara LR, Kelly MD, Lock EA, Kennedy S. A correlation between a proteomic evaluation and conventional measurements in the assessment of renal proximal tubular toxicity. Toxicol Sci. 2003;73:195–206. doi: 10.1093/toxsci/kfg068. [DOI] [PubMed] [Google Scholar]
- 34.Lai X, Bacallao RL, Blazer-Yost BL, Hong D, Mason SB, Witzmann FA. Characterization of the renal cyst fluid proteome in autosomal dominant polycystic kidney disease (ADPKD) patients. Proteomics Clin Appl. 2008;2:1140–1152. doi: 10.1002/prca.200780140. [DOI] [PMC free article] [PubMed] [Google Scholar]
- 35.Zhang Y, Xu B, Kinoshita N, Yoshida Y, Tasaki M, Fujinaka H, Magdeldin S, Yaoita E, Yamamoto T. Label-free quantitative proteomic analysis reveals strong involvement of complement alternative and terminal pathways in human glomerular sclerotic lesions. J Proteomics. 2015;18:89–100. doi: 10.1016/j.jprot.2015.03.024. [DOI] [PubMed] [Google Scholar]
- 36.Marneros AG, Mehenni H, Reichenberger E, Antonarakis SE, Krieg T, Olsen BR. Gene for the human transmembrane-type protein tyrosine phosphatase H (PTPRH): genomic structure, fine-mapping and its exclusion as a candidate for Peutz-Jeghers syndrome. Cytogenet Cell Genet. 2001;92:213–216. doi: 10.1159/000056905. [DOI] [PubMed] [Google Scholar]
Associated Data
This section collects any data citations, data availability statements, or supplementary materials included in this article.