Abstract
In differentiated thyroid cancer (DTC), TX stage is defined as ‘primary tumour cannot be assessed’. The prognosis of patients with TX stage remains unclear. The aim of this study was to investigate the prognosis of TX stage and provide a perspective on treatment guidelines. We investigated a large cohort of DTC patients from the Surveillance, Epidemiology, and End Results database between 2004 and 2013. Patient mortality was examined by Kaplan-Meier analyses with log-rank tests and Cox proportional hazards regression analyses. The rate of cancer-specific mortality per 1000 person-years for patients with TX stage was higher than for patients with T1-T3 stage, but lower than for patients with T4 stage. The all-cause mortality per 1000 person-years for TX stage patients was also higher than for T1-T3 stage patients, but lower than for T4 stage patients. TX stage showed significant risk for cancer-specific mortality compared to T1 and T4 stages, but not T2 and T3 stages, after adjusting for influential risk factors. TX stage patients showed no significant risk for all-cause mortality compared to T2-T3 stage patients, but were different than T1 and T4 stage patients. These results provide new implications for the treatment of TX stage DTC patients.
Keywords: Differentiated thyroid cancer, TX stage, prognosis, SEER
Introduction
The incidence of thyroid cancer continues to rise worldwide, mostly resulting from the increasing use of diagnostic imaging (such as high resolution ultrasonography) and surveillance [1-5]. Differentiated thyroid cancer (DTC), which includes papillary thyroid carcinoma and follicular thyroid carcinoma, accounts for more than 85% of all thyroid cancers [6].
The TNM (tumor-node-metastasis) staging system (versions 6.0 and 7.0), which was initiated by the American Joint Committee on Cancer (AJCC), is a prognostic system that predicts DTC-specific mortality and is considered the most important standard to stratify cancer patients into different risk groups [7]. Because of the introduction of the TNM system, the management of early- and late-stage DTC has changed markedly in the past decade [4]. The ‘T’ component rates the tumor volume and disease advancement, providing a crucial mechanism of patient stratification. However, in some patients with DTC, the primary tumor cannot be assessed according to the TNM system, in both versions 6 and 7. These patients are defined as stage TX, and their diagnosis and treatment provide a great dilemma for clinicians.
The Surveillance, Epidemiology, and End Results (SEER) program of the National Cancer Institute is the largest publicly available source of data on cancer incidence and survival [8,9]. There have been very few investigations focusing on the prognosis and treatment of TX stage DTC patients. In this study, we evaluated the prognosis of TX stage DTC patients as compared to T1-T4 stage patients using propensity scored matching, based on SEER data from patients diagnosed between 2004 and 2013.
Materials and methods
Study population
We investigated a large number of DTC patients from the SEER project. The SEER project is a United States population-based cancer registry began in 1973, and SEER is supported by both the National Cancer Institute and Center for Disease Control and Prevention. It contains data from cancer patients on the incidence, prevalence, mortality, population-based variables, primary tumour characteristics, and more from multiple geographic regions.
Data collection and analysis
We examined SEER data and selected patients with a diagnosis of DTC from 2004 to 2013, as defined by a combination of ICD-O site code of C73.9 (i.e., thyroid, papillary, and/or follicular histology). The following diagnosis codes were included in the study: ‘papillary carcinoma’, ‘papillary adenocarcinoma’, ‘Papillary carcinoma, follicular variant’, ‘Papillary microcarcinoma’, ‘Papillary carcinoma, encapsulated’, ‘Papillary carcinoma, oxyphilic cell’, ‘Papillary carcinoma, columnar cell’, ‘follicular adenocarcinoma’, ‘Follicular adenocarcinoma well differentiated’, and ‘Follicular carcinoma, minimally invasive’. To compare the survival rate among different T stages, 94137 patients were categorized according to the AJCC T staging system (versions 6 and 7). Age, sex, race, N/M stage, histologic subtype, multifocality, and surgical (biopsy, lobectomy, subtotal or near-total thyroidectomy, and total thyroidectomy) and radiation (none or refused, external beam radiation therapy, and radioactive I-131 ablation) treatments were evaluated in patients with different T stages.
Statistical analyses
Patients were followed-up until December 2013. Patient survival curves including both thyroid cancer-specific mortality and all-cause mortality were examined by Kaplan-Meier analyses with the log-rank test. To further adjust for potential baseline confounding factors, a propensity score matching analysis was performed. Cox proportional hazards regression analyses were performed to estimate the hazard ratios with 95% CIs to show the different effect of stage on cancer-specific mortality and all-cause mortality [10]. All p-values were 2-sided, with P<0.05 being considered significant. Analyses were performed using SPSS version 19.0, Stata/SE version 12 (Stata Corp.) and GraphPad Prism version 6 (GraphPad Software Inc.).
Results
Demographic and clinical features
A total of 94,137 patients who had definite T stage DTC according to AJCC versions 6 and 7 were included in this study (Supplementary Tables 1 and 2). The distribution of tumour stages were as follows: 1,486 patients had stage TX disease, 55,615 had T1, 15,613 had T2, 17,529 had T3, and 3,669 had T4. The study patients’ mean age and follow-up for the different T stages are shown in Table 1. TX stage patients had significantly shorter follow-up (45.96±35.72 months) than patients with other stages. Additionally, 86.2% of TX stage patients were included in Stage I, 1.2% TX patients were included in Stage II, and 12.6% patients were included in Stage IVC (Supplementary Table 3).
Table 1.
Characteristics for Patients with different surgery treatment
| Covariate | Level | T-stage | ||||
|---|---|---|---|---|---|---|
|
| ||||||
| T1 (n=55615) | T2 (n=15613) | T3 (n=17529) | T4 (n=3669) | TX (n=1486) | ||
| Age | 49.64±14.38 | 46.22±15.94 | 49.03±16.42 | 57.11±17.65 | 41.54±17.32 | |
| Sex | Female (%) | 45049 (81.0) | 11721 (75.1) | 12129 (69.2) | 2406 (65.6) | 1104 (74.3) |
| Male (%) | 10566 (19.0) | 3892 (24.9) | 5400 (30.8) | 1263 (34.4) | 382 (25.7) | |
| Race | White (%) | 46207 (84.1) | 12620 (81.9) | 13888 (80.1) | 2891 (79.3) | 1071 (76.2) |
| Black (%) | 3442 (6.3) | 1152 (7.5) | 1158 (6.7) | 192 (5.3) | 132 (9.4) | |
| Other (%) | 5295 (9.6) | 1639 (10.6) | 2282 (13.2) | 563 (15.4) | 202 (14.4) | |
| Histology type | PTC (%) | 54348 (97.7) | 13442 (86.1) | 15745 (89.8) | 3428 (93.4) | 1310 (88.2) |
| Other (%) | 1267 (2.3) | 2171 (13.9) | 1784 (10.2) | 241 (6.6) | 176 (11.8) | |
| N-stage | N0 (%) | 48296 (87.9) | 12370 (81.2) | 10479 (61.6) | 1353 (42.0) | 716 (67.1) |
| N1 (%) | 6618 (12.1) | 2865 (18.8) | 6529 (38.4) | 1869 (58.0) | 351 (32.9) | |
| M-stage | M0 (%) | 55445 (99.7) | 15463 (99.0) | 17124 (97.7) | 3187 (86.9) | 1259 (84.7) |
| M1 (%) | 170 (0.3) | 150 (1.0) | 405 (2.3) | 482 (13.1) | 227 (15.3) | |
| Multifocality | No (%) | 34596 (62.8) | 9413 (61.2) | 8776 (51.2) | 1737 (50.6) | 514 (64.7) |
| Yes (%) | 20463 (37.2) | 5972 (38.8) | 8360 (48.8) | 1699 (49.4) | 280 (35.3) | |
| Radiation | None or refused (%) | 33904 (62.2) | 5484 (36.0) | 5017 (29.4) | 1017 (28.4) | 919 (64.7) |
| External beam radiation therapy (%) | 583 (1.1) | 303 (2.0) | 433 (2.5) | 393 (11.0) | 64 (4.5) | |
| Radioactive I-131 ablation (%) | 20038 (36.8) | 9451 (62.0) | 11587 (68.0) | 2170 (60.6) | 437 (30.8) | |
| Surgery | Lobectomy (%) | 9994 (18.3) | 1758 (11.6) | 1267 (7.3) | 220 (6.5) | 129 (15.8) |
| Subtotal or near-total thyroidectomy (%) | 2192 (4.0) | 568 (3.7) | 503 (2.9) | 145 (4.3) | 38 (4.7) | |
| Total thyroidectomy (%) | 42417 (77.7) | 12869 (84.7) | 15488 (89.8) | 3024 (89.2) | 648 (79.5) | |
| Survival months | 48.99±33.48 | 51.05±34.21 | 47.77±33.18 | 47.63±34.89 | 45.96±35.72 | |
PTC: papillary thyroid cancer.
Cancer specific and all-cause mortality for different stages of DTC
The rate of cancer-specific mortality per 1000 person-years for TX, T1, T2, T3, and T4 stage disease were 12.82 (95% confidence interval [CI], 10.19-16.13), 0.37 (95% CI, 0.31-0.47), 1.11 (95% CI, 0.88-1.39), 3.39 (95% CI, 2.99-3.85), and 35.71 (95% CI, 32.76-38.91), respectively (Table 2). The all-cause mortality, per 1000 person-years, in patients with TX, T1, T2, T3, and T4 stage disease were 31.45 (95% CI, 27.16-36.41), 7.67 (95% CI, 7.32-8.04), 8.52 (95% CI, 7.85-9.25), 12.58 (95% CI, 11.77-13.44), and 58.43 (95% CI, 54.63-62.49), respectively.
Table 2.
Hazard Ratios of different surgery for the cancer specific deaths and all cause deaths of thyroid cancer
| Surgery | Cancer-Specific Deaths, No. | % | Cancer-Specific Deaths per 1,000 Person-Years | 95% CI | All Cause Deaths, No. | % | All Cause Deaths per 1,000 Person-Years | 95% CI |
|---|---|---|---|---|---|---|---|---|
| T1 | 91 | 0.16 | 0.37 | 0.31-0.47 | 1811 | 3.26 | 7.67 | 7.32-8.04 |
| T2 | 77 | 0.49 | 1.11 | 0.88-1.39 | 576 | 3.69 | 8.52 | 7.84-9.25 |
| T3 | 243 | 1.39 | 3.39 | 2.99-3.85 | 891 | 5.08 | 12.58 | 11.77-13.44 |
| T4 | 556 | 15.15 | 35.71 | 32.76-38.91 | 905 | 24.67 | 58.43 | 54.63-62.49 |
| TX | 82 | 5.52 | 12.82 | 10.19-16.13 | 198 | 13.32 | 31.45 | 27.16-36.41 |
Risk factors for thyroid cancer-specific mortality and all-cause mortality
Cox univariate regression analyses showed that age, male sex, race, TNM stage, subtype, and radiation and surgical approach were significant risk factors of cancer-specific mortality. In the multivariate Cox regression model, TX stage showed significant risk for cancer-specific mortality as compared to T1 and T4, but not to T2 and T3, after adjusting for influential risk factors (Table 3). For all-cause mortality, univariate Cox regression analyses showed that age, male sex, race, TNM stage, subtype, multifocality, and radiation and surgical approach were significant risk factors. Multivariate Cox regression analysis determined that TX stage showed significant risk for cancer-specific mortality as compared to T1 and T4, but not to T2 and T3, after adjusting for influential risk factors (Table 3).
Table 3.
Risk factors for survival: outcome is all-cause mortality and thyroid cancer specific Mortality
| Covariate | Level | Thyroid Cancer specific mortality | All cause mortality | ||||||
|---|---|---|---|---|---|---|---|---|---|
|
| |||||||||
| Univariate Cox regression | Multivariate Cox regression | Univariate Cox regression | Multivariate Cox regression | ||||||
|
| |||||||||
| Hazard Ratio (95% CI) | p-value | Hazard Ratio (95% CI) | p-value | Hazard Ratio (95% CI) | p-value | Hazard Ratio (95% CI) | p-value | ||
| Age | 1.097 (1.092-1.102) | <0.001 | 1.065 (1.059-1.071) | <0.001 | 1.087 (1.084-1.089) | <0.001 | 1.077 (1.074-1.079) | <0.001 | |
| Sex | Female | ref | ref | ref | ref | ||||
| Male | 2.892 (2.565-3.260) | <0.001 | 1.37 (1.174-1.6) | <0.001 | 2.473 (2.33-2.625) | <0.001 | 1.659 (1.547-1.779) | <0.001 | |
| Race | White | ref | ref | ref | ref | ||||
| Black | 1.088 (0.856-1.384) | 0.490 | 1.026 (0.731-1.439) | 0.883 | 1.307 (1.174-1.454) | <0.001 | 1.409 (1.243-1.597) | <0.001 | |
| Other | 1.454 (1.226-1.726) | <0.001 | 0.957 (0.764-1.439) | 0.704 | 0.91 (0.821-1.007) | 0.068 | 0.811 (0.717-0.916) | 0.001 | |
| histological types | PTC | ref | ref | ref | ref | ||||
| Other | 3.559 (3.059-4.140) | <0.001 | 1.531 (1.225-1.913) | <0.001 | 2.012 (1.839-2.202) | <0.001 | 1.208 (1.074-1.359) | 0.002 | |
| T stage | TX | ref | ref | ref | ref | ||||
| T1 | 0.028 (0.021-0.038) | <0.001 | 0.263 (0.095-0.725) | 0.01 | 0.231 (0.199-0.267) | <0.001 | 0.595 (0.372-0.952) | 0.031 | |
| T2 | 0.082 (0.060-0.112) | <0.001 | 0.636 (0.229-1.764) | 0.384 | 0.251 (0.214-0.295) | <0.001 | 0.655 (0.408-1.053) | 0.081 | |
| T3 | 0.240 (0.187-0.308) | <0.001 | 1.468 (0.543-3.972) | 0.45 | 0.369 (0.316-0.43) | <0.001 | 0.768 (0.479-1.229) | 0.271 | |
| T4 | 2.654 (2.104-3.346) | <0.001 | 5.72 (2.122-15.413) | 0.001 | 1.792 (1.536-2.09) | <0.001 | 1.742 (1.086-2.792) | 0.021 | |
| N stage | N0 | ref | ref | ref | ref | ||||
| N1 | 4.904 (4.310-5.579) | <0.001 | 2.198 (1.842-2.623) | <0.001 | 1.732 (1.619-1.854) | <0.001 | 1.573 (1.437-1.721) | <0.001 | |
| M-stage | M0 | ref | ref | ref | ref | ||||
| M1 | 50.738 (44.873-57.370) | <0.001 | 6.399 (5.313-7.706) | <0.001 | 14.198 (13.057-15.44) | <0.001 | 3.685 (3.227-4.207) | <0.001 | |
| Multifocality | No | ref | ref | ref | ref | ||||
| Yes | 0.913 (0.798-1.044) | 0.185 | 0.806 (0.689-0.943) | 0.007 | 0.901 (0.845-0.96) | 0.001 | 0.973 (0.906-1.045) | 0.451 | |
| Radiation | None or refused | ref | ref | ref | ref | ||||
| Radiation Beam or Rdioactive implants | 16.208 (13.841-18.979) | <0.001 | 2.661 (2.103-3.368) | <0.001 | 3.967 (3.557-4.424) | <0.001 | 1.397 (1.199-1.628) | <0.001 | |
| Radioisotopes or Radiation beam + isotopes/implants | 0.986 (0.859-1.133) | 0.847 | 0.814 (0.676-0.98) | 0.03 | 0.628 (0.589-0.669) | <0.001 | 0.695 (0.643-0.751) | <0.001 | |
| Surgery | Lobectomy | ref | ref | ref | ref | ||||
| Subtotal or near-total thyroidectomy | 2.062 (1.467-2.9) | <0.001 | 1.18 (0.788-1.767) | 0.422 | 1.06 (0.909-1.238) | 0.457 | 1.023 (0.866-1.209) | 0.785 | |
| Total thyroidectomy | 1.417 (1.134-1.77) | 0.002 | 0.983 (0.754-1.282) | 0.898 | 0.829 (0.762-0.903) | <0.001 | 0.945 (0.859-1.039) | 0.241 | |
ref: reference; PTC: papillary thyroid cancer.
Adjusting for patient characteristics using propensity score matching
TX stage patients had a poorer prognosis (both cancer-specific mortality and all-cause mortality) compared to T1-T3 patients. However, TX stage patients had a better prognosis than T4 stage patients for cancer-specific mortality and all-cause mortality (Figure 1A-D). To minimize selection bias, propensity scored matching (PSM) analysis was performed regarding age, sex, race, N/M stage, histologic subtype, multifocality, and radiation treatment approaches. In survival analysis, TX stage patients had a poorer prognosis for cancer-specific mortality compared to all other stage patients (all P<0.001; Figure 2A-D) after PSM for age, sex, and race. There was a significant different between TX stage patients and T1-T3 stage patients, but not T4 stage patients, in cancer-specific mortality after PSM for age, sex, race, N/M stage, histologic subtype, and multifocality (P=0.001, 0.047, 0.004, and 0.5, respectively; Figure 3A-D). After matching for all influential factors, including radiation treatment, TX stage patients had a worse prognosis for cancer-specific mortality compared to T1-3 stage patients, but not T4 stage patients (P=0.001, 0.001, 0.001, and 0.723, respectively; Figure 4A-D).
Figure 1.
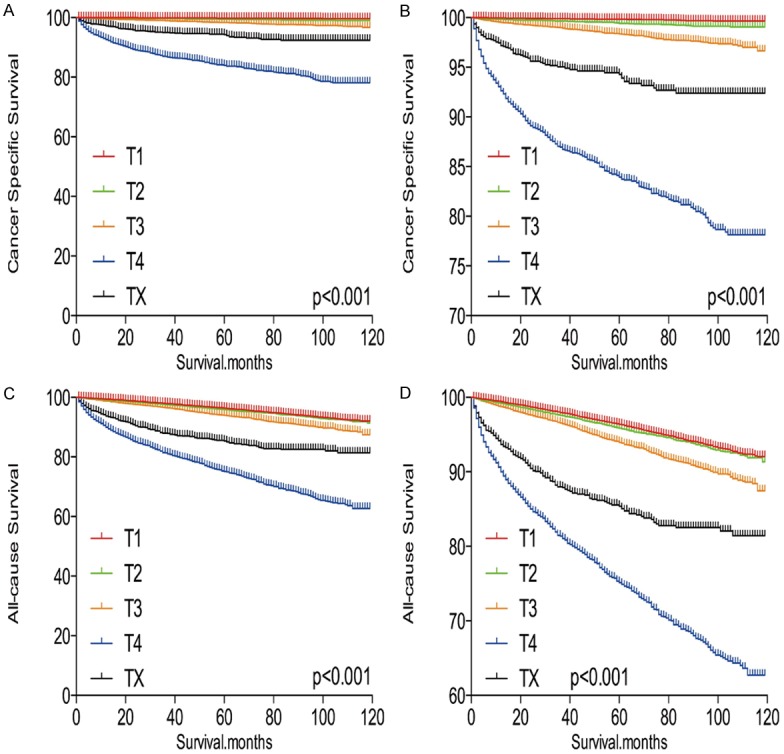
Kaplan Meier curves among patients stratified by T-stage for cancer-specific mortality (A, B) and all cause mortality (C, D).
Figure 2.
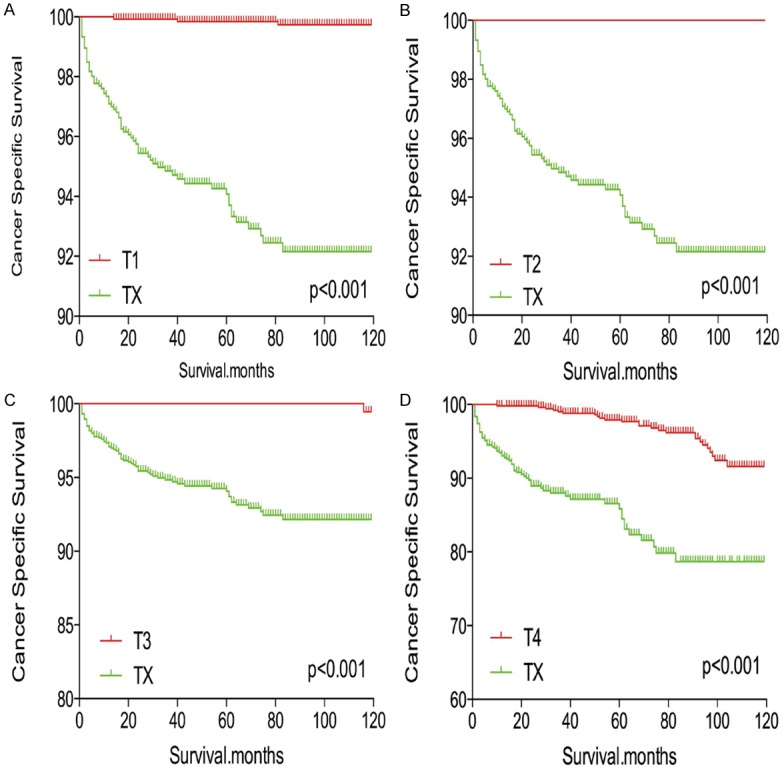
Kaplan Meier curves of cancer-specific mortality for matched T-stage pairs. Age, sex and race matching between TX and T1 (A), T2 (B), T3 (C), T4 (D), respectively.
Figure 3.
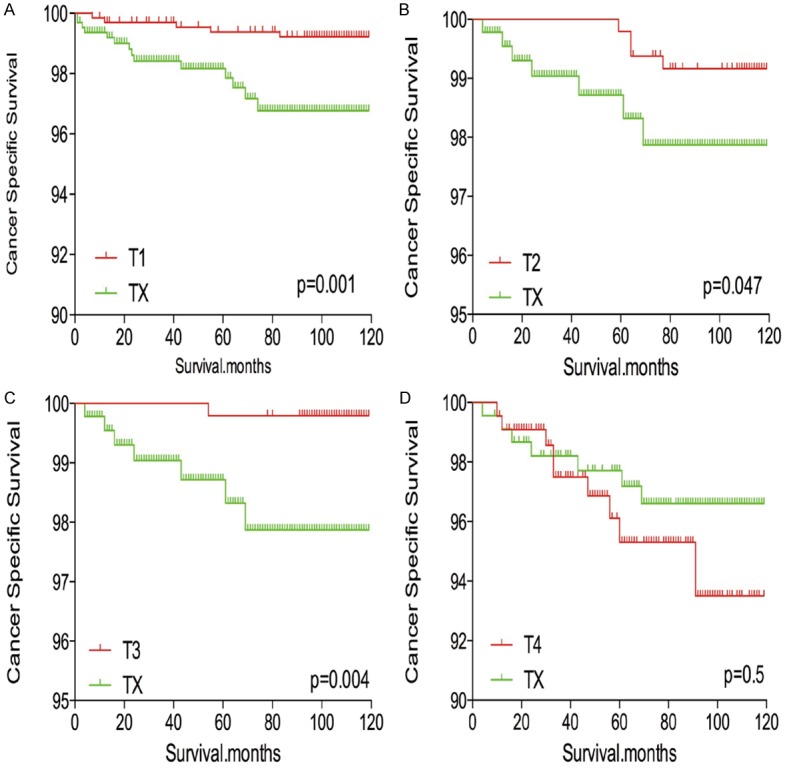
Kaplan Meier curves of cancer-specific mortality for matched T-stage pairs. Age, sex, race, N/M stage, histological types, multifocality matched between TX and T1 (A), T2 (B), T3 (C), T4 (D), respectively.
Figure 4.
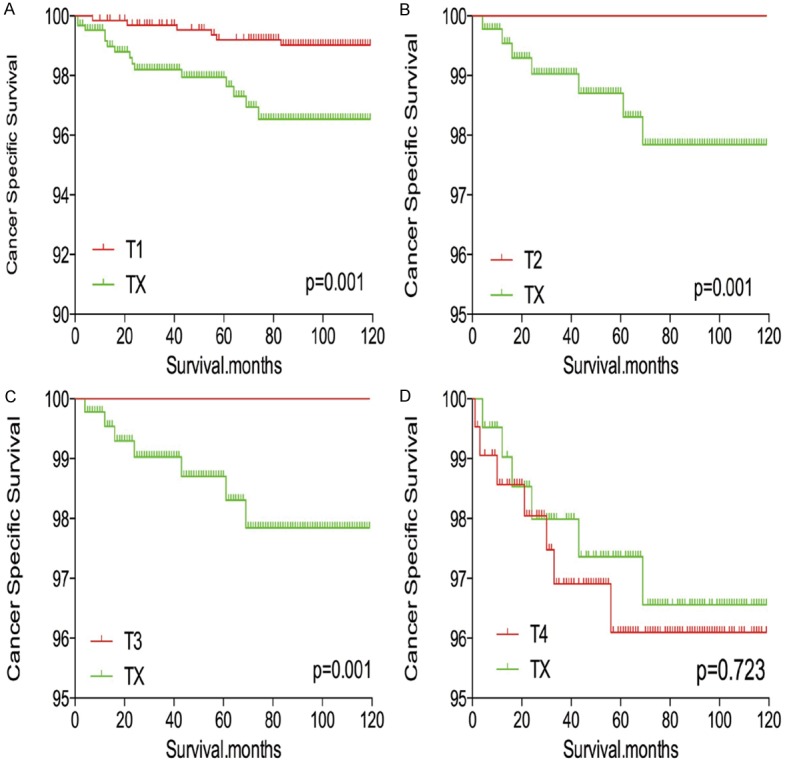
Kaplan Meier curves of cancer-specific mortality for matched T-stage pairs. Age, sex, race, N/M stage, histological types, multifocality and radiation treatment matched between TX and T1 (A), T2 (B), T3 (C), T4 (D), respectively.
In survival analysis for all-cause mortality, TX stage patients had a poorer prognosis compared to all other stage patients (all P<0.001; Figure 5A-D) after matching for age, sex, and race. TX stage patients had a poorer prognosis compared to T1-T3 stage patients, but their prognosis was similar to that of T4 stage patients after matching for age, sex, race, N/M stage, histologic subtype, and multifocality (P<0.001, <0.001, <0.001, and P=0.612, respectively; Figure 6A-D). After matching for all influential factors, including radiation treatment, TX stage patients showed a worse prognosis for all-cause mortality compared to T1-T3 stage patients (all P<0.001; Figure 7A-C), but a similar prognosis to T4 stage patients (P=0.783; Figure 7D).
Figure 5.
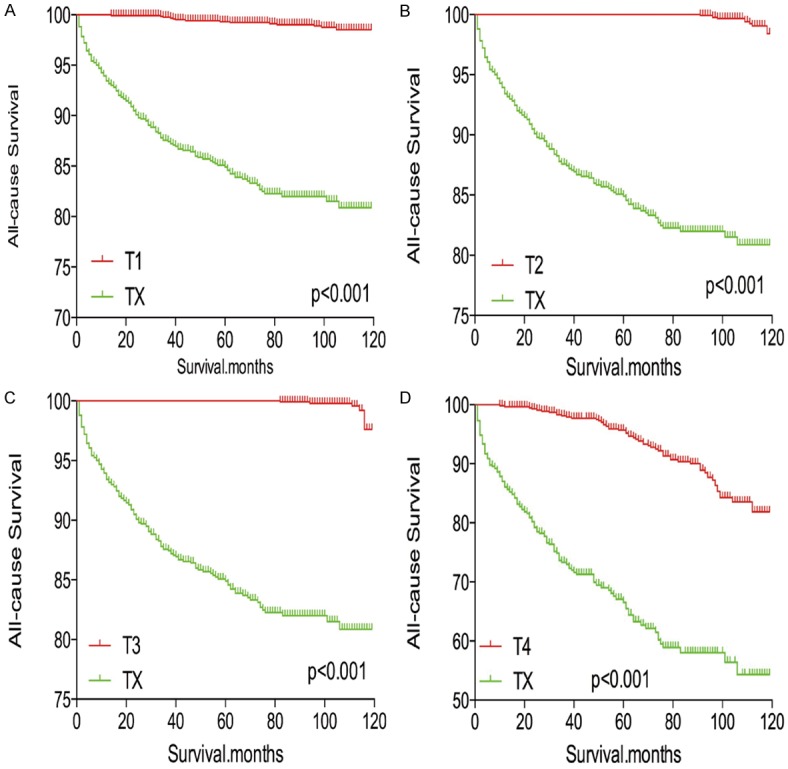
Kaplan Meier curves of all-cause mortality for matched T-stage pairs. Age, sex and race matching between TX and T1 (A), T2 (B), T3 (C), T4 (D), respectively.
Figure 6.
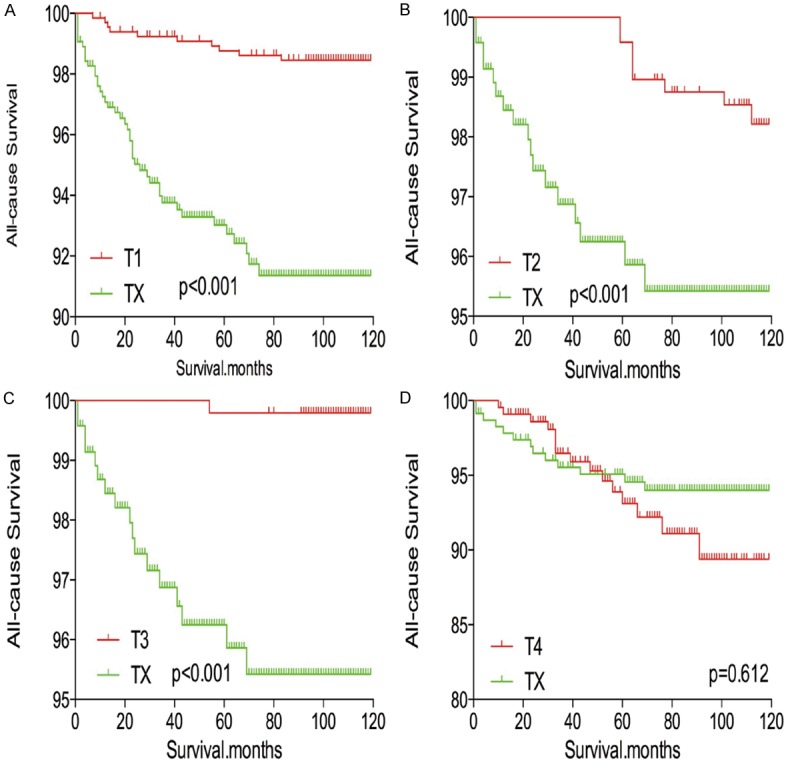
Kaplan Meier curves of all-cause mortality for matched T-stage pairs. Age, sex, race, N/M stage, histological types, multifocality matching between TX and T1 (A), T2 (B), T3 (C), T4 (D), respectively.
Figure 7.
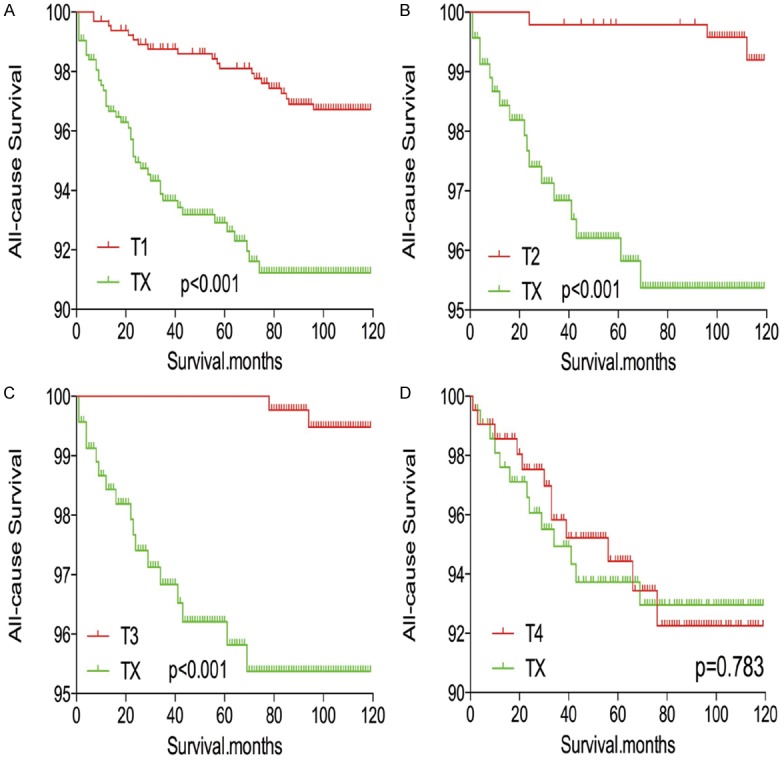
Kaplan Meier curves of all-cause mortality for matched T-stage pairs. Age, sex, race, N/M stage, histological types, multifocality and radiation treatment matching between TX and T1 (A), T2 (B), T3 (C), T4 (D), respectively.
Discussion
DTC patients have an overall low mortality and long survival compared to patients with other types of cancer. This is particularly true of patients with papillary thyroid microcarcinoma. Therefore, some scholars recommend relative conservative treatment for these patients [11,12]. However, thyroid cancer with high risk clinicopathological factors and molecular mutations, such as larger tumour size, lymph node metastasis, and BRAF mutation, may still have a poor prognosis [13-15].
The TX stage in DTC is defined as ‘primary tumour cannot be assessed’. A diagnosis of TX stage may occur in reoperation patients or result from metastases to the brain, bone, and lung. The prognosis of TX stage DTC patients has not been thoroughly investigated in the literature.
In our current study, we extracted TX stage patients using PSM from the SEER database and found that TX stage patients had a poorer prognosis than expected after adjustment for influential risk factors. In general, cancer specific mortality and all-cause mortality of TX stage patients was higher than that of T1-T3 stage patients, but similar to that of T4 stage patients.
A classification of TX may be incorporated into Stage I, II, or IVC, according to AJCC staging [7]. Our study also showed that 12.6% of TX stage patients were included in Stage IVC. Patients with Stage IVC would decrease the overall prognosis of TX patients as a group; this may be an explanation for our finding that the cancer-specific mortality of TX patients was poorer than T3 but better than T4 stage patients.
TX stage patients had a higher incidence of distant metastasis (227/1486, 15.3%) than any other T stage patients analysed in this study. According to previous studies, distant metastasis plays an important role in thyroid cancer-specific mortality and all-cause mortality [16,17]. Therefore, the high prevalence of distant metastasis in TX stage patients may precipitate a relative higher mortality from DTC. This hypothesis was also strengthened by the results from the PSM analysis.
The balance between inadequate treatment and overtreatment is a pivotal concern in the management of thyroid carcinoma [18]. Currently, there are still no categorical treatment guidelines, including surgical approach and postoperative radioiodine ablation treatment, for TX stage patients. Therefore, a relatively aggressive treatment approach may play an important role in mortality from DTC in TX stage patients.
This study had some limitations. One limitation of this study is that the utilized dataset lacked information regarding recurrence, thereby introducing overestimation bias when designating cancer-specific death and all-cause death. In addition, we could not perform PSM analysis for TX stage patients compared to T4 stage patients, as the number of T4 stage patients was nearly three times the number of TX stage patients. Furthermore, molecular markers such as BRAF point mutations and TERT promotor point mutations were not observed in our study or adjusted for in our analyses. Another limitation of this study is that family history, vascular invasion, and other histologic findings were not evaluated or included in our study.
Conclusions
In summary, TX stage patients had significantly poorer survival than T1-T3 stage patients. These results are not consistent with current expectations of DTC progression and have implications for the treatment of patients with TX stage DTC.
Disclosure of conflict of interest
None.
Supporting Information
References
- 1.Simard EP, Ward EM, Siegel R, Jemal A. Cancers with increasing incidence trends in the United States: 1999 through 2008. CA Cancer J Clin. 2012;62:118–128. doi: 10.3322/caac.20141. [DOI] [PubMed] [Google Scholar]
- 2.Siegel R, DeSantis C, Virgo K, Stein K, Mariotto A, Smith T, Cooper D, Gansler T, Lerro C, Fedewa S, Lin C, Leach C, Cannady RS, Cho H, Scoppa S, Hachey M, Kirch R, Jemal A, Ward E. Cancer treatment and survivorship statistics, 2012. CA Cancer J Clin. 2012;62:220–241. doi: 10.3322/caac.21149. [DOI] [PubMed] [Google Scholar]
- 3.Chen W, Zheng R, Baade PD, Zhang S, Zeng H, Bray F, Jemal A, Yu XQ, He J. Cancer statistics in China, 2015. CA Cancer J Clin. 2016;66:115–132. doi: 10.3322/caac.21338. [DOI] [PubMed] [Google Scholar]
- 4.Cabanillas ME, McFadden DG, Durante C. Thyroid cancer. Lancet. 2016;388:2783–2795. doi: 10.1016/S0140-6736(16)30172-6. [DOI] [PubMed] [Google Scholar]
- 5.Liu Z, Zeng W, Liu C, Wang S, Xiong Y, Guo Y, Li X, Sun S, Chen T, Maimaiti Y, Yu P, Huang T. Diagnostic accuracy of ultrasonographic features for lymph node metastasis in papillary thyroid microcarcinoma: a single-center retrospective study. World J Surg Oncol. 2017;15:32. doi: 10.1186/s12957-017-1099-2. [DOI] [PMC free article] [PubMed] [Google Scholar]
- 6.Mao Y, Xing M. Recent incidences and differential trends of thyroid cancer in the USA. Endocr Relat Cancer. 2016;23:313–322. doi: 10.1530/ERC-15-0445. [DOI] [PMC free article] [PubMed] [Google Scholar]
- 7.Haugen BR, Alexander EK, Bible KC, Doherty GM, Mandel SJ, Nikiforov YE, Pacini F, Randolph GW, Sawka AM, Schlumberger M, Schuff KG, Sherman SI, Sosa JA, Steward DL, Tuttle RM, Wartofsky L. 2015 American Thyroid Association Management Guidelines for adult patients with thyroid nodules and differentiated thyroid cancer: The American Thyroid Association Guidelines Task Force on thyroid nodules and differentiated thyroid cancer. Thyroid. 2016;26:1–133. doi: 10.1089/thy.2015.0020. [DOI] [PMC free article] [PubMed] [Google Scholar]
- 8.Adam MA, Thomas S, Hyslop T, Scheri RP, Roman SA, Sosa JA. Exploring the relationship between patient age and cancer-specific survival in papillary thyroid cancer: rethinking current staging systems. J. Clin. Oncol. 2016;34:4415–4420. doi: 10.1200/JCO.2016.68.9372. [DOI] [PMC free article] [PubMed] [Google Scholar]
- 9.Adam MA, Pura J, Goffredo P, Dinan MA, Reed SD, Scheri RP, Hyslop T, Roman SA, Sosa JA. Presence and number of lymph node metastases are associated with compromised survival for patients younger than age 45 years with papillary thyroid cancer. J. Clin. Oncol. 2015;33:2370–2375. doi: 10.1200/JCO.2014.59.8391. [DOI] [PubMed] [Google Scholar]
- 10.Spruance SL, Reid JE, Grace M, Samore M. Hazard ratio in clinical trials. Antimicrob Agents Chemother. 2004;48:2787–2792. doi: 10.1128/AAC.48.8.2787-2792.2004. [DOI] [PMC free article] [PubMed] [Google Scholar]
- 11.Leboulleux S, Tuttle RM, Pacini F, Schlumberger M. Papillary thyroid microcarcinoma: time to shift from surgery to active surveillance? Lancet Diabetes Endocrinol. 2016;4:933–942. doi: 10.1016/S2213-8587(16)30180-2. [DOI] [PubMed] [Google Scholar]
- 12.Wang TS, Goffredo P, Sosa JA, Roman SA. Papillary thyroid microcarcinoma: an over-treated malignancy? World J Surg. 2014;38:2297–2303. doi: 10.1007/s00268-014-2602-3. [DOI] [PubMed] [Google Scholar]
- 13.Liu Z, Huang T. Papillary thyroid microcarcinoma: an over-treated malignancy? World J Surg. 2016;40:764–765. doi: 10.1007/s00268-015-3244-9. [DOI] [PubMed] [Google Scholar]
- 14.Xing M. Prognostic utility of BRAF mutation in papillary thyroid cancer. Mol Cell Endocrinol. 2010;321:86–93. doi: 10.1016/j.mce.2009.10.012. [DOI] [PMC free article] [PubMed] [Google Scholar]
- 15.Xing M, Alzahrani AS, Carson KA, Viola D, Elisei R, Bendlova B, Yip L, Mian C, Vianello F, Tuttle RM, Robenshtok E, Fagin JA, Puxeddu E, Fugazzola L, Czarniecka A, Jarzab B, O’Neill CJ, Sywak MS, Lam AK, Riesco-Eizaguirre G, Santisteban P, Nakayama H, Tufano RP, Pai SI, Zeiger MA, Westra WH, Clark DP, Clifton-Bligh R, Sidransky D, Ladenson PW, Sykorova V. Association between BRAF V600E mutation and mortality in patients with papillary thyroid cancer. JAMA. 2013;309:1493–1501. doi: 10.1001/jama.2013.3190. [DOI] [PMC free article] [PubMed] [Google Scholar]
- 16.Lin JD, Hsueh C, Chao TC. Long-term follow-up of the therapeutic outcomes for papillary thyroid carcinoma with distant metastasis. Medicine (Baltimore) 2015;94:e1063. doi: 10.1097/MD.0000000000001063. [DOI] [PMC free article] [PubMed] [Google Scholar]
- 17.Liu Z, Wang L, Yi P, Wang CY, Huang T. Risk factors for central lymph node metastasis of patients with papillary thyroid microcarcinoma: a meta-analysis. Int J Clin Exp Pathol. 2014;7:932–937. [PMC free article] [PubMed] [Google Scholar]
- 18.Liu R, Bishop J, Zhu G, Zhang T, Ladenson PW, Xing M. Mortality risk stratification by combining BRAF V600E and TERT promoter mutations in papillary thyroid cancer: genetic duet of BRAF and TERT promoter mutations in thyroid cancer mortality. JAMA Oncol. 2016 doi: 10.1001/jamaoncol.2016.3288. [Epub ahead of print] [DOI] [PubMed] [Google Scholar]
Associated Data
This section collects any data citations, data availability statements, or supplementary materials included in this article.


