

Abstract
Until now, the exact mechanisms for N2O production in dissimilatory nitrate/nitrite reduction to ammonium (DNRA) remain underexplored. Previously, we investigated this mechanism in Bacillus licheniformis and Bacillus paralicheniformis, ubiquitous gram‐positive bacteria with many industrial applications, and observed significant strain dependency and media dependency in N2O production which was thought to correlate with high residual NO 2 −. Here, we further studied the influence of several physicochemical factors on NO 3 − (or NO 2 −) partitioning and N2O production in DNRA to shed light on the possible mechanisms of N2O production. The effects of NO 3 − concentrations under variable or fixed C/N‐NO 3 − ratios, NO 2 − concentrations under variable or fixed C/N‐NO 2 − ratios, and NH 4 + concentrations under fixed C/N‐NO 3 − ratios were tested during anaerobic incubation of soil bacterium B. paralicheniformis LMG 6934 (previously known as B. licheniformis), a strain with a high nitrite reduction capacity. Monitoring of growth, NO 3 −, NO 2 −, NH 4 + concentration, and N2O production in physiological tests revealed that NO 3 − as well as NO 2 − concentration showed a linear correlation with N2O production. Increased NO 3 − concentration under fixed C/N‐NO 3 − ratios, NO 2 − concentration, and NH 4 + concentration had a significant positive effect on NO 3 − (or NO 2 −) partitioning ([N–NH 4 +]/[N–N2O]) toward N2O, which may be a consequence of the (transient) accumulation and subsequent detoxification of NO 2 −. These findings extend the information on several physiological parameters affecting DNRA and provide a basis for further study on N2O production during this process.
Keywords: ammonification, dissimilatory nitrate/nitrite reduction to ammonium, nitrate respiration, nitrogen assimilation
1. INTRODUCTION
Nowadays, there is an increasing concern about the year‐by‐year rising emissions of N2O from soil, as it is a potent greenhouse gas that damages the ozone layer (Daniel et al., 2007; Solomon et al., 2007; Wuebbles, 2009). Denitrification has been considered as the dominant NO3 − reducing process in soil, in which NO3 − is sequentially converted to NO2 −, NO, N2O, and N2. However, recently, field surveys (Bu et al., 2017; Silver, Herman, & Firestone, 2001; Silver, Thompson, Reich, Ewel, & Firestone, 2005; Song, Lisa, & Tobias, 2014; Yin et al., 2017) and research with pure cultures (Bleakley & Tiedje, 1982; Mania, Heylen, Spanning, & Frostegård, 2014; Smith & Zimmerman, 1981; Stremińska, Felgate, Rowley, Richardson, & Baggs, 2012; Sun, De Vos, & Heylen, 2016) have suggested that NO3 −‐ammonifying bacteria could be a significant source of N2O. Ammonification or dissimilatory NO3 − reduction to NH4 + (DNRA) is the reduction in NO3 − to NH4 +, via NO2 − (Cole, 1996; Simon, 2002), with the concomitant production of nonstoichiometric amounts of N2O amounting to around 3%–36% of consumed NO3 − (Bleakley & Tiedje, 1982). DNRA can follow different scenarios, with respiratory membrane‐bound NarG, cytoplasmic NasBC, or periplasmic NO3 − reductase NapA for NO3 − reduction to NO2 −, followed by NO2 − reduction to NH4 + via cytoplasmic nitrite reductase NirB or a periplasmic nitrite reductase NrfA (Bothe, Ferguson, & Newton, 2006), with NirB induced under high NO3 − concentration and NrfA induced by low NO3 − concentration (Wang & Gunsalus, 2000). The exact mechanisms for N2O production remain underexplored. They may differ between ammonifiers and most likely depend on the enzymes involved in the DNRA process. In Escherichia coli K‐12, NO was shown to be produced by NrfA under the regulation of Fnr and mutants lacking Hmp, NarG or Fnr did not produce NO (Corker & Poole, 2003). In Salmonella enterica serovar Typhimurium, NarGHI was responsible for NO generation from NO2 − (Gilberthorpe & Poole, 2008). The produced NO in these two bacteria will be reduced to N2O by flavohemoglobin Hmp and the di‐iron‐centered flavorubredoxin NorV with its NADH‐dependent oxidoreductase NorW. Hmp is phylogenetically widespread in both denitrifying bacteria and nondenitrifiers. It can oxidize NO to NO3 − in the presence of oxygen and reduce NO to N2O under anoxic conditions (Kim, Orii, Lloyd, Hughes, & Poole, 1999). However, not Hmp but NorVW (Gomes et al., 2002) may be the significant source of N2O, which can detoxify NO under micro‐oxic or anaerobic conditions (Torres et al., 2016). Besides, canonical NO reductase—Nor, which mostly exists in denitrifiers, was also found in certain DNRA bacteria. For instance, Bacillus vireti LMG 21834T performs DNRA by NarG, NrfA, and Nor (CbaA), with additional NosZ partially reducing N2O to N2 (Mania, Heylen, Spanning, & Frostegård, 2016; Mania et al., 2014). Similarly, Bacillus paralicheniformis LMG 6934, LMG7559 (renamed since 2015 (Dunlap, Kwon, Rooney, & Kim, 2015)), and Bacillus licheniformis LMG17339 possess NarG, NirBD, and Nor, but not NosZ (Sun et al., 2016). While, the mutants of Salmonella typhimurium Typhimurium lacking Hmp, NorV, and NrfA and of E.coli lacking NirB, NrfA, NorV, and Hmp still can reduce NO, suggesting that there are other mechanisms of NO reduction uncharacterized (Mills, Rowley, Spiro, Hinton, & Richardson, 2008).
As denitrification and DNRA are the two well‐known NO3 −‐consuming pathways in soil, with the former contributing to nitrogen loss to the atmosphere and the latter mainly leading to nitrogen retention in soil, studies with respect to different factors influencing these two pathways have been widely performed. It is well known that DNRA is favored over denitrification at higher C/N‐NO3 − ratios or NO3 − limitation (Van den Berg, Van Dongen, Abbas, & Van Loosdrecht, 2015; Yoon, Cruz‐Garcia, Sanford, Ritalahti, & Löffler, 2015), higher pH (Schmidt, Richardson, & Baggs, 2011; Yoon, Cruz‐Garcia, et al., 2015), higher temperature (Ogilvie, Rutter, & Nedwell, 1997; Yoon, Sanford, & Loeffler, 2015), and certain NO2 − to NO3 − ratios (Schmidt et al., 2011; Yoon, Sanford, et al., 2015). However, the influence of these environmental drivers on NO3 − partitioning to NH4 + and N2O in DNRA remains underexplored, although increased understanding might help unravel the underlying mechanisms and regulation of N2O production. Early work by Smith showed that higher C/NO3 − ratios under constant or decreasing NO3 − concentration (Smith, 1981) favored NO3 − partitioning to N2O in Citrobacter sp. with glucose as energy source and suggested that N2O production was induced by (transient) accumulation of NO2 −. However, recently, it was found, both in batch and continuous cultures of Citrobacter sp. and Bacillus sp., that low C/N‐NO3 − (C limitation, N sufficiency) ratios resulted in higher NO2 − accumulation accompanied by higher N2O production compared to high C/N‐NO3 − with constant initial glycerol concentration as carbon source and variable NO3 − concentration (Stremińska et al., 2012).
It has been generally known that NH4 + inhibits assimilatory NO3 − reduction (general N control) (Schreier, Brown, Hirschi, Nomellini, & Sonenshein, 1989; Stouthamer, 1976), increases growth rate of cells (Sun, De Vos, & Willems, 2017), and does not repress dissimilatory NO3 − reduction (Konohana, Murakami, Nanmori, Aoki, & Shinke, 1993). In B. licheniformis, NO3 − reductase activity increased with rising initial concentrations of NH4 +, but with an upper limit of 46 mmol/L, suggesting that the activity is not for NO3 − assimilation but for other physiological functions containing a dissimilatory NO3 − reduction (Konohana et al., 1993). However, no previous work has been performed on the influence of NH4 + on N2O production in DNRA. As NH4 + can react with multiple nitrogen regulation sensors (TnrA, CodY, and GlnR) and the mechanism of N2O production and regulation of nitrogen metabolism are underexplored in DNRA strains, it is possible that NH4 + can influence NO3 − partitioning to N2O.
B. (para)licheniformis is a spore‐forming gram‐positive bacterium that can be isolated from soils and plant material all over the world but was never reported to be pathogenic for either animals or plants (Sneath, Mair, Sharpe, & Holt, 1986). In our previous study, we investigated three strains of B. (para)licheniformis (as mentioned above) which were disguised as denitrifiers and proved that they are N2O emitters performing DNRA probably by expression of narG, nirB, qNor, and hmp, with up to one‐third of all NO3 − converted to N2O (Sun et al., 2016). They are therefore suitable model organisms to study the mechanism of N2O production during DNRA and to supplement the insights of environmental drivers influencing DNRA. Following our observation of N2O production being correlated to high residual NO2 −, here we used the soil bacterium B. paralicheniformis LMG 6934, selected for its high nitrite tolerance and efficient nitrite reduction ability, to study in detail the influence of NO3 −, NO2 −, and NH4 + concentrations on N2O production via DNRA in batch cultures.
2. MATERIALS AND METHODS
2.1. Strains
Bacillus paralicheniformis LMG 6934 was obtained from the BCCM/LMG bacteria collection. It was grown aerobically at 37°C on TSA for 2 days, followed by two subcultivations on TSA before use in growth experiments in mineral media.
2.2. Growth experiments
Anaerobic growth experiments were performed in mineral medium (containing 4.6 mmol/L NH4 +) supplemented with 10 mmol/L potassium NO3 − as electron acceptor and 30 mmol/L glucose as electron donor unless stated otherwise. Mineral medium was as described by Stanier, Palleroni, and Doudoroff (1966), including 10 mmol/L phosphate buffer (pH 6.92 ± 0.05), 2.3 mmol/L (NH4)2SO4, 0.4 mmol/L MgSO4·7H2O, 0.04 mmol/L CaCl2·2H2O, 27 μmol/L EDTA, 25 μmol/L FeSO4·7H2O, 10 μmol/L ZnSO4·7H2O, 25 μmol/L MnSO4·H2O, 3.8 μmol/L CuSO4·5H2O, 2 μmol/L Co(NO3)2·6H2O, and 0.196 μmol/L (NH4)6Mo7O24·24H2O. Serum vials (120 ml) were soaked in 1 mol/L HCl overnight to remove growth inhibiting substances and subsequently washed five times with distilled water before use. Serum vials with 50 ml medium were sealed with black butyl rubber stoppers. After autoclaving, the headspace of the serum vials was replaced via five cycles of evacuating and refilling with helium. Serum vials were inoculated (1% v/v) with a bacterial suspension of OD600 of 1.0 ± 0.05. Each growth experiment was performed in triplicate, and noninoculated media in duplicate were included to check for potential nitrosation reactions in sterile medium, which were proved negligible after measurement. After inoculation, serum vials were incubated at 37°C, 150 rpm, for 72 hr for endpoint analysis or for 192 hr for detailed growth experiments. Gas samples and culture samples were taken at the start and the end of the experiment, or at various time points over the incubation for detailed analysis (see below).
Mineral media with different supplements were designed and tested to study the effect of several factors on NO3 − partitioning to NH4 + and N2O: (1) different NO3 − concentrations (5 mmol/L, 10 mmol/L, and 15 mmol/L) and 30 mmol/L glucose resulting in variable C/N‐NO3 − ratios of 36, 18, and 12; (2) different NO3 − concentrations (5 mmol/L, 10 mmol/L, and 15 mmol/L) under identical C/N‐NO3 − ratio of 12 (glucose 10 mmol/L, 20 mmol/L, and 30 mmol/L, respectively); (3) different NO2 − concentrations without NO3 − (1 mmol/L, 5 mmol/L, and 10 mmol/L) and 30 mmol/L glucose resulting in variable C/N‐NO2 − ratios of 180, 36, and 18; (4) different NO2 − concentrations (1 mmol/L, 5 mmol/L, and 10 mmol/L) under identical C/N‐NO2 − ratio of 18 (glucose 3 mmol/L, 15 mmol/L, and 30 mmol/L, respectively); (5) different NH4 + concentrations (0 mmol/L, 1 mmol/L, 4.6 mmol/L, and 10 mmol/L) and 10 mmol/L NO3 −, 30 mmol/L glucose, resulting a C/N‐NO3 − ratio of 18. Under all conditions, incubation was limited to 72 hr for endpoint analysis. However, in addition, in setup (4), serum vials were also incubated for a longer period of 192 hr and the complete NO2 − reduction process was followed over time, and growth and nitrogen compound concentrations were monitored at several time points to study the mechanism of N2O production.
2.3. Analytical procedures
Samples of 1 ml were taken from cultures through the rubber septum of serum vials with sterile syringes for growth determination and colorimetric determination of NH4 +, NO3 −, and NO2 −. Growth was determined by measuring the optical density OD600 of 100 μl sample in duplicate in microtiter plates and standardized to 1 cm path length using PathCheck Sensor of the spectrophotometer (Molecular Devices, Spectramax plus 384, USA). Samples left were centrifuged at 17,949g for 2 min to remove the cells, and supernatants were kept frozen at ‐20°C until colorimetric determination. NH4 + concentration was determined with the salicylate‐nitroprusside method (absorption at a wavelength of 650 nm) (Baethgen & Alley, 1989), and NO2 − and NO3 − concentrations were determined with Griess reaction (Griess, 1879) and Griess reaction with cadmium (Cataldo, Haroon, Schrader, & Youngs, 1975; Navarro‐Gonzalvez, Garcıa‐Benayas, & Arenas, 1998), respectively. For endpoint measurements, NH4 + production was corrected per strain for the amount of NH4 + assimilated based on OD600 values obtained. Standard curves covered ranges suitable for the tested media and were strictly linear with an R2 of 0.99. For determination of N2O, 1 ml sample of the headspace of serum vials was taken with sterile syringes and was injected into a gas chromatograph (Compact GC with EZChrom Elite Software, Interscience, Netherlands, 2012, column molsieve 5A 7*0.32 mm and Rt‐Q Bond 3*0.32 mm). N2O concentrations were corrected for pressure and solubility based on Henry's law. Henry's constant for N2O is 0.025 mol/L/atm at 25°C.
Statistical differences in end product concentration (OD600, NO3 −/NO2 −/NH4 + concentration, N2O production) and ratios of N‐NH4 + production to N–N2O production (indicating NO3 − partitioning to NH4 + and N2O) in the tests of different environmental drivers were processed using factorial ANOVA and least significant difference post hoc testing in IBM SPSS 23 or the nonparametric Kruskal–Wallis H test.
3. RESULTS AND DISCUSSION
3.1. NO2 − reduction ability
Already three decades ago, it was suggested that N2O production during DNRA originates from detoxification of accumulated NO2 − (Bleakley & Tiedje, 1982; Smith, 1983). Our previous study demonstrated that B. paralicheniformis LMG 6934 had a high NO2 − tolerance of 10 mmol/L and could efficiently perform DNRA by reducing all intermediary NO2 − to NH4 + and N2O (Sun et al., 2016), while B. paralicheniformis LMG 7559 showed a NO2 − tolerance of 6.29 ± 0.39 mmol/L, and both LMG 7559 and B. licheniformis LMG 17339 had residual NO2 − (2.76 mmol/L ± 0.57 mmol/L, 4.88 mmol/L ± 0.60 mmol/L) after 72‐hr incubation probably due to their lower tolerance to the toxic effect of NO2 −. Less N2O was produced by LMG 6934 than by LMG 7559 and LMG 17339, and less NO3 − partitioning to N2O was observed as well ([N‐NH4 +]/[N–N2O] of 4.24 ± 0.29 vs 1.49 ± 0.82, 0.71 ± 0.09, respectively) (Sun et al., 2016 and unpublished data therein). To uncover factors affecting N2O production during DNRA, here, NO2 − reduction was anaerobically tested in LMG 6934 at concentrations of 1 mmol/L, 5 mmol/L, and 10 mmol/L under variable C/N‐NO2 − ratios of 180, 36, and 18 and fixed C/N‐NO2 − ratios of 18. After 72‐hr incubation, growth was observed under all NO2 − concentrations tested, with all NO2 − converted to NH4 + or N2O, thus confirming its high tolerance to NO2 − (Table 1; Figure 1). Indeed, compared with other DNRA strains (Sun et al., 2016) belonging to Bacillus sp. and Citrobacter sp. (Stremińska et al., 2012), B. licheniformis (Konohana et al., 1993), and Pseudomonas stutzeri D6 (Yang, Wang, & Zhou, 2012), LMG 6934 showed a high NO2 − reduction ability, with up to 10 mmol/L of initial NO2 − consumed. Furthermore, up to 15 mmol/L NO3 − was converted to NH4 + (>85%) and N2O (<15%) with no residual NO2 − at the end of the experiment. The high NO2 − reduction ability observed in our tests with high NO3 − or NO2 − concentration might partly be due to increased NirB activity (Wang & Gunsalus, 2000).
Table 1.
Overview of growth tests of Bacillus paralicheniformis LMG 6934
| Media supplements | C/N‐NOx − | ∆OD600 | Concentration (mmol/L) | ||
|---|---|---|---|---|---|
| NO3 − or NO2 − consumed | NH4 + produced | N2O produced | |||
| 5 mmol/L NO3 − | 36 | 0.60aA (0.10) | 5.23aA (0.15) | 4.80aA (0.27) | 0.33aA (0.12) * |
| 10 mmol/L NO3 − # | 18 | 0.71aAB (0.20) | 9.87bA (0.43) | 8.69 Ab (0.36) | 0.59bA (0.03) |
| 15 mmol/L NO3 − ## | 12 | 0.76a (0.09) | 14.67c (1.13) | 12.94c (1.15) | 0.87c (0.02) |
| 5 mmol/L NO3 − | 12 | 0.22aB (0.03) | 4.91aA (0.21) | 4.50aA (0.23) | 0.20aA (0.01) |
| 10 mmol/L NO3 − | 12 | 0.50bA (0.05) | 9.55bA (1.13) | 8.57bA (1.11) | 0.49bB (0.01) |
| 15 mmol/L NO3 − ## | 12 | 0.76c (0.09) | 14.67c (1.13) | 12.94c (1.15) | 0.87c (0.02) |
| 1 mmol/L NO2 − | 180 | 0.35a (0.02) | 1.17a (0.01) | 1.17a (0.01) | 0a (0.00) |
| 5 mmol/L NO2 − | 36 | 0.51bA(0.02) | 6.19bB (0.17) | 5.71bB (0.15) | 0.19abA (0.16) |
| 10 mmol/L NO2 − | 18 | 0.66cA (0.03) | 13.76cB (0.97) | 12.99cB (0.99) | 0.39bC (0.01) |
| 1 mmol/L NO2 − | 18 | 0.22a (0.01) | 0.99a (0.01) | 0.99a (0.01) | 0a (0.00) |
| 5 mmol/L NO2 − | 18 | 0.52bA (0.06) | 4.87bA (0.06) | 4.35bA (0.07) | 0.26bA (0.04) |
| 10 mmol/L NO2 − | 18 | 0.95cBC (0.10) | 9.57cA (0.17) | 8.53cA (0.16) | 0.55cABC (0.08) |
| 0 mmol/L NH4 + | 18 | 0.67aAB (0.08) | 10.32aAB (1.34) | 9.16aA (1.26) | 0.58aA (0.04) |
| 1 mmol/L NH4 + | 18 | 0.82aB (0.02) | 10.95aAB (0.18) | 9.71aA (0.20) | 0.62aA (0.02) |
| 4.6 mmol/L NH4 + # | 18 | 0.71aAB (0.20) | 9.87aA (0.43) | 8.69aA (0.36) | 0.59aA (0.03) |
| 10 mmol/L NH4 + | 18 | 0.87aB (0.03) | 8.99aA (0.99) | 7.68aA (0.91) | 0.65aA (0.04) |
Growth (∆OD600), electron acceptors (NO3 − or NO2 −) consumption, NH4 + production (measured concentrations of NH4 + corrected for loss through assimilation), and N2O production after 72‐hr incubation under different media composition are shown. All NO3 − added was consumed by the end of the experiment. Standard deviations are given between brackets (n = 3 if not stated otherwise). Statistics were determined via one‐way ANOVA or nonparametric tests accordingly. Significant differences (p < .05) of each parameter (OD600, NO3 − or NO2 − consumption, NH4 +, and N2O production) within the same experiment (five experiments: (i) NO3 − concentration test under variable C/N− NO3 − ratio, (ii) NO3 − concentration test under fixed C/N− NO3 − ratio, (iii) NO2 − concentration test under variable C/N− NO3 − ratio, (iv) NO2 − concentration test under fixed C/N– NO3 − ratio, and (v) NH4 + concentration test (with initial 10 mmol/L NO3 −)) are displayed as different lowercase letters (combined lower letters are used to indicate nonsignificance for multiple variables). Significant differences in each parameter between four different experiments when 5 mmol/L NO3 −/NO2 − or 10 mmol/L NO3 −/NO2 − supplied is displayed as capital letters.
* n = 2.
#or ##indicates data from the same test analyzed twice in different experiment interpretation.
Figure 1.
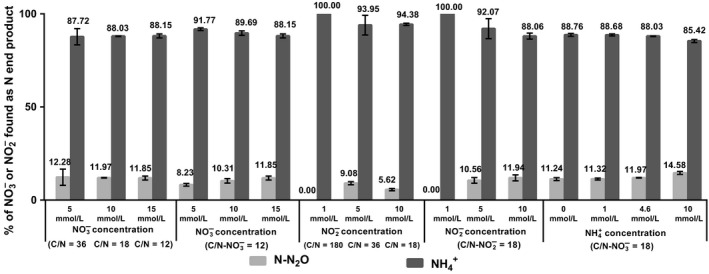
Production of nitrous compounds by Bacillus paralicheniformis LMG 6934 in different mineral media after 72‐hr anaerobic incubation. Percentages of end products of anaerobic NO 3 −/NO 2 − reduction in mineral medium with increasing NO 3 − concentration under variable C/N‐NO 3 − ratio (n = 2 for C/N ratio of 36); with increasing NO 3 − concentration under fixed C/N‐NO 3 − ratio of 12 (for 15 mmol/L NO 3 −, it is the same experiment as above, the same data used twice for analysis); with increasing NO 2 − concentration under variable C/N‐NO 2 − ratios; with increasing NO 2 − concentration under fixed C/N‐NO 2 − ratio of 18; with increasing NH 4 + concentration under fixed C/N‐NO 3 − ratio of 18. Error bars represent standard deviation (n = 3 if not stated otherwise). Measured concentrations of NH 4 + were corrected for loss through assimilation
3.2. Influence of NO3 − and NO2 − concentration on N2O production
Anaerobic growth experiments with 5, 10, and 15 mmol/L NO3 − under variable C/N‐NO3 − ratios of 36, 18, and 12 after 72‐hr incubation revealed that NO3 − or intermediate NO2 − was completely converted to N2O or NH4 + for all conditions tested and growth ceased and sporulation started due to either NO3 − limitation for respiration or carbon source (glucose) limitation for fermentation. Growth (∆OD600) (including sporulation), consumption of NO3 −, production of NOv and NH4 + are summarized in Table 1. Percentages of NO3 − or NO2 − converted to N2O or NH4 + under different conditions are shown in Figure 1. Percentage of NO3 − recovery as N2O and growth (∆OD600) under 10 mmol/L NO3 − condition agreed with previous observations (Sun et al., 2016).
With a constant 30 mmol/L glucose and variable C/N‐NO3 − ratios of 36, 18, and 12, the rising NO3 − concentration had an influence on N2O production (p = .0018) and NH4 + production (p = .000027), with higher NO3 − concentrations leading to production of more NH4 + and more N2O (Table 1; Figure 2a). Different NO3 − concentrations had no significant influence on NO3 − partitioning ([N–NH4 +]/[N–N2O]) (p = .417) (Figure 3a). Growth did not significantly increase with NO3 − concentration (p = .287) (Figure 3a), and this may because excess glucose (initial 30 mmol/L) supports fermentation and sporulation. Smith (1981) showed that, in Citrobacter, higher C/N‐NO3 − ratios with constant NO3 − concentration favor NO3 − partitioning to N2O. In our study, the opposite was apparently found: A higher C/N‐NOv ratio led to less N2O produced. However, the higher C/N‐NO3 − ratios here were created by lowering NO3 − concentration with glucose at 30 mmol/L. We hypothesize that lower NO3 − concentration would lead to lower NO2 − concentration resulting in a lower toxic effect and less need for its reduction to nontoxic N2O. To confirm that a rising NO3 − concentration and exclude the influence of C/N‐NO3 − ratio, which might be strain‐dependent (Stremińska et al., 2012), the same experiment was repeated under fixed C/N‐NO3 − ratio of 12. Again, after 72‐hr anaerobic incubation, all NO3 − or NO2 − was completely converted to N2O or NH4 + without any residual NO2 − left for all conditions tested. As expected, growth increased with a rising NO3 − concentration under fixed C/N‐NO3 − ratio (p = .000128) and was supported by fermentation of glucose and NO3 − respiration. NH4 + production (p = .000101) and N2O production (p = 4.95 × 10⁻⁹) showed a positive correlation with the rising NO3 − concentration (Table 1; Figure 2b). In addition, increased NOv concentration from 5 to 10 mmol/L promoted NO3 − partitioning to N2O and negatively impacted its partitioning to NH4 + (p = .008) (Figure 3b), but this effect was statistically not significant when increasing from 10 to 15 mmol/L NO3 − (p = .155).
Figure 2.
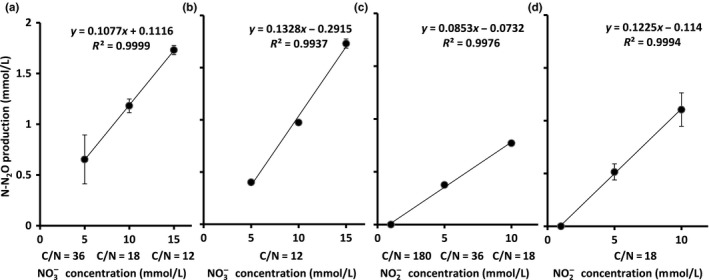
N–N2O production by B. paralicheniformis LMG 6934 in different mineral media after 72‐hr anaerobic incubation. Media tested are supplemented with the following: (a) increased NO 3 − concentration under variable C/N‐NO 3 − ratio of 36 (n = 2), 18, and 12; (b) increased NO 3 − concentration under fixed C/N‐NO 3 − ratio of 12; (c) increased NO 2 − concentration under variable C/N‐NO 2 − ratio of 180, 36, and 18; (d) increased NO 2 − concentration under fixed C/N‐NO 2 − ratio of 18. Error bars represent standard deviation (n = 3 if not stated otherwise). Trend line equations and R‐squared value are given
Figure 3.
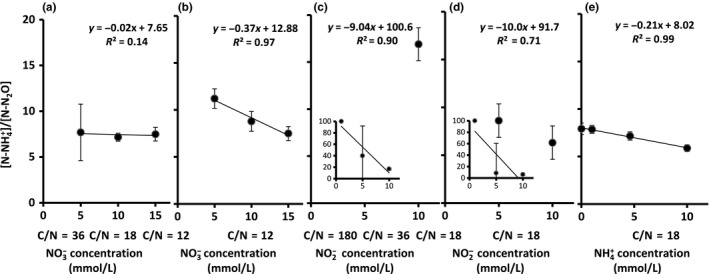
Ratio of N‐NH 4 + production to N–N2O production by B. paralicheniformis LMG 6934 after 72‐hr anaerobic incubation in mineral media. Mineral medium supplemented with the following: (a) increasing NO 3 − concentration under variable C/N‐ NO 3 − ratio of 36 (n = 2), 18, and 12; (b) increasing NO 3 − concentration under fixed C/N‐NO 3 − ratio of 12; (c) increasing NO 2 − concentration under variable C/N‐NO 2 − ratio of 180, 36, and 18; (d) increasing NO 2 − concentration under fixed C/N‐ NO 2 − ratio of 18; (e) increasing NH 4 + concentration under fixed C/N‐ NO 3 − ratio of 18. Error bars represent standard deviation (n = 3 if not stated otherwise). The inserted figure in panel C and panel D is the complete figure of the test with a [N–NH 4 +]/[N–N2O] range from 0 to 100. Trend line equations and R‐squared value are given
In contrast to a rising NO3 − concentration under variable C/N‐NO3 − ratios, a rising NO2 − concentration under variable C/N‐NO2 − ratio did show a positive effect on NH4 + production (p = .027) and N2O production (p = .034) and resulted in an increasing growth (p = .000017) supported by fermentation and/or respiration as stated above. However, why this excess glucose did not result in similar growth by fermentation as it did in NO3 − concentration tests is unclear. As expected, with more NO2 − consumed in the media, more NH4 + and N2O were produced, resulting in more cell growth (Table 1; Figure 2c). In addition, increase in NO2 − concentration had a significantly positive influence on NO2 − partitioning to N2O but the significance was only shown between 1 mmol/L and 10 mmol/L NO2 − (p = .00028) (Figure 3c), which is also the case for the amount of N2O produced (Table 1).
Similarly, increasing NO2 − concentration under fixed C/N‐NO2 − ratio of 18 also showed a positive effect on growth (p = .000049), NH4 + production (p = 1.9996E−8), and N2O production (p = .000033) (Table 1; Figure 2d). Likewise, rising NO2 ‐ concentration had a significantly positive influence on NO2 − partitioning to N2O, but the significance was only shown between 1 mmol/L and 5 mmol/L or 10 mmol/L NO2 − (p = 7.5916E−11) (Figure 3d). To further study the conditions affecting N2O production during DNRA, growth was monitored over a 192‐hr incubation period. As expected, NH4 + was produced during incubation, accompanied by N2O production and NO2 − partitioning to N2O at first increased, becoming stable after 48 hr (Figure 4).
Figure 4.
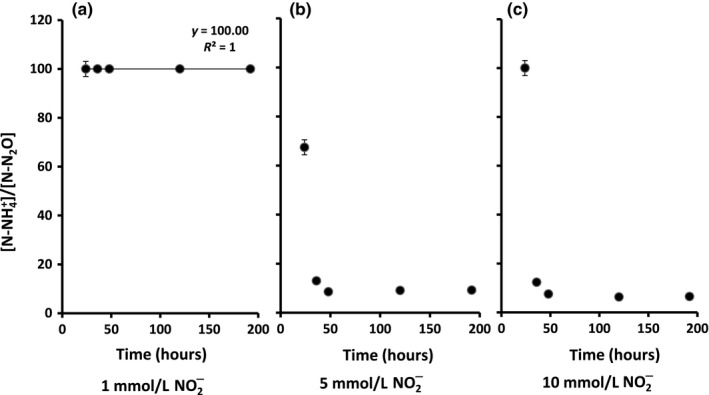
Ratio of N–NH 4 + production to N–N2O production during 192 hr of anaerobic incubation of B. paralicheniformis LMG 6934 in mineral medium supplemented with NO 2 − under fixed C/N‐ NO 2 − ratio of 18: (a) 1 mmol/L NO 2 − added; (b) 5 mmol/L NO 2 − added; and (c) 10 mmol/L NO 2 − added
In summary, a linear but nonstoichiometric correlation was observed for the first time between NO3 − or NO2 − concentration and N2O production (Figure 2), which may be useful for further studies of N2O production calculation or interpretation of its regulation. In addition, increasing NO3 − concentration under fixed C/N‐NO3 − ratio but not under variable C/N‐NO3 − ratios and increasing NO2 − concentration under variable as well as fixed C/N‐NO2 − ratios significantly increased NO3 − partitioning to N2O in B. paralicheniformis LMG 6934 (Figure 3). The latter may be a direct effect of NO2 −, probably by action of NirB, while NO3 − may work through a combined effect of C/N‐NO3 − ratio and NO3 − concentration. Higher NO3 − concentration under fixed C/N‐NO3 − ratio promotes NO3 − partitioning to N2O, and this agrees with physiological data of a previous study (Smith, 1981). It indeed makes sense that, under higher NO3 − concentration, more NO2 − transiently accumulates and therefore needs to be detoxified, leading to a higher proportion of NO3 − to N2O. This agrees with the observation in NO2 − batch tests. Non‐negligibly, the C/N‐NO3 − referred to was the initial ratio. The C/N‐NO3 − ratio varied during the batch incubation tests. Constant C/N‐NO3 − in a chemostat setup is suggested for further study.
3.3. Influence of NH4 + concentration on N2O production
It is known that NH4 + can repress NO3 − assimilation causing NO2 − to accumulate (Schreier et al., 1989; Stouthamer, 1976); however, it does not inhibit nitrate reduction for dissimilation toward NH4 + (Konohana et al., 1993). Here, we tested its effect on N2O production and used NH4 + concentrations of 0 mmol/L, 1 mmol/L, 4.6 mmol/L (standard), and 10 mmol/L in the presence of 10 mmol/L NO3 − under a fixed C/N‐NO3 − ratio of 18. After 72‐hr incubation, growth was obtained under all NH4 + concentrations, even without NH4 + added (Table 1; Figure 1). All NO3 − was converted to NH4 + or N2O, with some samples reaching up to approx. 10 mmol/L NH4 + produced (Table 1). There was no statistically significant effect of NH4 + concentration on growth (p = .12) as expected, and similar results were observed for NH4 + production (p = .12) or N2O production (p = .11), again confirming that LMG 6934 is a vigorous ammonifier able to produce and take up sufficient NH4 + for growth. However, there was a significant effect of NH4 + on NO3 − partitioning to N2O but only in medium with the highest NH4 + concentration (10 mmol/L) compared with media with lower NH4 + concentration (p = .000932) (Figure 3e). This observation requires further confirmation with higher NH4 + concentrations, and this mechanism behind this effect requires in‐depth study.
Thus, anaerobic growth was not repressed by NH4 + (starting from 10 mmol/L initial NH4 +, an NH4 + concentration as high as 18.47 ± 0.10 mmol/L was measured after incubation), which is in agreement with previous studies on Bacillus sp. and Citrobacter sp. (Smith & Zimmerman, 1981). Almost no difference in growth was obtained under different NH4 + concentrations. Similar observations were described with B. licheniformis No. 40‐2, a strain isolated from a hot spring but under aerobic conditions (Konohana et al., 1993).
3.4. Ecological relevance and future perspectives
Here, we demonstrated that indeed NO3 − as well as NO2 − concentration shows a linear correlation with N2O production and increasing concentrations lead to more partitioning to N2O which may be a direct result of NO2 − detoxification. This linear correlation is media‐dependent and may be strain‐dependent, as was found in our previous study when comparing three Bacillus strains in different media conditions (Sun et al., 2016). The underlying mechanisms, however, remain elusive. Further studies are required to assess whether these effects apply for other DNRA strains and under field conditions. Such information may in future contribute to the estimation of environmental N2O emissions based on in situ measurements of environmental parameters. Furthermore, we also observed that higher NH4 + concentration could lead to more NO3 − partitioning to N2O. Canonical NO reductase (Nor) is widespread among denitrifiers and nondenitrifiers and efficient for NO reduction to N2O. The genome of strain LMG 6934 encodes for quinol‐dependent NO reductase (qNor) as well as Hmp (Sun et al., 2016). Hmp, however, has not been fully proved to be physiologically relevant as protection from nitrosative stress (Torres et al., 2016). Therefore, as there was no growth defect caused by NO toxicity under the conditions tested, it can be hypothesized that qNor rather than Hmp may be a significant source of N2O in LMG 6934. However, it still remains unclear whether NO generation is by NarG, NirBD, or both of them.
This study contributed to characterization of DNRA performance under different environmental drivers, including increasing NO3 −, NO2 −, and NH4 +. Although we used relatively high concentrations of NO3 − or NO2 −, they are still relevant as comparable concentrations can exist in the environment (Reisenauer, 1966; Wolt, 1994), for example during fertilization events of agricultural land (Dechorgnat et al., 2011). We realize that the N2O production during ammonification might be considered negligible compared to that during canonical denitrification, especially when considering LMG 6934 is highly tolerant to NO2 −. Nevertheless, ammonifiers are widely distributed in the environment and DNRA is considered the preferred NO3 − reduction process in agricultural soils as it retains N in the system (Mania et al., 2014). Therefore, future N2O mitigation strategies promoting DNRA need to consider the potential concomitant N2O production. In this respect, B. paralicheniformis LMG 6934, which under laboratory conditions produces less N2O than some other DNRA bacteria (Sun et al., 2016), is an interesting strain. It was originally isolated from garden soil, showing nonfastidious growth and is nonpathogenic and may thus be a good candidate for application in agricultural fields, to promote DNRA over denitrification. This would favor nitrogen retention, increasing efficiency of nitrogen fertilizer applied and, to a certain degree, reducing N2O emission from the soil.
CONFLICT OF INTEREST
The authors declare that they have no conflict of interest.
ACKNOWLEDGMENT
We thank China Scholarship Council (File number 201206330054) and BOF CSC cofunding from Ghent University (grant 01SC2713) for funding. This research was also supported the Special Research Fund (BOF) of Ghent University (GOA project 01G01911).
Sun Y, Vos PD, Willems A. Influence of nitrate and nitrite concentration on N2O production via dissimilatory nitrate/nitrite reduction to ammonium in Bacillus paralicheniformis LMG 6934. MicrobiologyOpen. 2018;7:e592 10.1002/mbo3.592
REFERENCES
- Baethgen, W. , & Alley, M. (1989). A manual colorimetric procedure for measuring ammonium nitrogen in soil and plant Kjeldahl digests. Communications in Soil Science & Plant Analysis, 20(9–10), 961–969. 10.1080/00103628909368129 [DOI] [Google Scholar]
- Bleakley, B. H. , & Tiedje, J. M. (1982). Nitrous oxide production by organisms other than nitrifiers or denitrifiers. Applied and Environmental Microbiology, 44(6), 1342–1348. [DOI] [PMC free article] [PubMed] [Google Scholar]
- Bothe, H. , Ferguson, S. , & Newton, W. E . (2006). Biology of the nitrogen cycle. Amsterdam, The Netherlands: Elsevier. [Google Scholar]
- Bu, C. , Wang, Y. , Ge, C. , Ahmad, H. A. , Gao, B. , & Ni, S.‐Q. (2017). Dissimilatory nitrate reduction to ammonium in the yellow river estuary: Rates, abundance, and community diversity. Scientific Reports, 7(1), 6830 10.1038/s41598-017-06404-8 [DOI] [PMC free article] [PubMed] [Google Scholar]
- Cataldo, D. A. , Haroon, M. , Schrader, L. E. , & Youngs, V. L. (1975). Rapid colorimetric determination of nitrate in plant‐tissue by nitration of salicylic‐acid. Communications in Soil Science and Plant Analysis, 6, 71–80. 10.1080/00103627509366547 [DOI] [Google Scholar]
- Cole, J. (1996). Nitrate reduction to ammonia by enteric bacteria: Redundancy, or a strategy for survival during oxygen starvation? FEMS microbiology Letters, 136(1), 1–11. 10.1111/j.1574-6968.1996.tb08017.x [DOI] [PubMed] [Google Scholar]
- Corker, H. , & Poole, R. K. (2003). Nitric oxide formation by Escherichia coli – Dependence on nitrite reductase, the NO‐sensing regulator Fnr, and flavohemoglobin Hmp. Journal of Biological Chemistry, 278, 31584–31592. 10.1074/jbc.M303282200 [DOI] [PubMed] [Google Scholar]
- Daniel, J. , Velders, G. , Douglass, A. , Forster, P. , Haughustaine, D. , Isasksen, I. , … Wallington, T. (2007). Scientific assessment of ozone depletion: Global ozone research and monitoring project–report# 50. Geneva: World Meteorological Organization. [Google Scholar]
- Dechorgnat, J. , Nguyen, C. T. , Armengaud, P. , Jossier, M. , Diatloff, E. , Filleur, S. , & Daniel‐Vedele, F. (2011). From the soil to the seeds: The long journey of nitrate in plants. Journal of Experimental Botany, 62(4), 1349–1359. 10.1093/jxb/erq409 [DOI] [PubMed] [Google Scholar]
- Dunlap, C. , Kwon, S.‐W. , Rooney, A. , & Kim, S.‐J. (2015). Bacillus paralicheniformis sp. nov., isolated from fermented soybean paste. International Journal of Systematic and Evolutionary Microbiology, 65, 3487–3492. 10.1099/ijsem.0.000441 [DOI] [PubMed] [Google Scholar]
- Gilberthorpe, N. J. , & Poole, R. K. (2008). Nitric oxide homeostasis in Salmonella typhimurium: Roles of respiratory nitrate reductase and flavohemoglobin. Journal of Biological Chemistry, 283(17), 11146–11154. 10.1074/jbc.M708019200 [DOI] [PubMed] [Google Scholar]
- Gomes, C. M. , Giuffre, A. , Forte, E. , Vicente, J. B. , Saraiva, L. M. , Brunori, M. , & Teixeira, M. (2002). A novel type of nitric‐oxide reductase Escherichia coli flavorubredoxin. Journal of Biological Chemistry, 277(28), 25273–25276. 10.1074/jbc.M203886200 [DOI] [PubMed] [Google Scholar]
- Griess, P. (1879). Bemerkungen zu der abhandlung der H.H. Weselsky und Benedikt “Ueber einige azoverbindungen. Chemische Berichte, 12, 426–428. [Google Scholar]
- Kim, S. O. , Orii, Y. , Lloyd, D. , Hughes, M. N. , & Poole, R. K. (1999). Anoxic function for the Escherichia coli flavohaemoglobin (Hmp): Reversible binding of nitric oxide and reduction to nitrous oxide. FEBS Letters, 445, 389–394. 10.1016/S0014-5793(99)00157-X [DOI] [PubMed] [Google Scholar]
- Konohana, T. , Murakami, S. , Nanmori, T. , Aoki, K. , & Shinke, R. (1993). Increase in nitrate reductase activity with ammonium chloride in Bacillus licheniformis by shaking culture. Bioscience, Biotechnology, and Biochemistry, 57(12), 2170–2171. 10.1271/bbb.57.2170 [DOI] [PubMed] [Google Scholar]
- Mania, D. , Heylen, K. , Spanning, R. J. , & Frostegård, Å. (2014). The nitrate‐ammonifying and nosZ‐carrying bacterium Bacillus vireti is a potent source and sink for nitric and nitrous oxide under high nitrate conditions. Environmental Microbiology, 16, 3196–3210. 10.1111/1462-2920.12478 [DOI] [PubMed] [Google Scholar]
- Mania, D. , Heylen, K. , Spanning, R. J. , & Frostegård, Å. (2016). Regulation of nitrogen metabolism in the nitrate‐ammonifying soil bacterium Bacillus vireti and evidence for its ability to grow using N2O as electron acceptor. Environmental Microbiology, 18(9), 2937–2950. 10.1111/1462-2920.13124 [DOI] [PubMed] [Google Scholar]
- Mills, P. C. , Rowley, G. , Spiro, S. , Hinton, J. C. , & Richardson, D. J. (2008). A combination of cytochrome c nitrite reductase (NrfA) and flavorubredoxin (NorV) protects Salmonella enterica serovar Typhimurium against killing by NO in anoxic environments. Microbiology, 154(Pt 4), 1218–1228. 10.1099/mic.0.2007/014290-0 [DOI] [PubMed] [Google Scholar]
- Navarro‐Gonzalvez, J. A. , Garcıa‐Benayas, C. , & Arenas, J. (1998). Semiautomated measurement of nitrate in biological fluids. Clinical Chemistry, 44(3), 679–681. [PubMed] [Google Scholar]
- Ogilvie, B. , Rutter, M. , & Nedwell, D. (1997). Selection by temperature of nitrate‐reducing bacteria from estuarine sediments: Species composition and competition for nitrate. FEMS Microbiology Ecology, 23(1), 11–22. 10.1111/j.1574-6941.1997.tb00386.x [DOI] [Google Scholar]
- Reisenauer, H. (1966). Mineral nutrients in soil solution. Environmental Biology, 10(5), 507–508. [Google Scholar]
- Schmidt, C. S. , Richardson, D. J. , & Baggs, E. M. (2011). Constraining the conditions conducive to dissimilatory nitrate reduction to ammonium in temperate arable soils. Soil Biology and Biochemistry, 43(7), 1607–1611. 10.1016/j.soilbio.2011.02.015 [DOI] [Google Scholar]
- Schreier, H. J. , Brown, S. W. , Hirschi, K. D. , Nomellini, J. F. , & Sonenshein, A. L. (1989). Regulation of Bacillus subtilis glutamine synthetase gene expression by the product of the glnR gene. Journal of Molecular Biology, 210(1), 51–63. 10.1016/0022-2836(89)90290-8 [DOI] [PubMed] [Google Scholar]
- Silver, W. L. , Herman, D. J. , & Firestone, M. K. (2001). Dissimilatory nitrate reduction to ammonium in upland tropical forest soils. Ecology, 82(9), 2410–2416. 10.1890/0012-9658(2001)082[2410:DNRTAI]2.0.CO;2 [DOI] [Google Scholar]
- Silver, W. L. , Thompson, A. , Reich, A. , Ewel, J. J. , & Firestone, M. (2005). Nitrogen cycling in tropical plantation forests: Potential controls on nitrogen retention. Ecological Applications, 15(5), 1604–1614. 10.1890/04-1322 [DOI] [Google Scholar]
- Simon, J. (2002). Enzymology and bioenergetics of respiratory nitrite ammonification. FEMS Microbiology Reviews, 26(3), 285–309. 10.1111/j.1574-6976.2002.tb00616.x [DOI] [PubMed] [Google Scholar]
- Smith, M. S. (1981). Dissimilatory reduction of NO2 − to NH4 + and N2O by a soil Citrobacter sp. Applied and Environmental Microbiology, 43(4), 854–860. [DOI] [PMC free article] [PubMed] [Google Scholar]
- Smith, M. S. (1983). Nitrous oxide production by Escherichia coli is correlated with nitrate reductase activity. Applied and Environmental Microbiology, 45, 1545–1547. [DOI] [PMC free article] [PubMed] [Google Scholar]
- Smith, M. S. , & Zimmerman, K. (1981). Nitrous oxide production by nondenitrifying soil nitrate reducers. Soil Science Society of American Journal, 45(5), 865–871. 10.2136/sssaj1981.03615995004500050008x [DOI] [Google Scholar]
- Sneath, P. , Mair, N. S. , Sharpe, M. E. , & Holt, J. G. (1986). Bergey's manual of manual of systematic bacteriology, Vol. 2 Baltimore, USA: William & Wilkins. [Google Scholar]
- Solomon, S ., Qin, D. , Manning, M. , Chen, Z. , Marquis, M. , Averyt, K. B. , … Miller, H. L. (2007) Climate change 2007‐the physical science basis: Working group I contribution to the fourth assessment report of the IPCC. Cambridge, UK, and New York, USA: Cambridge University Press. [Google Scholar]
- Song, B. , Lisa, J. A. , & Tobias, C. R. (2014). Linking DNRA community structure and activity in a shallow lagoonal estuarine system’. Frontiers in Microbiology, 5, 460. doi: 10.3389/fmicb.2014.001460 [DOI] [PMC free article] [PubMed] [Google Scholar]
- Stanier, R. Y. , Palleroni, N. J. , & Doudoroff, M. (1966). The aerobic pseudomonads a taxonomic study. Journal of General Microbiology, 43(2), 159–271. 10.1099/00221287-43-2-159 [DOI] [PubMed] [Google Scholar]
- Stouthamer, A. (1976). Biochemistry and genetics of nitrate reductase in bacteria. Advances in Microbial Physiology, 14, 315–375. 10.1016/S0065-2911(08)60230-1 [DOI] [PubMed] [Google Scholar]
- Stremińska, M. A. , Felgate, H. , Rowley, G. , Richardson, D. J. , & Baggs, E. M. (2012). Nitrous oxide production in soil isolates of nitrate‐ammonifying bacteria. Environmental Microbiology Reports, 4(1), 66–71. 10.1111/j.1758-2229.2011.00302.x [DOI] [PubMed] [Google Scholar]
- Sun, Y. , De Vos, P. , & Heylen, K. (2016). Nitrous oxide emission by the non‐denitrifying, nitrate ammonifier Bacillus licheniformis . BMC Genomics, 17(1), 68 10.1186/s12864-016-2382-2 [DOI] [PMC free article] [PubMed] [Google Scholar]
- Sun, Y. , De Vos, P. , & Willems, A . (2017). Nitrogen assimilation in denitrifier Bacillus azotoformans LMG 9581T. [DOI] [PubMed]
- Torres, M. J. , Simon, J. , Rowley, G. , Bedmar, E. J. , Richardson, D. J. , Gates, A. J. , & Delgado, M. J. (2016). Nitrous oxide metabolism in nitrate‐reducing bacteria: Physiology and regulatory mechanisms. Advances in Microbial Physiology, 68, 353–432. 10.1016/bs.ampbs.2016.02.007 [DOI] [PubMed] [Google Scholar]
- Van den Berg, E. M. , Van Dongen, U. , Abbas, B. , & Van Loosdrecht, M. C. (2015). Enrichment of DNRA bacteria in a continuous culture. The ISME Journal, 9(10), 2153–2161. 10.1038/ismej.2015.26 [DOI] [PMC free article] [PubMed] [Google Scholar]
- Wang, H. N. , & Gunsalus, R. P. (2000). The nrfA and nirB nitrite reductase operons in Escherichia coli are expressed differently in response to nitrate than to nitrite. Journal of Bacteriology, 182, 5813–5822. 10.1128/JB.182.20.5813-5822.2000 [DOI] [PMC free article] [PubMed] [Google Scholar]
- Wolt, J. D . (1994). Soil solution chemistry: Applications to environmental science and agriculture. New York, USA: John Wiley and Sons. [Google Scholar]
- Wuebbles, D. J. (2009). Nitrous oxide: No laughing matter. Science, 326(5949), 56–57. 10.1126/science.1179571 [DOI] [PubMed] [Google Scholar]
- Yang, X. , Wang, S. , & Zhou, L. (2012). Effect of carbon source, C/N ratio, nitrate and dissolved oxygen concentration on nitrite and ammonium production from denitrification process by Pseudomonas stutzeri D6. Bioresource Technology, 104, 65–72. 10.1016/j.biortech.2011.10.026 [DOI] [PubMed] [Google Scholar]
- Yin, G. , Hou, L. , Liu, M. , Li, X. , Zheng, Y. , Gao, J. , … Lin, X. (2017). DNRA in intertidal sediments of the Yangtze Estuary. Journal of Geophysical Research: Biogeosciences, 122(8), 1988–1998. [Google Scholar]
- Yoon, S. H. , Cruz‐Garcia, C. , Sanford, R. A. , Ritalahti, K. M. , & Löffler, F. E. (2015). Denitrification versus respiratory ammonification: Environmental controls of two competing dissimilatory NO3 −/NO2 − reduction pathways in Shewanella loihica strain PV‐4. The ISME Journal, 9(2014), 1–12. [DOI] [PMC free article] [PubMed] [Google Scholar]
- Yoon, S. , Sanford, R. A. , & Loeffler, F. E. (2015). Nitrite control over dissimilatory nitrate/nitrite reduction pathways in Shewanella loihica strain PV‐4. Applied and Environmental Microbiology, 81(10), 3510–3517. 10.1128/AEM.00688-15 [DOI] [PMC free article] [PubMed] [Google Scholar]