Abstract
Oxidation of proteins by reactive oxygen species is associated with aging, oxidative stress, and many diseases. Although free and protein-bound methionine residues are particularly sensitive to oxidation to methionine sulfoxide derivatives, these oxidations are readily repaired by the action of methionine sulfoxide reductase (MsrA). To gain a better understanding of the biological roles of MsrA in metabolism, we have created a strain of mouse that lacks the MsrA gene. Compared with the wild type, this mutant: (i) exhibits enhanced sensitivity to oxidative stress (exposure to 100% oxygen); (ii) has a shorter lifespan under both normal and hyperoxic conditions; (iii) develops an atypical (tip-toe) walking pattern after 6 months of age; (iv) accumulates higher tissue levels of oxidized protein (carbonyl derivatives) under oxidative stress; and (v) is less able to up-regulate expression of thioredoxin reductase under oxidative stress. It thus seems that MsrA may play an important role in aging and neurological disorders.
Protein-bound methionine residues are among the most susceptible to oxidation by reactive oxygen species (ROS), resulting in formation of methionine sulfoxide [Met(O)] residues. However, this modification can be repaired by methionine sulfoxide reductase (MsrA), which catalyzes the thioredoxin-dependent reduction of free and protein-bound Met(O) to methionine, both in vitro (1) and in vivo (2). Bacteria and yeast cells lacking the msrA gene show increased sensitivity to oxidative stress and lower survival rates (3, 4), with yeast showing accumulation of high levels of both free and protein-bound Met(O) (2, 4). In addition, overexpression of the MsrA enzyme in human T cells prolongs their life under conditions of oxidative stress (4). Because methionine residues are particularly susceptible to oxidation by ROS, MsrA could have at least three important functions in cellular metabolism: (i) as an antioxidant enzyme that scavenges ROS by facilitating the cyclic interconversion of methionine/protein-methionine residues between oxidized and reduced forms (2); (ii) as a repair enzyme by keeping critical methionine residues in their reduced form; and (iii) as a regulator of critical enzyme activity through cyclic interconversion of specific methionine residues between oxidized and reduced forms (5, 6). Escherichia coli and Saccharomyces cerevisiae both contain at least two Msrs. One (MsrA) is able to reduce both free and protein-bound Met(O), and the other can reduce only free Met(O). The MsrA protein is highly expressed in liver, kidney, pigment epithelial cells of the retina, macrophages, cerebellum, and brain neurons (7). These tissues/cells are sensitive to oxidative stress damages. Therefore, abolishing the MsrA enzyme could lead to loss of antioxidant defense, resulting in enhanced oxidative damage and a decreased lifespan. To investigate the possible role of MsrA as an antioxidant in mammals and its possible influence on lifespan, we created a strain of mouse lacking the MsrA protein.
Materials and Methods
Materials.
Human thioredoxin was purchased from Sigma. Rat thioredoxin reductase (TR), anti-rat TR polyclonal antibodies, and the anti-human thioredoxin (Trx) polyclonal antibodies (cross-reacting with the mouse homologues) were a gift from S. Rhee (National Institutes of Health/National Heart, Lung, and Blood Institute, Bethesda).
Gene Targeting Construct.
The targeting vector was designed to abolish the coding sequence in exon 2 (harboring the active site of the MsrA protein; ref. 8) and replace it with a neomycin-resistance gene for selection of transfected embryonic stem (ES) cells. The targeting vector was constructed by using a 13.3-kb EcoRI–HindIII genomic fragment from an ≈40-kb 129 mouse cosmid. The 5′ arm of the construct, encompassing the 3.6-kb KpnI–PstI fragment, was subcloned in pGTN28 and was originated from a 7.2-kb EcoRI genomic fragment subcloned in pBSIIKS+ (Stratagene). The downstream fragment consisted of a 1.8-kb neomycin cassette, which replaced the1.6-kb PstI fragment harboring exon 2 (amino acids 69–109 of the protein containing the active site). The 3′ arm of the construct, encompassing the 4.8-kb PvuII fragment, was subcloned downstream to the neomycin cassette in 5′-to-3′ orientation.
The resulting targeting vector had 3.6-kb 5′ homology, 4.8-kb homology, and 1.8-kb mutated segment. The vector was linearized with NotI for transfection.
ES Cell Culture and Gene Targeting.
We performed gene targeting in the ES cell line E14.5 RW4, which is derived from mouse 129/SvJ blastocysts. Cells were cultured on feeder layers of murine embryonic fibroblasts in the presence of 1,000 units of leukocyte inhibitory factor per milliliter supplemented with 10% FCS, 1× DMEM nonessential amino acids, and 50 μM 2mercaptoethanol. ES cells (107 cells) were transfected with 10 μg of the targeting vector and selected on medium containing G418 (0.5 mg/ml). Correctly targeted clones were identified by Southern blot analysis. For targeting at 3′ end, ES-cell DNA was digested with EcoRV and the blots were probed with a 0.8-kb HindIII–PvuII fragment. The 20-kb wild-type (WT) band was replaced in targeted clones by a 7.4-kb band from the mutated allele. The same was checked for the 5′ end by using EcoRI- and BamHI-digested DNA, which was probed with a 0.8-kb PstI–KpnI fragment. The WT allele gave a 7.2-kb band, and the targeted gene gave a 5.6-kb band.
Production of Mutant Mice.
Mice lacking the MsrA gene (MsrA−/−) were prepared by a common procedure as described here. C57BL/6J blastocysts were microinjected with 10–12 ES cells containing the desired mutation. Blastocytes were implanted into pseudopregnant females to obtain chimeric progeny. Chimeras were mated with C57BL/6J mice, and the mutated allele was transmitted through the germ line to yield F1 heterozygous animals, which were crossed to produce F2 animals. The line was maintained in the homo/hemizygous state.
Hyperoxia Experiments.
The WT and MsrA−/− mice were housed in a sealed chamber containing an atmosphere of 100% oxygen. Animals were maintained under a 12 h light–12 h dark cycle and given food and water ad libitum. All mouse experiments were conducted according to guidelines of the National Heart, Lung, and Blood Institute animal care and use committee.
MsrA and TR Activities.
MsrA activity was measured by using 3 μg of recombinant human Trx, 3 μg of purified rat TR, 500 μM NADPH, 200 μM 4-dimethylaminoazobenzene-4′-sulfonyl (Dabsyl)-Met(O) [represents protein-bound Met(O)], and tissue extract supernatant in 100 μl of 50 mM Tris⋅HCl, pH 7.5, for 30 min at 37°C. Separation and quantitation of the products was performed by using an HPLC method, as described (2). Free Met(O) reduction was measured by using the reaction mixture and conditions as above, in which the Dabsyl-Met(O) was replaced with [3H]Met(O) (1 mCi/μmol; 1 mCi = 37 MBq). Then the products were separated and quantitated on TLC plates, as described (2). TR activity was measured according to the procedure described in ref. 9.
Measuring Mouse “Tip-Toe” Walking.
Walking pattern was documented in both mouse strains by dipping foot pads of the hind feet into India ink and allowing the animal to walk on paper strips.
Statistical Analysis.
P values for all relevant experimental data were calculated by using the unpaired t test.
Results
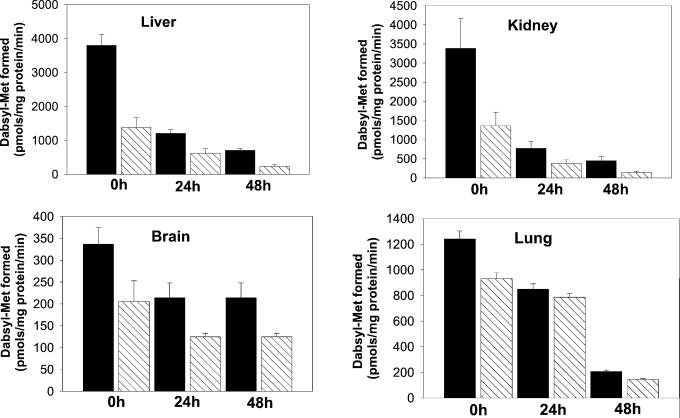
Although MsrA was highly expressed in the kidney and liver of WT mice, it was undetectable in tissues of MsrA−/− mutants (Fig. 1). However, in contrast to E. coli and S. cerevisiae, where all Msr activity is due to MsrA, the absence of MsrA in mice revealed the presence of another form of Msr, which we refer to as MsrB (Fig. 2). The MsrB activity in tissues of the MsrA−/− strain was highly variable. In kidney and liver it was equal to about 35% of the total Msr WT levels, but in brain and lung tissues it was equal to about 75% of the total Msr WT levels (Fig. 2, zero time values).
Figure 1.
Analysis of expression of MsrA in WT and MsrA−/− mice. Western blot analysis with anti-MsrA antibodies: 1, WT liver; 2, WT kidney; 3, MsrA−/− liver; and 4, MsA−/− kidney.
Figure 2.
Msr activities in various tissues from WT and MsrA−/− mice. 0h, 24h, and 48h represent activities at different time points (hours) under hyperoxia. Each time point represents five animals. Black bars represent WT; hatched bars represent MsrA−/−.
Effects of Oxidative Stress.
Msr activity.
To determine whether the loss of MsrA activity has an effect on the sensitivity to oxidative stress, we exposed the mutant and WT strains to a 100% oxygen atmosphere (hyperoxia) and after various periods measured the level of oxidized protein (carbonyl derivatives) and the activities of Msr, Trx, and TR. As illustrated in Fig. 2, the Msr activities in kidney, liver, and lung tissues of both WT and mutant strains decreased progressively with time of hyperoxia, and after 48 h attained values that were only 12–14% of the initial values. The loss of Msr activity in brain was less severe, reaching a steady-state level of 62% of the initial value after 24 h of hyperoxia. Nevertheless, at each time point, the fraction of initial Msr activity that was lost in any of the WT tissues was the same as that observed in the corresponding tissue of the mutant strain (Fig. 2).
Protein carbonyls.
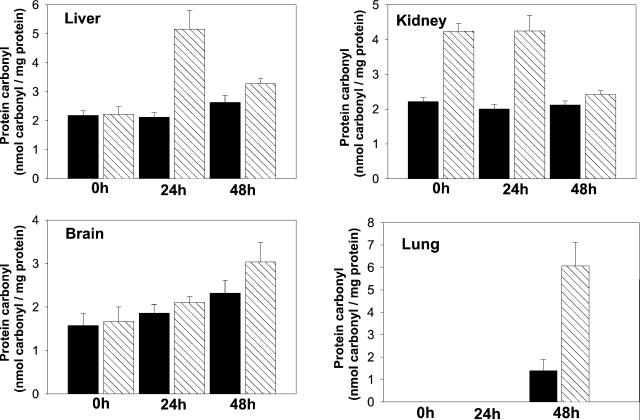
Under various conditions of oxidative stress, some amino acid residues of proteins are converted to carbonyl derivatives. Accordingly, the level of protein carbonyls is generally accepted as a marker of oxidative stress. Under normoxia (air atmosphere), only the kidneys from MsrA−/− mice had higher levels (2-fold) of carbonylated protein than WT, but after 24 h of hyperoxia, there was an ≈2-fold increase also in the protein carbonyl content in liver from the mutant strain as compared with that of the WT (Fig. 3). Then, upon longer exposure (48 h) to hyperoxia, the levels of protein carbonyls in both liver and kidney of the mutant strain returned to levels similar to those of the WT normoxia level (Fig. 3). Similar time-dependent changes were noted previously in rats, where a transient hyperoxic-induced increase was followed by a decrease in protein carbonyl formation. This change was attributed to a time-dependent elevation in the rate of oxidized protein degradation under these conditions (10). In contrast, the levels of oxidized protein in brains of both WT and mutant mice increased in parallel during 48 h of hyperoxia, whereas in lung no protein carbonyl could be detected until 48 h of hypoxia, at which time the level in the lungs of the mutant strain was 3–4 times that of the WT animals (Fig. 3). Oxidation of proline and arginine residues of proteins to glutamic semialdehyde represents a major mechanism for ROS-mediated protein oxidation (11), but the increase in protein carbonyls observed in these studies was not associated with formation of glutamic semialdehyde (data not shown).
Figure 3.
Protein-carbonyl levels in various tissues from WT and MsrA−/− mice. Carbonyl levels were determined as previously described (10, 11). 0h, 24h, and 48h represent the carbonyl levels at different time points (hours) under hyperoxia. Each time point represents five animals. Black bars represent WT; hatched bars represent MsrA−/−.
Trx/TR levels.
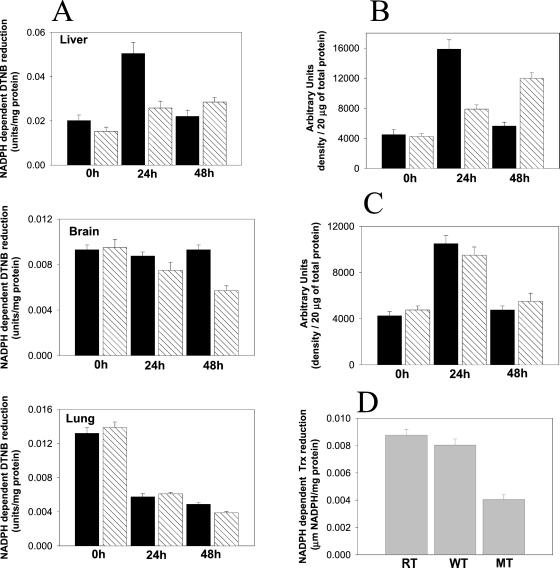
Under normoxic conditions, the levels of TR in both WT and mutant strains were about the same (Fig. 4, zero time values). However, the responses of TR levels to hyperoxia in the two strains were quite different and depended also on the tissue examined (Fig. 4A). In WT liver, the level of TR increased almost 3-fold during the first 24 h of hyperoxia and then declined to near normoxia levels after 48 h. In contrast, the TR in liver of the mutant increased nearly 2-fold during 48 h of hyperoxia. However, hyperoxia had little or no effect on the level of TR in WT brain, but led to a 40% decrease of TR in the mutant brain, whereas hyperoxia led to a 60% loss of TR in the lungs of both WT and mutant strains (Fig. 4A). These changes in TR activity reflect changes in the level of enzyme expression, as shown in Fig. 4B. Similar results were obtained with kidneys from both strains, under the same conditions (data not shown). Of significance is the finding that Trx expression in livers from both WT and MsrA−/− mice was similarly enhanced (2-fold) after 24 h of hyperoxia (Fig. 4C). These enhancements of expression are supported by previous studies in cultured cells exposed to oxidative stress and in lungs of newborn primates (12, 13). To determine whether the TR expression is similarly regulated in eukaryotes, we examined the effect of msrA null mutation on TR activity in S. cerevisiae. The TR activity in both WT and a revertant of the yeast msrA null mutant was 2- to 3-fold higher than in the MT (Fig. 4D).
Figure 4.
TR activities and expression in various tissues from WT and MsrA−/− mice and in S. cerevisiae. (A) Liver, brain, and lung; 0h, 24h, and 48h represent activities at different time points (hours) under hyperoxia. Each time point represents five animals. Black bars represent WT; hatched bars represent MsrA−/−. (B) TR level of expression as determined by densitometry analysis of Western blot with anti-TR antibodies probing liver tissues under conditions described for A. Black bars represent WT; hatched bars represent MsrA−/−. (C) Trx expression as determined by densitometry analysis of Western blot with anti-Trx antibodies probing liver tissues under conditions described for A. Black bars represent WT; hatched bars represent MsrA−/−. (D) TR activity in S. cerevisiae: MT, msrA null mutant; RT, reverent of MT. All TR activities were assayed as described (9) and were Trx dependent.
Free Methionine Sulfoxide Reductase (FMsr).
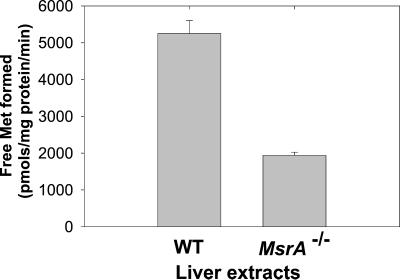
Disruption of the msrA gene led to a 63% loss of FMsr activity (Fig. 5), suggesting that mammalian MsrA, like the enzyme from yeast and E. coli (2, 3), possesses FMsr activity. Whether the residual FMsr activity observed in the mutant reflects another activity of MsrB, or is due to the presence of a separate form that is specific for free Met(O) (as occurs in E. coli and yeast; refs. 2 and 3), remains to be established.
Figure 5.
FMsr activity in liver extracts from WT and MsrA−/− mice. Activity was measured according to the procedure described in the text.
Oxidative Stress and Lifespan.
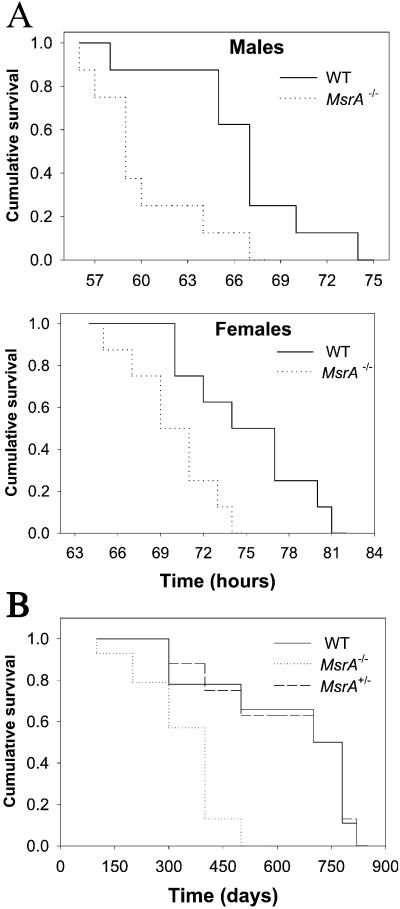
To examine the ability of MsrA−/− and WT mice to resist oxidative stress in vivo, animals were exposed to hyperoxia, and their lifespans were determined. Comparison of survival curves by the Kaplan and Meier method (14) (Fig. 6A) showed a highly significant difference between the two groups (P = 0.0001), with median survivals of 77.4 ± 9.6 h (WT females), 70.6 ± 2.9 h (MsrA−/− females), 68 ± 4.6 h (WT males), and 61.2 ± 5.6 h (MsrA−/− males). Thus, the lifespan of MsrA−/− mice was ≈10% shorter than that of the WT (P = 0.0001). The lifespan of the females was longer than that of the male mice in both animal groups (Fig. 6A). In view of these results, we examined the effect of the MsrA mutation on the lifespan of mice under normoxia. From MsrA+/− heterozygous parents, 39 mice were born: 14 WT, 8 MsrA+/−, and 17 MsrA−/−, which were kept under identical sterile conditions. After 23 months, all MsrA−/− mice had died, and 6 of 8 heterozygous (75%) and 11 of 14 WT mice (79%) remained alive. Comparison of survival curves by the Kaplan and Meier method showed a highly significant difference between the two groups (WT and heterozygous vs. MsrA−/−) (P = 0.0005), with mean survivals of 680 ± 71 days (WT), 672 ± 80 days (MsrA+/−), and 409 ± 33 days (MsrA−/−) (Fig. 6B). Comparison of survival curves of WT and heterozygous vs. MsrA−/− mice showed ≈40% decrease in lifespan of MsrA−/− mice (P = 0.0006). Other studies have shown that diet restriction leads to a decrease in the level of oxidative stress and extends the maximum lifespan (15, 16). In our studies, no statistically significant differences were found in body weight or food consumption between strains, and no histopathological differences were apparent between groups after death.
Figure 6.
Decreased resistance to oxidative stress and shorter lifespan of MsrA−/−. (A) 16 WT and 16 MsrA−/− mice (4.5 months of age) were exposed to 100% oxygen (hyperoxia). (B) Shorter lifespan of MsrA−/− mice exposed to 20% oxygen (normoxia). Data were analyzed by using the cumulative survival (Kaplan and Meier method; ref. 14) of WT, MsrA−/−, and MsrA+/− mice.
Tip-Toe Walking.
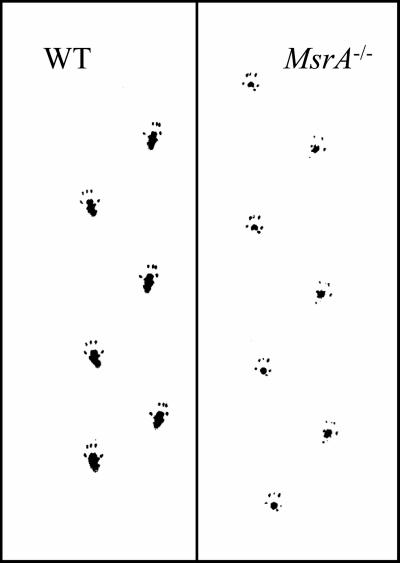
It was noticed that mutant mice walked on the tips of their toes starting at 6 months of age, whereas WT did not show this kind of behavior at the same ages tested for mutants (Fig. 7).
Figure 7.
MsrA-disrupted mice demonstrate behavioral abnormality (tip-toe walking) consistent with cerebellar dysfunction. Representative footprint patterns from WT and MsrA−/− mice are shown.
Discussion
Disruption of the mouse MsrA gene revealed the presence of another form of Msr, which we refer to as MsrB. Whether the presence of MsrB reflects up-regulation or unmasking of a previously unrecognized form of Msr remains to be determined. The MsrB activities of the liver and kidney and of the brain and lung tissues of the MsrA−/− mutant were equal to only 35% and 75%, respectively, of the total Msr activity of these tissues in the WT (Fig. 2, zero time points). The possibility that loss in antioxidant capacity is associated with the decrease in total Msr activities (Figs. 2 and 5), and therefore renders these tissues more susceptible to oxidative stress, is consistent with the observation that hyperoxia (exposure to 100% O2 atmosphere) induced a greater increase in the levels of oxidized protein (protein carbonyls) in tissues of the MsrA−/− mutant than in the WT (Fig. 3). Evidence supporting the possibility that MsrA may play an important role as an antioxidant in mammals comes from reports showing that reduction in MsrA activity occurs in very old rats (17) and in the brains of patients with Alzheimer's disease, which consequently leads to accumulation of carbonyl adducts in proteins (18). This phenomenon suggests that disruption of both MsrA and MsrB genes in mice should increase their vulnerability to oxidative stress even more. The patterns of protein carbonylation elicited by hyperoxia were strongly tissue dependent and differed between MsrA−/− and WT in most cases (Fig. 3). These differences could reflect tissue-specific variations in the rates of ROS generation, antioxidant levels, capacity to degrade oxidized proteins, or the ability to up-regulate one or more of these processes under conditions of oxidative stress. Therefore, it is suggested that MsrA may play an important role in signal transduction. This possibility is highlighted by the observation that during hyperoxia the patterns of TR expression in liver (Fig. 4 A and B), kidney (data not shown), and brain of MsrA−/− (Fig. 4A) were quite variable and different from those observed with the WT (Fig. 4 A and B). Such a possibility is consistent also with the demonstration that loss of MsrA led to a decrease in the TR activity in the msrA null mutant of yeast (Fig. 4D). The finding that Trx expression in livers from both WT and MsrA−/− mice was similarly enhanced after 24 h of hyperoxia (Fig. 4C) suggests that the induction of Trx is not linked directly to MsrA expression but is important for the function of various reduction systems, including Met(O) reduction. Taken together, these findings suggest that failure of MsrA−/− mice to induce simultaneous expression of TR and Trx, under hyperoxia, sensitizes them to protein damage by ROS. These results emphasize the need for further studies to determine whether the MsrA-dependent regulation of TR expression involves direct interaction of MsrA protein with cell-signaling components. Alternatively, these results may reflect MsrA-dependent changes in the level of ROS species or their reaction products that are involved in the regulation of TR cell-signaling pathways.
The observation that disruption of the MsrA gene led to comparable losses (≈65%) of both MsrA and FMsr activities suggests that the mouse MsrA possesses both MsrA and FMsr activities, as do the bovine, yeast, and bacterial MsrAs (1, 2). However, further studies are needed to determine whether the lower level of FMsr in the MsrA−/− strain is a property of MsrB, or is due to a separate FMsr enzyme as in E. coli and S. cerevisiae (2, 3).
Elimination of the MsrA gene led to 10% and 40% decrease in the maximum lifespans of mice under hyperoxia and normoxia, respectively (Fig. 6). Similar decreases in survival rates were observed for msrA null mutants of E. coli and S. cerevisiae (3, 4). These results highlight the ability to cause life extension in mice overexpressing the MsrA protein, under both hyperoxic and normoxic conditions. This possibility is supported by our previous study showing that overexpressing bovine MsrA in human T cells increased their lifespan under conditions of oxidative stress (4).
Earlier studies have shown that an increase in resistance to stress conditions, including oxidative stress, leads to increase in the lifespan of various organisms, including S. cerevisiae (19, 20), Caenorhabditis elegans (21, 22), Drosophila melanogaster (23), and mouse (24). Only a few reports, in nonmammalian organisms [(C. elegans (Mev-1) and Drosophila (catalase or superoxide dismutase)], describe hypersensitivity to oxidative stress leading to shortened lifespan (25, 26). To our knowledge, we are the first to demonstrate that loss of a single gene can significantly elevate cellular oxidative stress, and reduce the lifespan in mammals.
A phenotypic difference between the MsrA−/− and WT mice was apparent in walking behavior. Starting at about 6 months of age, the mutant mice began to walk on their toes (tip-toe walking) (Fig. 7). Except for this difference, no other symptoms of ataxia were apparent. Motor dysfunctions, such as ataxia, are attributed to cerebellar-based abnormalities, and have been correlated with enhanced sensitivity to oxidative stress (27). Because MsrA is highly expressed in the cerebellum and brain neurons (7), the loss of this activity in the brain could lead to enhanced protein-bound methionine oxidation and thus to defects in neuronal function, as observed for the regulation of potassium channel activity (5).
In summary, we have demonstrated that compared with WT, mice lacking the MsrA gene exhibit heightened sensitivity to oxidative stress, have a shortened lifespan under both normoxia and hyperoxia, develop abnormal walking behavior, and exhibit altered patterns of TR expression in response to hyperoxia. Further studies are necessary to elucidate the basic mechanisms in which MsrA and MsrB contribute to these observations.
Acknowledgments
We are grateful to Mr. Santana Flores for technical support and Genome Systems Inc. (St. Louis) for assistance with the creation of the MsrA−/− mouse.
Abbreviations
- ROS
reactive oxygen species
- Met(O)
methionine sulfoxide
- Msr
methionine sulfoxide reductase
- FMsr
free methionine sulfoxide reductase
- TR
thioredoxin reductase
- Trx
thioredoxin
- WT
wild type
- Dabsyl
4-dimethylaminoazobenzene-4′-sulfonyl
References
- 1.Moskovitz J, Weissbach H, Brot N. Proc Natl Acad Sci USA. 1996;93:2095–2099. doi: 10.1073/pnas.93.5.2095. [DOI] [PMC free article] [PubMed] [Google Scholar]
- 2.Moskovitz J, Berlett S B, Poston M, Stadtman E R. Proc Natl Acad Sci USA. 1997;94:9585–9589. doi: 10.1073/pnas.94.18.9585. [DOI] [PMC free article] [PubMed] [Google Scholar]
- 3.Moskovitz J, Rahman M A, Strassman J, Yancey S O, Kushner S R, Brot N, Weissbach H. J Bacteriol. 1995;177:502–507. doi: 10.1128/jb.177.3.502-507.1995. [DOI] [PMC free article] [PubMed] [Google Scholar]
- 4.Moskovitz J, Flescher E, Berlett S B, Azare J A, Poston M, Stadtman E R. Proc Natl Acad Sci USA. 1998;95:14071–14075. doi: 10.1073/pnas.95.24.14071. [DOI] [PMC free article] [PubMed] [Google Scholar]
- 5.Cibora M A, Heinemann S H, Weissbach H, Brot N, Hoshi T. Proc Natl Acad Sci USA. 1997;94:9932–9937. doi: 10.1073/pnas.94.18.9932. [DOI] [PMC free article] [PubMed] [Google Scholar]
- 6.Gao J, Yao Y, Squier T C. Biophys J. 2001;80:1791–1801. doi: 10.1016/S0006-3495(01)76149-8. [DOI] [PMC free article] [PubMed] [Google Scholar]
- 7.Moskovitz J, Jenkins N A, Gilbert D J, Copeland N G, Frantisek J, Weissbach H, Brot N. Proc Natl Acad Sci USA. 1996;93:3205–3208. doi: 10.1073/pnas.93.8.3205. [DOI] [PMC free article] [PubMed] [Google Scholar]
- 8.Moskovitz J, Poston M, Berlett B S, Nosworthy J N, Szczepanowski R, Stadtman E R. J Biol Chem. 2000;275:14167–14172. doi: 10.1074/jbc.275.19.14167. [DOI] [PubMed] [Google Scholar]
- 9.Lee S R, Bar-Noy S, Kwon J, Levine R L, Stadtman T C, Rhee S G. Proc Natl Acad Sci USA. 2000;97:2521–2526. doi: 10.1073/pnas.050579797. . (First Published February 25, 2000; 10.1073/pnas.050579797) [DOI] [PMC free article] [PubMed] [Google Scholar]
- 10.Starke-Reed P E, Oliver C N. Arch Biochem Biophys. 1989;275:559–567. doi: 10.1016/0003-9861(89)90402-5. [DOI] [PubMed] [Google Scholar]
- 11.Requena J R, Chao C C, Levine R L, Stadtman E R. Proc Natl Acad Sci USA. 2001;98:69–74. doi: 10.1073/pnas.011526698. . (First Published December 19, 2000; 10.1073/pnas.011526698) [DOI] [PMC free article] [PubMed] [Google Scholar]
- 12.Sun X, Dobra K, Bjornstedt M, Hjerpe A. Differentiation (Berlin) 2000;66:181–188. doi: 10.1046/j.1432-0436.2000.660404.x. [DOI] [PubMed] [Google Scholar]
- 13.Das K C, Guo X-L, White C W. Am J Physiol. 1999;276:L530–L539. doi: 10.1152/ajplung.1999.276.3.L530. [DOI] [PubMed] [Google Scholar]
- 14.Marubini E, Valsecchi M G. Analysis of Survival Data from Clinical Trials and Observational Studies. New York: Wiley; 1995. [Google Scholar]
- 15.Weindruch R, Walford R L, Fligiel S, Guthrie D. J Nutr. 1986;116:641–654. doi: 10.1093/jn/116.4.641. [DOI] [PubMed] [Google Scholar]
- 16.Sohal R S, Weindruch R. Science. 1996;273:59–63. doi: 10.1126/science.273.5271.59. . . [DOI] [PMC free article] [PubMed] [Google Scholar]
- 17.Petropoulos I, Mary J, Perichon M, Friguet B. Biochem J. 2001;355:819–825. doi: 10.1042/bj3550819. [DOI] [PMC free article] [PubMed] [Google Scholar]
- 18.Gabbita S P, Aksenov M Y, Lovell M A, Markesbery W R. J Neurochem. 1999;73:1660–1666. doi: 10.1046/j.1471-4159.1999.0731660.x. [DOI] [PubMed] [Google Scholar]
- 19.Sun J, Childress A M, Pinswasdl C, Jazwinski S. J Biol Chem. 1994;273:22528–22536. [Google Scholar]
- 20.Kennedy B K, Austriaco N R, Zhang J, Garente L. Cell. 1995;80:485–496. doi: 10.1016/0092-8674(95)90499-9. [DOI] [PubMed] [Google Scholar]
- 21.Murakami S, Johnson T E. Genetics. 1996;143:1207–1218. doi: 10.1093/genetics/143.3.1207. [DOI] [PMC free article] [PubMed] [Google Scholar]
- 22.Larsen P L, Albert P S, Riddle D L. Genetics. 1995;139:1576–1583. doi: 10.1093/genetics/139.4.1567. [DOI] [PMC free article] [PubMed] [Google Scholar]
- 23.Service P M, Hutchinson E W, Mackinley M D, Rose M R. Physiol Zool. 1985;58:380–389. [Google Scholar]
- 24.Migliaccio E, Giorgio M, Mele S, Pelicci G, Reboldi P, Pandolfi P P. Nature (London) 1999;402:309–313. doi: 10.1038/46311. [DOI] [PubMed] [Google Scholar]
- 25.Ishii N, Fujii M, Hartman P S, Tsuda M, Yasuda K, Senoo-Matsuda N, Yanase S, Ayusawa D, Suzuki K. Nature (London) 1998;394:694–697. doi: 10.1038/29331. [DOI] [PubMed] [Google Scholar]
- 26.Orr W C, Sohal R S. Science. 1994;263:1128–1130. doi: 10.1126/science.8108730. [DOI] [PubMed] [Google Scholar]
- 27.Sedgewick R, Boder E. In: Handbook of Clinical Neurology. Sedgewick R, Boder E, Klawans H L, editors. Vol. 60. New York: Elsevier; 1991. pp. 347–423. [Google Scholar]


