Abstract
We propose a new model to characterize the phase noise in swept-source optical coherence tomography (SS-OCT). The new model explicitly incorporates scanning variability, timing jitter, and sample location in addition to intensity noise (shot noise). The model was analyzed and validated by using both Monte Carlo methods and experiments. We suggest that the proposed model can be used as a guideline for future SS-OCT experimental designs.
OCIS codes: (110.4500) Optical coherence tomography, (120.3180) Interferometry, (000.4430) Numerical approximation and analysis, (110.0180) Microscopy, (180.3170) Interference microscopy, (110.4280) Noise in imaging systems
There are several mathematical models to theoretically describe and analyze the phase noise of Fourier-domain optical coherence tomography (FD-OCT) systems. Park et al., proposed a phasor picture to understand the composition of the phase noise in spectral-domain OCT (SD-OCT): the noise was modeled as a vector orthogonal to the signal vector with a random magnitude [1]. Choma et al., proposed a similar model [2] and further reframed it as a constant phasor plus additive white Gaussian noise (AWGN) problem: the noise was considered as a phasor with a constant magnitude but with a uniformly distributed random angle [3]. Szkulmowski et al., on the other hand, modeled the same problem as a constant phasor plus a sum of random phasors [4]. Despite the differences among these models, similar conclusions were drawn: the phase stability (sensitivity) of the FD-OCT measurement was found inversely proportional to the square root of the system’s signal-to-noise ratio (SNR) if the system was shot noise limited [1–4]. In addition to the aforementioned studies based on SD-OCT, Vakoc et al., discussed the impact of the timing jitter on the phase performance of swept-source optical coherence tomography (SS-OCT) [5], and they reached a similar conclusion that the phase stability of SS-OCT was also SNR limited.
Currently, phase-resolved OCT or related phase-sensitive techniques relies on the previously mentioned frameworks to predict the system’s phase stability. Although the models generally fit the measurements in SD-OCT systems, their effectiveness was contested in SS-OCT platforms: the measured phase stability in SS-OCT could be orders of magnitude worse than the predictions [6,7]. In this Letter, we propose a modified phase noise model to incorporate two important factors that are unique to SS-OCT’s phase stability: the “scanning variability” and the “timing jitter.” The proposed model suggests that the phase stability of the SS-OCT, which is collectively determined by the newly introduced factors and the optical path length (OPL) between the reference mirror and the sample, is only linear with up to a certain level. Beyond the threshold, the system’s phase stability becomes saturated as the SNR further increases. We verified our model on a custom-built SS-OCT system, and it succeeded in fitting the experimental data with high accuracy.
The detected interference signal I(k) of single sample reflector from a typical FD-OCT system can be written as [8]
| (1) |
where S (k) is the power spectrum of the light source, k is the wavenumber, ρ is the responsivity of the photodetector, zd is the displacement from the sample reflector to the reference mirror, N(k) is the noise presented, and RR and RS are the reflectivity of the reference mirror and the sample reflector, respectively. Here we assume the noise is an AWGN, which is valid in a shot-noise-limited scenario [1,2].
After being uniformly discretized M times in the k domain, the detected signal I (k) could be written as
| (2) |
where m is the index of the spectral sampling point, k′ is the sampling interval in the k domain, , and B[m]=ρN[m]/4. Without losing generality, we assumed A[m] to be a constant number A. We then performed an M-point inverse discrete Fourier transform on Eq. (2) against m as
| (3) |
where b is a constant since B[m] is AWGN. The noise phase angle ϕ could be modeled by a uniform distribution over (−π, π]. In OCT, we are only interested in the positive “frequency” portion of Eq. (3). Notice that zd could be further decomposed into two parts: zN as the peak amplitude location of i[n = N], and δz as the subaxial-sampling-interval displacement. Without considering the noise corruption at this moment, we could rewrite the phase angle β of the positive “frequency” components at the peak amplitude location n = (k′zNM)/π as
| (4) |
If the sample only presents subaxial-sampling-interval movement, the first term of Eq. (4) could be assumed constant during the imaging process. Then, a faithful demodulation of δz in the second term will rely on the condition that both coefficients, k[0] and k′, be constant. In SD-OCT, where the interferogram is measured by a spectrometer, this condition generally holds.
However, it is not guaranteed in SS-OCT. First, the output spectrum of the wavelength swept laser source could vary from scan to scan, as illustrated in Fig. 1(a), due to the mechanical or electrical scanning. The deviation could be characterized by a random variable δk[m], and we call it “scanning variability.” Without losing generality, we assume that all δk[m](m = 0, 1, 2, …, M – 1) follow the same normal distribution, δk, with a zero mean and a standard deviation of σδk. This assumption makes both terms, k[0]and k′, in Eq. (4) random variables rather than constants in SS-OCT. We acknowledge that various techniques have been proposed to reduce this effect [9,10]. For example, Gora et al., suggested to simultaneously record a reference signal to recalibrate the sample signal [10]. However, we do not believe this “scanning variability” could be completely eliminated and we keep this parameter for the completeness of the study.
Fig. 1.
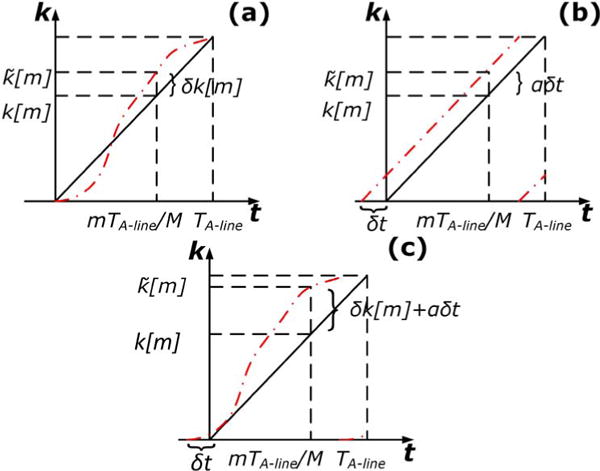
Effect of (a) scanning variability, (b) timing jitter, and (c) both on the scanning curve of SS-OCT. represents the actual output wavenumber from the light source. The solid lines represent the ideal scanning curve, while the dashed lines stand for the actual measurements.
Second, a timing jitter exists in SS-OCT, as shown in Fig. 1(b), due to the imperfect synchronization between the light source and the data acquisition (DAQ) board, the limited sampling rate of the DAQ, and the noise in the trigger signal. Since the timing jitter from the imperfect synchronization could be greatly suppressed by various methods [11,12], we focus on the jitter caused by the limited sampling rate and the trigger noise in this Letter, which inherently stems from the temporal measurement nature of SS-OCT. We then model the timing jitter as another random variable δt that is linearly proportional to TDAQ, the sampling interval of the DAQ. Based on our assumption, a slower DAQ will lead to a larger timing jitter and a faster DAQ will result in a smaller timing jitter. Assume δt also follows a zero-mean normal distribution, and its standard deviation is written as σδt = lTDAQ. The standard deviation is determined by a coefficient l and the sampling interval of the DAQ. The impact of the introduction of δt on the measured wavenumber k is translated via the scanning speed of the light source α = (k[M – 1] – k[0])/TA-line. Here, TA-line is the A-line scanning period of the light source. Equation (4) could thus be written as
| (5) |
The first term in Eq. (5) corresponds to the structural information that is readily available in OCT; the second term represents the subaxial-sampling-interval phase term that techniques such as phase-resolved OCT intend to decouple; the third term is the phase modulation introduced by both the timing jitter and the scanning variability. The rest of the terms are considered higher order infinitesimals that could be ignored.
A schematic of phasor interpretation of Eq. (5) is given in Fig. 2. The phase angle β0 of the original signal A is given by the second term of Eq. (5). The inclusion of the third term effectively rotates the phase angle of A by δβ. After the rotation, the phasor A′0 is further added by the random noise phasor B, and the final resultant phasor I has a phase angle of ψ.
Fig. 2.
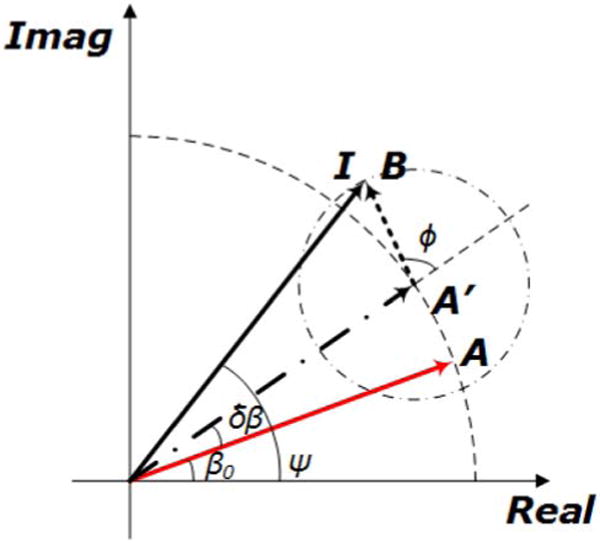
Phasor depiction of the proposed model. The original signal is denoted by A with a phase angle of β0. A is first rotated by δβ due to the presence of the timing jitter and the scanning variability. The resultant A′ is then added by an AWGN B with a random phase angle ϕ and being detected as I. The phase angle of the measured I is ψ.
Since both δβ and B are random variables, the measured phase angle ψ is also a random variable. Let us assume that the signal phasor A has a constant amplitude 1, the random phasor B has a constant amplitude b, and a uniformly distributed phase angle ϕ. The probability density function of the phase angle ψ of the measured phasor can be written as
| (6) |
where
| (7) |
The standard deviation σψ of the phase angle ψ essentially represents how precisely an OCT could measure the phase of the sample. It can be calculated as the root mean square error (RMSE) of the multiple phase measurements. We first defined the following k-sweep variation coefficient W to conveniently characterize the system phase stability:
| (8) |
where is the wavenumber of the central wavelength of the light source. The larger the W is, the higher phase stability the system possesses. The SNR of the system is
| (9) |
We then conducted a computer simulation by using the Monte Carlo method. The calculated σψ at the sample location (zd = 150 μm) was plotted in logarithmic scale as a color-coded image against two variables, W and SNR, in Fig. 3(a). W ranged from 1 to 200 dB and SNR varied from 1 to 100 dB. Both were in a 1 dB step. For each (W, SNR) pair, 10 million signal photons were launched. The program was implemented in MATLAB and run on the high-performance computing cluster (Columbia University Yeti HPC cluster, USA). We plotted the RMSE of the measured phase at different SNRs against W in Fig. 3(b). When the k-sweep variation coefficient, W, is very low, the system suffers large noises from the scanning variability and the timing jittering. The measured phase angle ψ is random in the entire range of (−π, π]. In this regime, σψ is bounded and is not changed with either SNR or W. When W rises above a certain threshold (30 dB), σψ starts to reduce linearly against W in logarithmic scale. If W is further increased, σψ will saturate at a certain level that is determined by both SNR and zN. We also plotted σψ at different values of W against SNR in Fig. 3(c). When SNR is large, the noise b in Eq. (6) approaches 0. The probability distribution function shown in Eq. (6) is equivalent to a normal distribution with a standard deviation of 2σtotalzN. It is noted that σψ tends to saturate at a higher level with higher W. For large W (>60 dB), σψ is mostly linear in the selected dynamic range. In fact, the curve will converge to the previously reported SD-OCT case [3] if W goes to infinity.
Fig. 3.
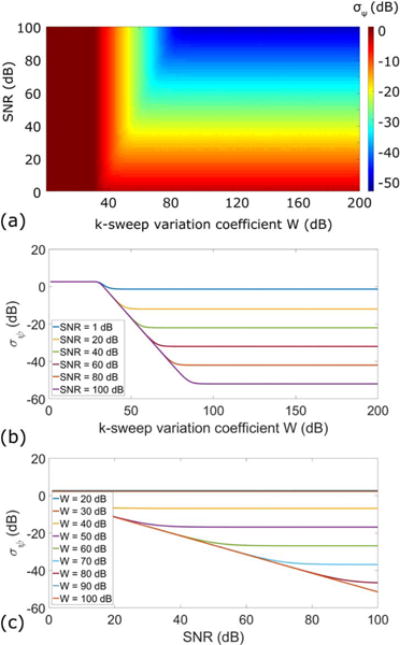
Monte Carlo simulation of the proposed model. The calculated standard deviation of the final phase angle is first plotted as a pseudo-color image against SNR and W in logarithmic scale in (a). The σψ are plotted against W in (b) and SNR in (c), respectively.
Experiments were conducted to verify the proposed model. A custom-built SS-OCT system was developed by using an electrically tuned wavelength swept light source (NTT-AT, Japan). The source features a phase-locked loop-connected A-line sweeping and trigger output [13]. The central wavelength of the light source is 1329 nm, and the wavelength span is 101 nm. The A-line rate of the system is 200 kHz with a duty cycle of 50%. A dual-balance detection scheme was realized by using a broadband photoreceiver (PDB480C-AC, Thorlabs, U.S.), and a 12 bit high-speed data acquisition board (ATS9373-A3, AlazarTech, Canada) was used to digitize the analog interference signals. Samples were placed in the focal plane of the sample arm with the reference arm blocked to achieve a common-path interferometer configuration. A reference clock was used to resample the sample signal to minimize the scanning variability [10].
Since the scanning variability is inherent to a specific system, we first verified the effect of timing jitter with controlled zd. A piece of No. 1 glass coverslip was used, and we altered the δt by changing the sampling rate of the DAQ from 200 MS/s to 1.8 GS/s. For each sampling rate, we tuned the SNR of the OCT signal by a continuously variable neutral density filter (NDC-25C-4M, Thorlabs, U.S.). The results are plotted in Fig. 4(a). As a comparison, we also added the experimental data obtained from a 32 kHz SD-OCT system using a superluminescent diode. The SD-OCT measurements were very close to the theoretical limit as predicted in Ref. [3]. However, the SS-OCT measurements saturated at higher SNR; this behavior is predicted in our model, as shown in Fig. 3(c).
Fig. 4.
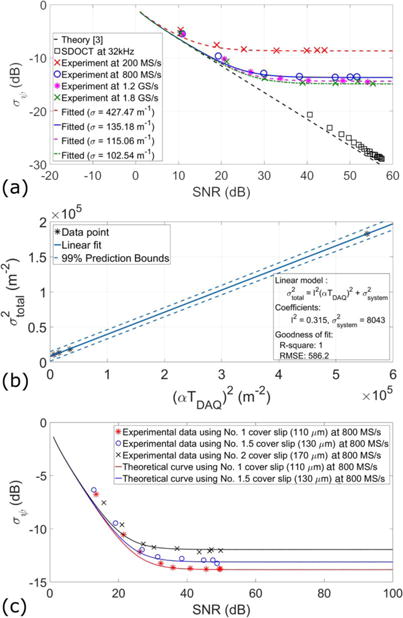
Experimental verification of the proposed model. (a) A No. 1 glass coverslip was tested by both SD-OCT and SS-OCT systems. The theoretical limit of SD-OCT was calculated using Choma’s model [3]. For the SS-OCT measurements, the sampling rate was varied. We present the data against the predictions made by the proposed model with fitted parameter σtotal. (b) The fitted parameter σtotal was further used to linearly fit Eq. (7) to obtain the parameter l and the parameter σsystem. (c) We then fixed the sampling rate of the DAQ to be 800 MS/s and changed zd by using coverslips with different thicknesses. The theoretical predictions were made by adopting the fitted parameters l and σsystem in (b).
A family of curves σψ (σtotal, SNR) was obtained based on Eq. (6) via Monte Carlo simulation and then fitted to the experimental data (σψ, SNR) by using least squares approximation. The fitted σtotal are listed in Table 1.
Table 1.
Fitted σtotal and Other Parameters for Different Sampling Rates
| Sampling Rate | TDAQ | αTDAQ (m−1) | Fitted σtotal (m−1) |
|---|---|---|---|
| 200 MS/s | 5 ns | 744.47 | 427.47 |
| 800 MS/s | 1.25 ns | 186.17 | 135.18 |
| 1.2 GS/s | 833.33 ps | 124.12 | 115.06 |
| 1.8 GS/s | 555.56 ps | 82.78 | 102.54 |
After that, we used the fitted σtotal to obtain the coefficient l and σsystem in Eq. (7). From Fig. 4(b), we can see that the fitted coefficient l is equal to 0.5612, and the fitted σsystem is 89.68 m−1. We then fixed the sampling rate of the DAQ to be 800 MS/s and validated our model with different values of zd. We used No. 1 (110 μm), No. 1.5 (130 μm), and No. 2 (170 μm) glass coverslips as samples in a common-path configuration. Theoretical predictions were made by using the fitted parameters l and σsystem. The experimental data and the theoretical predictions presented great agreements, as shown in Fig. 4(c). In summary, the fitted timing jitter of the system at 800 MS/s is 701.5 ps, while the fitted scanning variability is 0.0019% compared with .
Finally, based on the obtained system parameters (l and σsystem), we plotted the achievable phase stability of our SS-OCT as a function of the sampling rate and sample location in Fig. 5. This plot could be used as a guideline for future SS-OCT experiment design; with required phase stability, available DAQ board, imaging depth, and data bandwidth in mind, the researchers could find a niche to achieve best performance.
Fig. 5.
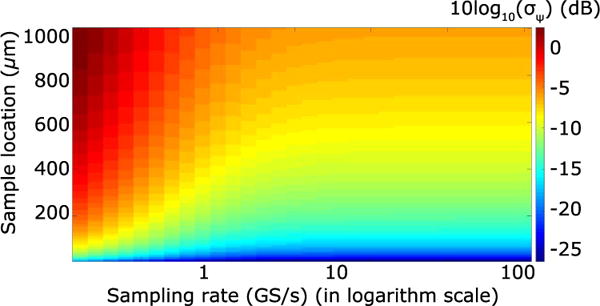
Achievable phase stability of the custom-built SS-OCT at various sample depths zd and sampling rates.
In conclusion, we presented a new theoretical model for phase noise analysis of SS-OCT. Compared with the models previously conceived upon SD-OCT, the proposed model incorporates two new factors and fits the SS-OCT experimental data better. The new model also suggests that SS-OCT is fundamentally at a disadvantage in absolute phase measurements against SD-OCT in terms of phase stability/sensitivity due to its temporal measurement nature; the collection of the three factors affects as a multiplicative noise on the original signal in addition to the additive noise such as the shot noise and the excess noise. The sole increment on the SNR will no longer boost the phase stability in SS-OCT. However, there are merits for using SS-OCT in phase-related tasks. The faster A-line acquisition of SS-OCT could improve the temporal resolution of sectional or volumetric phase measurements. The variance on the absolute phase measurement could also be washed out if the absolute measurement was later Fourier transformed to obtain the vibrational information.
Acknowledgments
Funding. National Institutes of Health (NIH) (1DP2HL127776-01).
References
- 1.Park BH, Pierce MC, Cense B, Yun SH, Mujat M, Tearney GJ, Bouma BE, de Boer JF. Opt Express. 2005;13:3931. doi: 10.1364/opex.13.003931. [DOI] [PubMed] [Google Scholar]
- 2.Choma MA, Ellerbee AK, Yang C, Creazzo TL, Izatt JA. Opt Lett. 2005;30:1162. doi: 10.1364/ol.30.001162. [DOI] [PubMed] [Google Scholar]
- 3.Choma MA, Ellerbee AK, Yazdanfar S, Izatt JA. J Biomed Opt. 2006;11:024014. doi: 10.1117/1.2193167. [DOI] [PubMed] [Google Scholar]
- 4.Szkulmowski M, Szkulmowska A, Bajraszewski T, Kowalczyk A, Wojtkowski M. Opt Express. 2008;16:6008. doi: 10.1364/oe.16.006008. [DOI] [PubMed] [Google Scholar]
- 5.Vakoc BJ, Yun SH, de Boer JF, Tearney GJ, Bouma BE. Opt Express. 2005;13:5483. doi: 10.1364/opex.13.005483. [DOI] [PMC free article] [PubMed] [Google Scholar]
- 6.Adler DC, Huber R, Fujimoto JG. Opt Lett. 2007;32:626. doi: 10.1364/ol.32.000626. [DOI] [PubMed] [Google Scholar]
- 7.Bonesi M, Minneman MP, Ensher J, Zabihian B, Sattmann H, Boschert P, Hoover E, Leitgeb RA, Crawford M, Drexler W. Opt Express. 2014;22:2632. doi: 10.1364/OE.22.002632. [DOI] [PubMed] [Google Scholar]
- 8.Drexler W, Fujimoto JG, editors. Theory of Optical Coherence Tomography. Springer; 2015. pp. 65–94. [Google Scholar]
- 9.Adler DC, Chen Y, Huber R, Schmitt J, Connolly J, Fujimoto JG. Nat Photonics. 2007;1:709. [Google Scholar]
- 10.Gora M, Karnowski K, Szkulmowski M, Kaluzny BJ, Huber R, Kowalczyk A, Wojtkowski M. Opt Express. 2009;17:14880. doi: 10.1364/oe.17.014880. [DOI] [PubMed] [Google Scholar]
- 11.Choi W, Potsaid B, Jayaraman V, Baumann B, Grulkowski I, Liu JJ, Lu CD, Cable AE, Huang D, Duker JS, Fujimoto JG. Opt Lett. 2013;38:338. doi: 10.1364/OL.38.000338. [DOI] [PMC free article] [PubMed] [Google Scholar]
- 12.Liu G, Tan O, Gao SS, Pechauer AD, Lee B, Lu CD, Fujimoto JG, Huang D. Opt Express. 2015;23:9824. doi: 10.1364/OE.23.009824. [DOI] [PMC free article] [PubMed] [Google Scholar]
- 13.Sasaki Y, Fujimoto M, Yagi S, Yamagishi S, Toyoda S, Kobayashi J. Proc SPIE. 2014;8934:89342Y. [Google Scholar]


