Abstract
Background
With the increasing incidence of scrub typhus in recent years, it is of great value to analyse the spatial and temporal distribution of scrub typhus by applying micro-geographical studies at a reasonably fine scale, and to guide the control and management.
Methods
We explored the use of maximum entropy modelling method to confirm the spatial and temporal distribution of scrub typhus according to the occurrence locations of human cases in Jiangsu Province. The risk prediction map under specific environmental factors was therefore drawn by projecting the training model across China. The area under the curve and the omission rate were used to validate the model. Meanwhile, Jackknife tests were applied to enumerate the contribution of different environmental variables, then to predict the final model. The predicted results were validated by using China’s known occurrence locations.
Results
A total of 566 occurrence locations with known 4865 scrub typhus occurrence records were used in our study. The number of female cases was higher than male cases, with a proportion of 1.17:1, and people in any age group could be infected. The number of cases presented an inverted-U relation with age. The percentage of cases aged from 60 to 69 years old was the highest, accounting for 30.50% of all cases. Ecological niche modelling results indicated that the locations of scrub typhus cases, which was of great importance in the disease transmission cycle, had a certain ecological niche with environmental elements in many dimensions. Moreover, the key environmental factors for determining scrub typhus occurrence were temperature (including temperature seasonality, min temperature of coldest month, mean diurnal range, and monthly mean temperature), precipitation of wettest month, and land cover types. The risk prediction maps indicated that mid-eastern China was the potential risk areas for scrub typhus of “autumn type”. Meanwhile, in our results, Guangdong Province was the high-risk region for “autumn type” scrub typhus, where cases were mainly reported as “summer type”.
Conclusion
The combination of climatic and geographic factors with GIS methods is an appropriate option to analyse and estimate the spatial and temporal distribution of scrub typhus.
Keywords: Scrub typhus, Spatial epidemiology, ENM, Maxent, GIS
Background
Scrub typhus is an acute febrile disease, which can be transmitted to humans through infected chigger mites [1]. Before 1986, this kind of disease was only found in southern China, named as “summer type” with an onset period from March to November [2, 3]. In the autumn-winter period of 1986, scrub typhus was found in Shandong Province and Jiangsu Province, China. Since then, the number of people infected with this type of scrub typhus has increased in northern China [3–5]. As for this type, it was mainly found from September to December and peaked in October, being categorized into “autumn type”.
Until recently, the habitat flexibility of chigger mites has not been systematically studied, and thus, the neglect of scrub typhus was unavoidable in most epidemic regions. With the increasing incidence of scrub typhus in recent years, the accurate identification of its occurrence locations has been a crucial problem to be resolved urgently, concerning the clinical diagnosis and control measures [6]. At present, ecological niche modelling (ENM) approach is extensively applied to predict the potential risk areas of species [7–9]. ENMs apply statistical and machine learning theories to analyse the occurrence of one species and to build character functions that estimate the possible shape of its realized niche within the niche space [10]. According to this theory it may be easy to analyze the relevant factors probably influencing species’ habitat across the target landscapes [11]. This method has been utilized to characterize the potential risk distribution of species, to understand the effects of climate change, and to predict the high-risk areas of disease occurrence in the fields of ecology, biogeography and evolutionary biology [12–14].
This paper aims to analyse the epidemiologic features and model the spatial and temporal distribution of scrub typhus in China on the basis of climatic and geographic factors by using ENM.
Methods
Scrub typhus occurrence data
Jiangsu Province, located in eastern China, was chosen for the study. It has been considered as a main endemic area of scrub typhus. Scrub typhus became a reportable disease in 2006, regulated by China’s National Disease Reporting Information System. Under this guidance, all medical institutions were required to submit the report of scrub typhus cases everyday with unified format including the information about gender, age, residential places, professions and date of disease onset through the web-based surveillance system.
According to the guidebook for prevention and control of scrub typhus (Chinese Center for Disease Control and Prevention, 2008), coincidence of three or more of the following items constituted a clinical case of scrub typhus: (1) a field exposure history 1–3 weeks before illness onset; (2) symptoms including high fever, lymphadenopathy, skin rash, splenomegaly, hepatomegaly, or multiorgan dysfunction; (3) typical cutaneous lesions (eschars or ulcers); (4) rapid defervescence with appropriate antibiotics; and (5) Weil-Felix OX-K agglutination titer ≥1:160. Confirmed cases were defined as clinical cases with a positive result for PCR test targeting a 56-kDa gene of Orientia tsutsugamushi, Orientia tsutsugamushi isolation or four-fold or higher levels of IgG antibody titers between convalescent-phase and acute-phase sera.
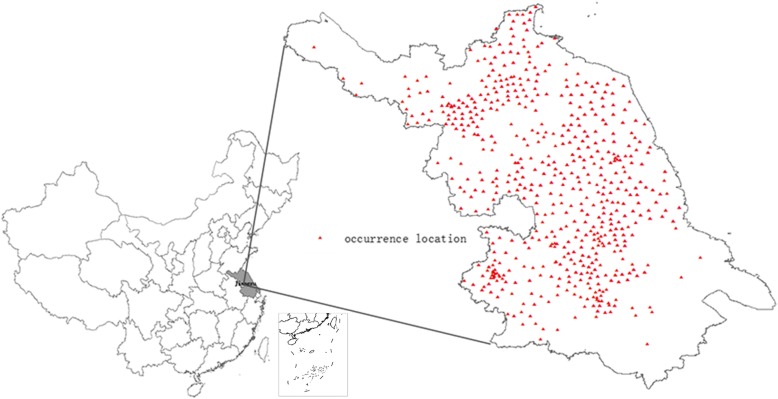
From January 2010 to December 2015 in Jiangsu Province, 566 occurrence locations with 4865 clinical and confirmed cases of scrub typhus were identified. All records were geo-referenced by combining patient’s residential towns and Jiangsu Province vector maps (Fig. 1).
Fig. 1.
Spatial distribution of scrub typhus cases in Jiangsu Province, 2010–2015
Environmental factors
Environmental datasets used in this study were downloaded and detailed below.
Seven climatic and 19 bioclimatic variables were collected from the WorldClim database (http://www.worldclim.org, version 2.0) with a resolution of 30 s and had been averaged over a 50-year time period from 1950 to 2000. Derived from the monthly temperature and rainfall, these variables can be utilized to produce more biologically meaningful variables and can be used to reflect more information, such as annual trends, seasonality and extreme or limiting environmental factors for niche modelling.
Elevation data was downloaded from the SRTM mission (http://srtm.csi.cgiar.org/SELECTION/inputCoord.asp) with a resolution of 90 m. The data was used to derive the slope, aspect and composite topographic layers.
The monthly maximum normalized difference vegetation index values (NDVI), enhanced vegetation index (EVI), and land cover types were obtained from Moderate Resolution Imaging Spectroradiometer (MODIS) satellite imagery (https://ladsweb.nascom.nasa.gov/search/). In land cover type, the classes that we selected were defined according to the International Geosphere-Biosphere Program (IGBP) 17-class scheme. This set of cover types includes 11 categories of natural vegetation covers broken down by life form, 3 classes of developed and mosaic lands, and 3 classes of non-vegetated lands.
All the environmental layers were resampled into the same projection information and were converted into the ASCII raster data format required by ENM.
Ecological niche modelling
Ecological niche modelling, using maximum entropy algorithm (Maxent, version 3.3.3 k), was adopted to predict the distribution of scrub typhus. It is a multi-purpose machine learning program that can achieve high predictive accuracy and enjoys several additional attractive properties [15, 16]. With a simple and precise mathematical formulation, it can be used to estimate the probability distribution of a species based on presence-only datasets and environmental constraints [17–19].
Maxent was applied accordingly with the following changes in model run. 75% were selected at random to construct the model, while the remaining were used for validation. Regularization multiplier was set to 1. The background points were selected randomly by removing the occurred position within the study area, and the maximum number of background points was kept at 10000. In order to obtain a robust model, we ran 10 replicates based on independent random partitions, then averaged the results. Replicated run type was set to cross-validate. Maximum iterations were set to 5000, with convergence threshold of 1 × 10− 6. Auto features of environmental variables were selected. Response curves were used to analyse the suitable range of each environmental condition for the occurrence of scrub typhus. The logistic output format of the predictive map with probability values ranging from 0 (unsuitable) to 1 (suitable) was chosen to visualize the potential risk of scrub typhus. The default prevalence parameter was set to 0.5 as the risk cut-off to distinguish potential presence regions from potential absence regions.
The threshold-dependent binomial test, using the extrinsic omission rate as statistic, was carried out to detect the statistical significance of the model [20, 21]. Jackknife procedure and the percentage of variables’ contributions were applied to evaluate the relative importance of each environmental variables. The area under the receiver operating characteristic curve (ROC), known as the area under the curve (AUC), was used to evaluate the prediction performance of the model [22–24]. Generally, AUC values of 0.5–0.7 were considered as low accuracy, values of 0.7–0.9 were considered as useful applications and values of > 0.9 were considered as high accuracy [25].
Model projection
A potential risk map of China was produced by projecting the training model gained from Jiangsu Province onto the specific environmental layers. Meanwhile, the model performs was evaluated using the known occurrence locations of disease.
Results
Epidemiologic features of confirmed cases
There were 97、497、525、713、1109、1924 clinical and confirmed cases of scrub typhus in Jiangsu Province from 2010 to 2015. Cases were clustered in autumn with a single incidence peak appearing from October or November (Fig. 2). Temporal distribution characteristics of scrub typhus occurring in October and November from 2010 to 2015, were listed in Fig. 3. Time trend analysis revealed that cases started to appear from early October. Case numbers then slowly rose and peaked in early November, followed by a decline and finally reached the lowest numbers at the end of November. Peak incidence usually occurs between October 20th and November 10th.
Fig. 2.

Seasonal distribution of confirmed cases in Jiangsu Province, 2010–2015
Fig. 3.
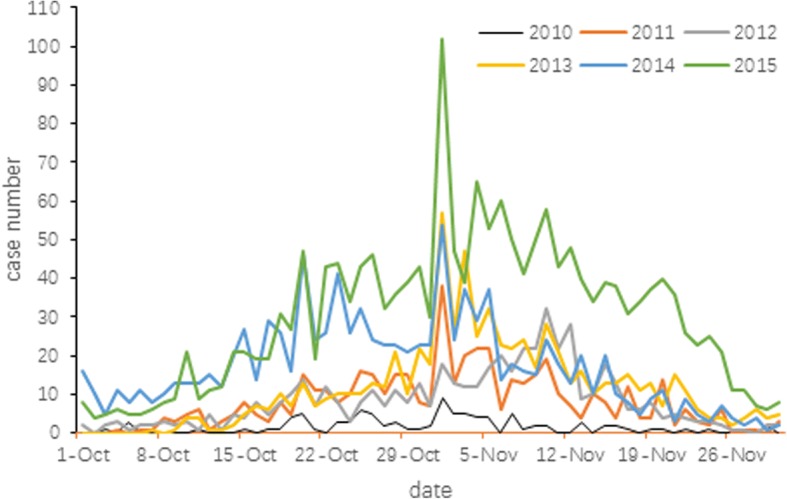
Temporal distribution of cases in October and November in Jiangsu Province, 2010–2015
Table 1 listed the demographic characteristics of scrub typhus cases in Jiangsu Province, from 2010 to 2015. According to this study, the number of cases increased year by year. On the whole, the number of female cases was higher than male cases, with a proportion of 1.17:1, and people in any age group could be infected by Orientia tsutsugamushi. The number of cases presented an inverted-U relation with age. Those who aged from 60 to 69 years old accounted for 30.50% of all cases, with the highest percentage. For different occupations, epidemiologic surveillance indicated that the susceptible population of scrub typhus were farmers.
Table 1.
Demographic characteristics of scrub typhus cases in Jiangsu Province, 2010–2015
| Features | 2010 n(%) |
2011 n(%) |
2012 n(%) |
2013 n(%) |
2014 n(%) |
2015 n(%) |
Total n(%) |
|---|---|---|---|---|---|---|---|
| Sex | |||||||
| Male | 39(40.21) | 233(46.88) | 268(51.05) | 292(40.95) | 498(44.91) | 914(47.51) | 2224(46.13) |
| Female | 58(59.79) | 264(53.12) | 257(48.95) | 421(59.05) | 611(55.09) | 1010(52.49) | 2621(53.87) |
| Age | |||||||
| 0~ 9 | 4(4.12) | 14(2.82) | 14(2.67) | 7(0.98) | 14(1.26) | 13(0.68) | 66(1.36) |
| 10~ 19 | 0 | 3(0.60) | 1(0.19) | 3(0.42) | 10(0.90) | 10(0.52) | 27(0.55) |
| 20~ 29 | 1(1.03) | 12(2.41) | 12(2.29) | 15(2.10) | 34(3.07) | 42(2.18) | 116(2.38) |
| 30~ 39 | 5(5.15) | 23(4.63) | 26(4.95) | 34(4.77) | 56(5.05) | 77(4.00) | 221(4.54) |
| 40~ 49 | 13(13.40) | 71(14.29) | 96(18.29) | 110(15.43) | 166(14.97) | 288(14.97) | 744(15.29) |
| 50~ 59 | 32(32.99) | 130(26.16) | 122(23.24) | 177(24.82) | 254(22.90) | 457(23.75) | 1172(24.09) |
| 60~ 69 | 33(34.02) | 147(29.58) | 149(28.38) | 227(31.84) | 333(30.03) | 595(30.93) | 1484(30.50) |
| 70~ 79 | 7(7.22) | 77(15.49) | 85(16.19) | 103(14.45) | 198(17.85) | 355(18.45) | 825(16.96) |
| 80~ 100 | 2(2.06) | 20(4.02) | 20(3.81) | 37(5.19) | 44(3.97) | 87(4.52) | 210(4.32) |
| Occupation | |||||||
| Worker | 3(3.09) | 19(3.82) | 19(3.62) | 31(4.35) | 42(3.79) | 60(3.12) | 174(3.58) |
| Retiree | 3(3.09) | 16(3.22) | 18(3.43) | 27(3.79) | 40(3.61) | 85(4.42) | 189(3.88) |
| Student& children | 4(4.12) | 18(3.62) | 17(3.24) | 10(1.40) | 22(1.98) | 20(1.04) | 91(1.87) |
| Farmer | 82(84.54) | 413(83.10) | 441(84.00) | 619(86.82) | 946(85.30) | 1635(84.98) | 4136(85.02) |
| Unemployed | 2(2.06) | 16(3.22) | 12(2.29) | 14(1.96) | 43(3.88) | 64(3.33) | 151(3.10) |
| Teacher | 2(2.06) | 3(0.60) | 6(1.14) | 4(0.56) | 8(0.72) | 9(0.47) | 32(0.66) |
| Others | 1(1.03) | 12(2.41) | 12(2.29) | 8(1.12) | 8(0.72) | 51(2.65) | 92(1.89) |
%: constituent ratio
Variation of environmental factors
Some highly intercorrelated (correlation coefficient > 0.9 or < − 0.9) variables were removed as they might violate statistical assumptions and alter model predictions [26]. Finally, 17 environmental variables, including 3 climatic factors, 9 bioclimatic factors, 2 surface factors, and 3 topographic factors, were used in constructing species distribution model. Table 2 listed the appropriate range of each environmental factor for scrub typhus occurrence and the logistic output probability of scrub typhus presence with a cut-off point of 0.5. It indicated that scrub typhus occurrence had a specific ecological niche with multi-dimensional environmental factors, which play important roles in its transmission cycle.
Table 2.
The suitable range and percent contribution of each environmental condition for scrub typhus occurrence
| Variable | Description(unit) | Suitable rangea | Percent contributiond |
|---|---|---|---|
| BIO_01 | Annual mean temperature(°C) | 11.3–14.3 | 1.8 |
| BIO_02 | Mean diurnal range | 8.7–10.7 | 14.5 |
| BIO_04 | Temperature seasonality | 920.0–980.0 | 24.9 |
| BIO_05 | Max temperature of warmest month(°C) | 31.7–32.8 | 1.1 |
| BIO_06 | Min temperature of coldest month(°C) | −4.2 to-1.2 | 19.9 |
| BIO_12 | Annual precipitation (mm) | 740.0–1000.0 | 3.6 |
| BIO_13 | Precipitation of wettest month (mm) | 196.0–275.0 | 8.7 |
| BIO_14 | Precipitation of driest month (mm) | 17.0–28.0 | 2.0 |
| BIO_15 | Precipitation seasonality (mm) | 58.0–82.0 | 3.6 |
| prec | Precipitation (mm) | 22.0–71.0 | 0.5 |
| tavg | Monthly average temperature (°C) | 8.9–11.1 | 5.6 |
| wind | Wind speed (m s-1) | 2.2–2.5 | 1.6 |
| NDVI | Normalized difference vegetation index | 0.18–0.39 | 7.5 |
| LC | Land cover type | 7,13,14b | 4.7 |
| DEM | Altitude(m) | nonec | 0.0 |
| Aspect | Aspect | nonec | 0.0 |
| Slope | Slope | nonec | 0.0 |
aThe suitable range of each variable indicates the conditions within which the probability of scrub typhus occurrence is higher than 50%
b7: Open shrublands; 13: Urban and Built-up; 14: Cropland-Natural Vegetation Mosaic. The combination of these classes could be found in and around the countryside
cNonemeans this environmental factor has little effect on the final model construction
dThe percentage contribution illustrates the relative contributions of the environmental variables to the final training Maxent model using the averages of the repeated 10 runs
The relative importance of environmental elements on scrub typhus occurrence based on Jackknife test was shown in Fig. 4 and Table 2. This indicated that the critical environmental factors for determining scrub typhus occurrence were temperature (including temperature seasonality, min temperature of coldest month, mean diurnal range, and monthly mean temperature), precipitation of wettest month, and land cover types.
Fig. 4.
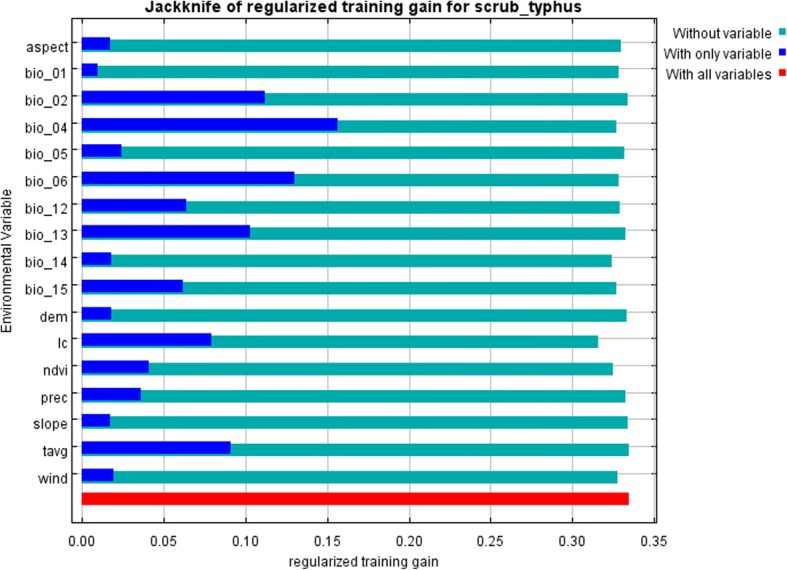
Results of the Jackknife test of variable importance
Statistical analysis and model evaluation
The average omission and predicted area for scrub typhus varied with different cumulative threshold (Fig. 5). The results showed that the omission on test and training samples was very consistent with the predicted omission rate. Thus, the training model had a good statistical significance.
Fig. 5.
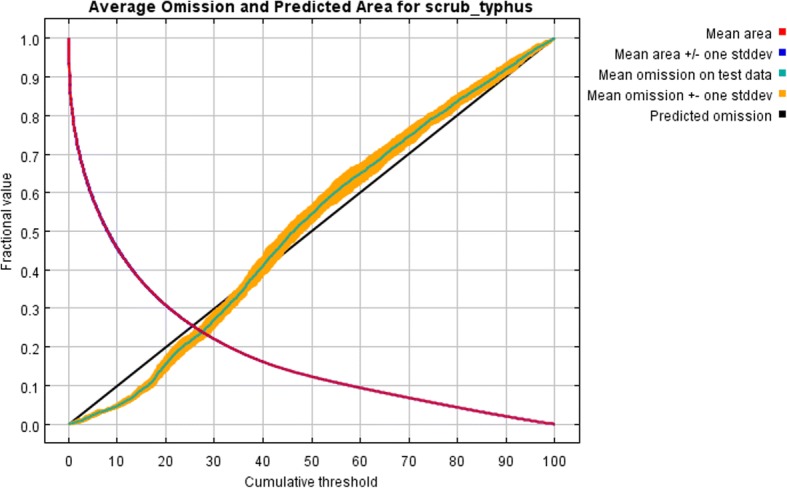
Omission and predicted areas for scrub typhus
The omission rate with the p-value calculated by binomial omission tests, and the AUC of the testing and training model was shown in Table 3. All 10 single runs were statistically significant, and AUC for all 10 models were higher than 0.80, indicating that both the testing model and the training model performed well in predicting the potential high-risk areas of scrub typhus.
Table 3.
Model evaluation results of each single run
| Run | Training AUC | Testing AUC | Training omission ratea | Testing omission rate | P value |
|---|---|---|---|---|---|
| 1 | 0.833 | 0.827 | 0.009 | 0.017 | < 0.0001 |
| 2 | 0.832 | 0.829 | 0.008 | 0.005 | < 0.0001 |
| 3 | 0.832 | 0.833 | 0.011 | 0.022 | < 0.0001 |
| 4 | 0.833 | 0.827 | 0.009 | 0.010 | < 0.0001 |
| 5 | 0.833 | 0.828 | 0.009 | 0.012 | < 0.0001 |
| 6 | 0.832 | 0.841 | 0.008 | 0.010 | < 0.0001 |
| 7 | 0.833 | 0.835 | 0.008 | 0.005 | < 0.0001 |
| 8 | 0.833 | 0.822 | 0.009 | 0.022 | < 0.0001 |
| 9 | 0.832 | 0.833 | 0.011 | 0.010 | < 0.0001 |
| 10 | 0.834 | 0.818 | 0.008 | 0.015 | < 0.0001 |
aBalance training omission, predicted area and the threshold value
Potential risk areas of scrub typhus
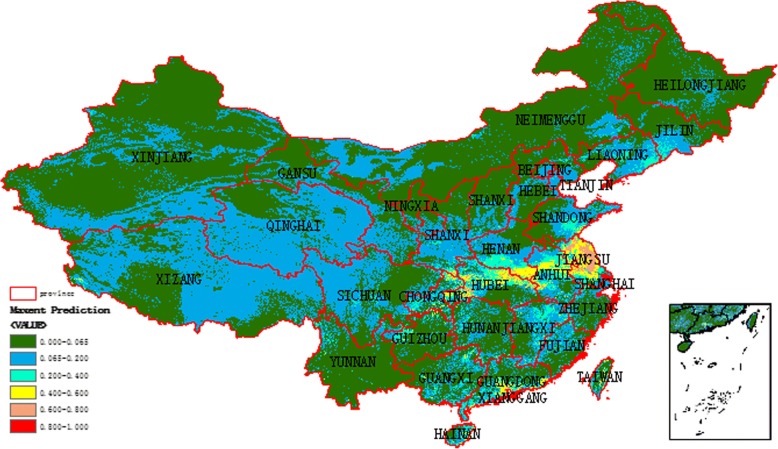
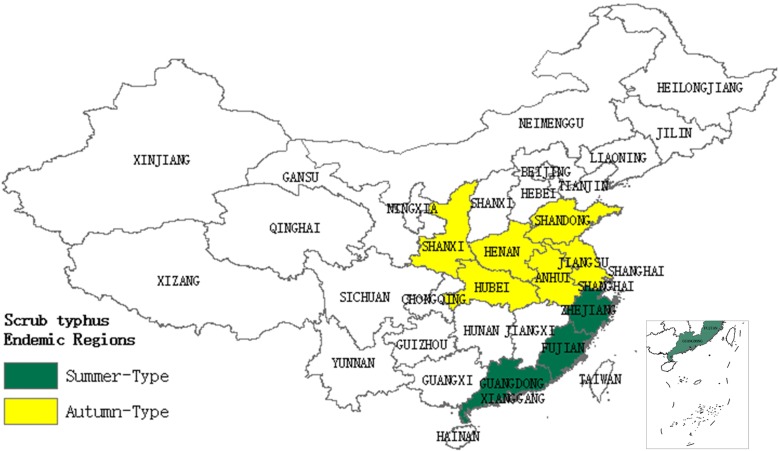
We made a prediction about potential high-risk regions of scrub typhus in November in China, since the case numbers of scrub typhus in Jiangsu Province peaked in November each year. The predicted potential high-risk regions, with a cut-off point of 0.065 for the logistic output probability, were shown in Fig. 6. The known occurrence [27, 28] of the disease with “summer type” and “autumn type” in China was shown in Fig. 7. The potential high-risk regions of “autumn type” for scrub typhus were mainly distributed in Shandong Province, Jiangsu Province, Anhui Province, Henan Province, and Hubei Province. Within the predicted potential risk regions, most of them were recognized by the known cases of scrub typhus. However, still some predicted high-risk areas remained to be verified in the future.
Fig. 6.
Predicted potential risk areas for scrub typhus in November in China
Fig. 7.
Spatial distribution of reported cases of scrub typhus in China
Discussion
As an infectious disease with natural foci, it is feasible to predict the potential high-risk areas of scrub typhus by analysing environmental elements [29]. This study aimed at modelling and predicting the potential risk distribution of scrub typhus. In our research, we first applied ENM to analyse the data of both spatial scrub typhus cases and its habitat, and to predict the potential risk areas. Then latent at-risk areas of whole China were estimated.
Recent studies indicate that scrub typhus occurs much more frequently in secondary vegetation, where chiggers and small mammal hosts are more abundant [33]. Epidemiologic surveillance shows that the infection rate among farmers are exceptionally high, mainly due to their frequent contact with disturbed habitats. Another fact is that scrub typhus infection is more common in female than male with similar variation tendency. It may be because most women generally spend more time on farm work outdoors. Global trends in population aging can be witnessed currently. Consequently, more and more young people go to cities to earn the family’s bread and leave the elderly in rural areas to take care of their children. These phenomena may contribute to a higher percentage of the elderly patients. The incidence of scrub typhus has obvious seasonal character. During the research period, scrub typhus cases occurred exclusively every year from September to December. From the model, we found that temperature was the key environmental factor with a suitable range for scrub typhus occurrence. This was consistent with the recent studies [30–33]. In general, temperature plays an important role in the spread of vector-borne diseases [34]. It can affect the replication and dissemination of the pathogen directly within an appropriate scale [35], the ecological dynamics of virus vectors [36], and the behaviour and ecological characteristics of both wild and native hosts [35].
The potential high-risk map in China suggests that the broad central coast of China is high-risk areas for “autumn type”. Besides, in our results, Guangdong Province, where cases mainly reported as “summer type”, is also a high-risk region for “autumn type”. Therefore, epidemiological surveillance should be performed in these areas in the future.
ENM method is an especially effective method to predict the potential risks of a disease [37–39], as identifying the potential risk distribution of human disease is a very complex task [40]. Among the numerous ENM methods, Maxent has been identified as the best algorithm [41, 42]. It is clarified that the projection of the model into geographic space represents the potential areas at the risk of the disease, not the actual or realized occurrence locations. So, predictions made from models should not provide a complete substitute for detailed field data, thus, to test the prediction result of our model, surveillance in those places predicted to be at high risk for scrub typhus occurrence but without recorded human cases to date should be enhanced.
Conclusions
This research, for the first time, provided a method for predicting the potential risk distribution of scrub typhus by using ecological requirements. The results showed that the incidence of scrub typhus had obvious seasonal character, and mid-eastern China with temperature at a suitable range was the potential risk areas for scrub typhus occurrence with “autumn type”. Meanwhile, other regions, such as Guangzhou Province which was reported as “summer type”, can also be defined with “autumn type”.
Our research showed that the combination of habitat data and field investigation can be used to analyse and predict the potential areas at risk of scrub typhus.
Acknowledgements
We thank Steven Phillips, from AT&T Labs-Research, Princeton University, for providing Maxent model and appreciate Dawei Zhang from School of Public Health, Southeast University, for revising the final manuscript.
Funding
This study was supported by National Nature Science Foundation of China (NO. 81601794), Jiangsu Province Science & Technology Demonstration Project for major Emerging Infectious Diseases Control and Prevention (NO.BE2015714), Jiangsu Provincial Key Medical Discipline of Epidemiology (NO. ZDXKA2016008), and Jiangsu Provincial Medical Youth Talent (No.QNRC2016545), Jiangsu Provincial Nature Science Foundation (No.BK20161584). The funders had no role in study design, data collection and analysis, decision to publish, or preparation of the manuscript.
Availability of data and materials
The datasets used and/or analysed during the current study are available from the corresponding author on reasonable request.
Abbreviations
- AUC
area under the curve
- ENM
ecological niche model
- GIS
Geographical information system
- IGBP
International Geosphere-Biosphere Program
- MODIS
Moderate Resolution Imaging Spectroradiometer
- NDVI
normalized difference vegetation index
- ROC
receiver operating characteristic curve
- SRTM
Shuttle Rader Topography Mission
Authors’ contributions
HYY, CKS, and JLH designed the study. HYY wrote the manuscript and analysed model results. CKS contributed to spatial analysis and Maxent modelling. JLH analysed epidemiologic data. WDL and XCW conducted fields sampling and collated the data throughout this study. ZFL, SQS and ZMT analysed environmental data. CJB contributed to interpreting the results. HYY and CKS contributed equally in this study. All authors read and approved the final manuscript.
Ethics approval and consent to participate
In research of present paper, the data of scrub typhus cases were extracted from online databases, and no sample of human and animal was included. Therefore, the ethical approval and consent to participate are not necessary for the research. Meanwhile, all data were anonymous.
Consent for publication
Not applicable.
Competing interests
The authors declare that they have no competing interests.
Publisher’s Note
Springer Nature remains neutral with regard to jurisdictional claims in published maps and institutional affiliations.
Contributor Information
Huiyan Yu, Email: yuhy86@126.com.
Changkui Sun, Email: sunchangkui@163.com.
Wendong Liu, Email: jscdclwd@sina.cn.
Zhifeng Li, Email: andylizhifeng@163.com.
Zhongming Tan, Email: 710060670@qq.com.
Xiaochen Wang, Email: 276532893@qq.com.
Jianli Hu, Email: 59139316@qq.com.
Shanqiu Shi, Email: 6919368@qq.com.
Changjun Bao, Email: bao2000_cn@163.com.
References
- 1.Zhao MX, Wang T, Yuan XY, Du WM, Lin MX, Shen YB. Comparison of minocycline and azithromycin for the treatment of mild scrub typhus in northern China. Int J Antimicrob Ag. 2016;48(3):317–320. doi: 10.1016/j.ijantimicag.2016.05.019. [DOI] [PubMed] [Google Scholar]
- 2.Wu YC, Qian Q, Soares Magalhaes RJ, Han ZH, Hu WB, Haque U, Weppelmann TA, Wang Y, Liu YX, Li XL, et al. Spatiotemporal dynamics of scrub typhus transmission in mainland China, 2006-2014. PLoS Negl Trop Dis. 2016;10(8):e0004875. doi: 10.1371/journal.pntd.0004875. [DOI] [PMC free article] [PubMed] [Google Scholar]
- 3.Liu YX, Feng D, Suo JJ, Xing YB, Liu G, Liu LH, Xiao HJ, Jia N, Gao Y, Yang H, et al. Clinical characteristics of the autumn-winter type scrub typhus cases in south of Shandong province, northern China. BMC Infect Dis. 2009;9:82. doi: 10.1186/1471-2334-9-82. [DOI] [PMC free article] [PubMed] [Google Scholar]
- 4.Zhang S, Song H, Liu Y, Li Q, Wang Y, Wu J, Wan J, Li G, Yu C, Li X, et al. Scrub typhus in previously unrecognized areas of endemicity in China. J Clin Microbiol. 2010;48(4):1241–1244. doi: 10.1128/JCM.01784-09. [DOI] [PMC free article] [PubMed] [Google Scholar]
- 5.Hu J, Tan Z, Ren D, Zhang X, He Y, Bao C, Liu D, Yi Q, Qian W, Yin J, et al. Clinical characteristics and risk factors of an outbreak with scrub typhus in previously unrecognized areas, Jiangsu province, China 2013. PLoS One. 2015;10(5):e0125999. doi: 10.1371/journal.pone.0125999. [DOI] [PMC free article] [PubMed] [Google Scholar]
- 6.Pedersen UB, Midzi N, Mduluza T, Soko W, Stensgaard AS, Vennervald BJ, Mukaratirwa S, Kristensen TK. Modelling spatial distribution of snails transmitting parasitic worms with importance to human and animal health and analysis of distributional changes in relation to climate. Geospat Health. 2014;8(2):335–343. doi: 10.4081/gh.2014.23. [DOI] [PubMed] [Google Scholar]
- 7.Grinnell J. The niche-relationships of the California thrasher. Auk. 1917;34:427–433. doi: 10.2307/4072271. [DOI] [Google Scholar]
- 8.Chetan N, Praveen KK, Vasudeva GK. Delineating ecological boundaries of Hanuman Langur species complex in peninsular India using MaxEnt modeling approach. PLoS One. 2014;9(2):e87804. doi: 10.1371/journal.pone.0087804. [DOI] [PMC free article] [PubMed] [Google Scholar]
- 9.Elith J, Leathwick JR. Species distribution models: ecological explanation and prediction across space and time. Annu Rev Ecol Evol Syst. 2009;40:677–697. doi: 10.1146/annurev.ecolsys.110308.120159. [DOI] [Google Scholar]
- 10.Qiao HJ, Hu JH, Huang JH. Theoretical basis, future directions, and challenges for ecological niche models. SCIENTIA SINICA Vitae. 2013;43(11):915–927. doi: 10.1360/052013-192. [DOI] [Google Scholar]
- 11.Peterson AT. Ecological niche modeling and spatial patterns of disease transmission. Emerg Infect Dis. 2006;12:1822–1826. doi: 10.3201/eid1212.060373. [DOI] [PMC free article] [PubMed] [Google Scholar]
- 12.Pulliam HR. On the relationship between niche and distribution. Ecol Lett. 2000;3:349–361. doi: 10.1046/j.1461-0248.2000.00143.x. [DOI] [Google Scholar]
- 13.Taylor S, Kumar L, Reid N. Impacts of climate change and land-use on the potential distribution of an invasive weed: a case study of Lantana camara in Australia. Weed Res. 2012;52:391–401. doi: 10.1111/j.1365-3180.2012.00930.x. [DOI] [Google Scholar]
- 14.Kozak KH, Graham CH, Wiens JJ. Integrating GIS-based environmental data into evolutionary biology. Trends Ecol Evol. 2008;23(3):141–148. doi: 10.1016/j.tree.2008.02.001. [DOI] [PubMed] [Google Scholar]
- 15.Elith J, Graham CH, Anderson RP, Dudik M, Ferrier S, Guisan A, Hijmans RJ, Huettmann F, Leathwick JR, Lehmann A, et al. Novel methods improve prediction of species’ distributions from occurrence data. Ecography. 2006;29(2):129–151. doi: 10.1111/j.2006.0906-7590.04596.x. [DOI] [Google Scholar]
- 16.Phillips SJ, Anderson RP, Schapire RE. Maximum entropy modeling of species geographic distributions. Ecol Model. 2006;190(3–4):231–259. doi: 10.1016/j.ecolmodel.2005.03.026. [DOI] [Google Scholar]
- 17.Steven JP, Miroslav D. Modeling of species distributions with Maxent: new extensions and a comprehensive evaluation. Ecography. 2008;31(2):161–175. doi: 10.1111/j.0906-7590.2008.5203.x. [DOI] [Google Scholar]
- 18.Elith J, Steven JP, Trevor H, Miroslav Dudik, Yung EC, Colin JY. A statistical explanation of Maxent for ecologists. Diversity Distrib 2011;17(1):43–57.
- 19.Cory M, Matthew JS, John ASJ. A practical guide to MaxEnt for modeling species’ distributions: what it does, and why inputs and settings matter. Ecography. 2013;36(10):1058–1069. doi: 10.1111/j.1600-0587.2013.07872.x. [DOI] [Google Scholar]
- 20.Wei L, Qian Q, Wang ZQ, Glass GE, Song SX, Zhang WY, Li XJ, Yang H, Wang XJ, Fang LQ, Cao WC. Using geographic information system-based ecologic niche models to forecast the risk of hantavirus infection in Shandong Province. China Am J Trop Med Hyg. 2011;84(3):497–503. doi: 10.4269/ajtmh.2011.10-0314. [DOI] [PMC free article] [PubMed] [Google Scholar]
- 21.Rapacciuolo G, Roy DB, Gillings S, Fox R, Walker K, Purvis A. Climatic associations of British species distributions show good transferability in time but low predictive accuracy for range change. PLoS One. 2012;7(7):e40212. doi: 10.1371/journal.pone.0040212. [DOI] [PMC free article] [PubMed] [Google Scholar]
- 22.Heikkinen RK, Marmion M, Luoto M. Does the interpolation accuracy of species distribution models come at the expense of transfer ability? Ecography. 2012;35:276–288. doi: 10.1111/j.1600-0587.2011.06999.x. [DOI] [Google Scholar]
- 23.Hernandez PA, Graham CH, Master LL, Albert DL. The effect of sample size and species characteristics on performance of different species distribution modeling methods. Ecography. 2006;29(5):773–785. doi: 10.1111/j.0906-7590.2006.04700.x. [DOI] [Google Scholar]
- 24.Peterson AT, Papeş M, Soberón J. Rethinking receiver operating characteristic analysis applications in ecological niche modeling. Ecol Model. 2008;213(1):63–72. doi: 10.1016/j.ecolmodel.2007.11.008. [DOI] [Google Scholar]
- 25.McKay BD, Mays HL, Jr, Peng YW, Kozak KH, Yao CT, Yuan HW. Recent range-wide demographic expansion in a Taiwan endemic montane bird, Steere’s Liocichla (Liocichlasteerii) BMC Evol Biol. 2010;10:71. doi: 10.1186/1471-2148-10-71. [DOI] [PMC free article] [PubMed] [Google Scholar]
- 26.Heikkinen RK, Luoto M, Araújo MB, Virkkala R, Thuiller W, Sykes MT. Methods and uncertainties in bioclimatic envelope modelling under climate change. Progress Physicl Geography. 2006;30(6):751–777. doi: 10.1177/0309133306071957. [DOI] [Google Scholar]
- 27.Sun Y, Fang LQ, Cao WC. Study on the epidemiological characteristics and influencing factors of scrub typhus in the autumn-winter natural foci, from 2006 to 2013. Chin J Epidemiol. 2016;37(8):1112–1116. doi: 10.3760/cma.j.issn.0254-6450.2016.08.012. [DOI] [PubMed] [Google Scholar]
- 28.Zhang SY, Jiang DY, Yu DZ. Endemic characteristics of autumn scrub typhus and the epidemic situation in China. Foreign Medical Science (Section of Medgeography) 2009;30(3):133–135. [Google Scholar]
- 29.Beck LR, Lobitz BM, Wood BL. Remote sensing and human health: new sensors and new opportunities. Emerg Infect Dis. 2000;6(3):217–227. doi: 10.3201/eid0603.000301. [DOI] [PMC free article] [PubMed] [Google Scholar]
- 30.Li TG, Yang ZC, Dong ZQ, Wang M. Meteorological factors and risk of scrub typhus in Guangzhou, southern China, 2006–2012. BMC Infect Dis. 2014;14(1):139. doi: 10.1186/1471-2334-14-139. [DOI] [PMC free article] [PubMed] [Google Scholar]
- 31.Tsai PJ, Yeh HC. Scrub typhus islands in the Taiwan area andthe association between scrub typhus disease and forest land use and farmer population density: geographically weighted regression. BMC Infect Dis. 2013;13:191. doi: 10.1186/1471-2334-13-191. [DOI] [PMC free article] [PubMed] [Google Scholar]
- 32.Zhang LY, Zhao ZT, Bi ZW, Kou ZQ, Zhang M. Risk factors associated with severe scrub typhus in Shandong, northern China. Int J Infect Dis. 2014;29:203–207. doi: 10.1016/j.ijid.2014.09.019. [DOI] [PubMed] [Google Scholar]
- 33.Kuo CC, Huang JL, Ko CY, Lee PF, Wang HC. Spatial analysis of scrub typhus infection and its association with environmental and socioeconomic factors in Taiwan. Acta Trop. 2011;120:52–58. doi: 10.1016/j.actatropica.2011.05.018. [DOI] [PubMed] [Google Scholar]
- 34.Du ZH, Wang ZQ, Liu YX, Wang H, Xue FZ, Liu YX. Ecological niche modeling for predicting the potential risk areas of severe fever with thrombocytopenia syndrome. Int J Infect Dis. 2014;26:1–8. doi: 10.1016/j.ijid.2014.04.006. [DOI] [PubMed] [Google Scholar]
- 35.Yano Y, Shiraishi S, Uchida TA. Effects of temperature on development and growth in the tick Haemaphysalislongicornis. Exp Appl Acarol. 1987;3:73–78. doi: 10.1007/BF01200415. [DOI] [PubMed] [Google Scholar]
- 36.Gray JS, Dautel H, Estrada-Pena A, Kahl O, Lindgren E: Effects of climate change on ticks and tick-borne diseases in europe. Interdisciplinary perspectives on infectious diseases 2009, 2009:593232. [DOI] [PMC free article] [PubMed]
- 37.Samy AM, van de Sande WWJ, Fahal AH, Peterson AT. Mapping the potential risk of Mycetoma infection in Sudan and South Sudan using ecological niche modeling. PLoS Negl Trop Dis. 2014;8:e3250. doi: 10.1371/journal.pntd.0003250. [DOI] [PMC free article] [PubMed] [Google Scholar]
- 38.Manyangadze T, Chimbari MJ, Gebreslasie M, Ceccato P, Mukaratirwa S. Modelling the spatial and seasonal distribution of suitable habitats of schistosomiasis intermediate host snails using Maxent in Ndumo area KwaZulu-Natal Province. S Afr Parasites Vectors. 2016;9:572. doi: 10.1186/s13071-016-1834-5. [DOI] [PMC free article] [PubMed] [Google Scholar]
- 39.Lu L, Ren ZP, Yue YJ, Yu XT, Lu S, Li GC, Li HL, Wei JC, Liu JL, Mu Y, et al. Niche modeling predictions of the potential distribution of Marmotahimalayana, the host animal of plague in Yushu County of Qinghai. BMC Public Health. 2016;16:183. doi: 10.1186/s12889-016-2697-6. [DOI] [PMC free article] [PubMed] [Google Scholar]
- 40.Holt AC, Salkeld DJ, Fritz CL, Tucker JR, Gong P. Spatial analysis of plague in California: niche modeling predictions of the current distribution and potential response to climate change. Int J Health Geogr. 2009;8:38. doi: 10.1186/1476-072X-8-38. [DOI] [PMC free article] [PubMed] [Google Scholar]
- 41.Zeimes CB, Olsson GE, Ahlm C, Vanwambeke SO. Modelling zoonotic diseases in humans: comparison of methods for hantavirus in Sweden. Int J Health Geogr. 2012;11:39. doi: 10.1186/1476-072X-11-39. [DOI] [PMC free article] [PubMed] [Google Scholar]
- 42.Harte J, Newman EA. Maximum information entropy: a foundation for ecological theory. Trends Ecol Evol. 2014;29(7):384–389. doi: 10.1016/j.tree.2014.04.009. [DOI] [PubMed] [Google Scholar]
Associated Data
This section collects any data citations, data availability statements, or supplementary materials included in this article.
Data Availability Statement
The datasets used and/or analysed during the current study are available from the corresponding author on reasonable request.


