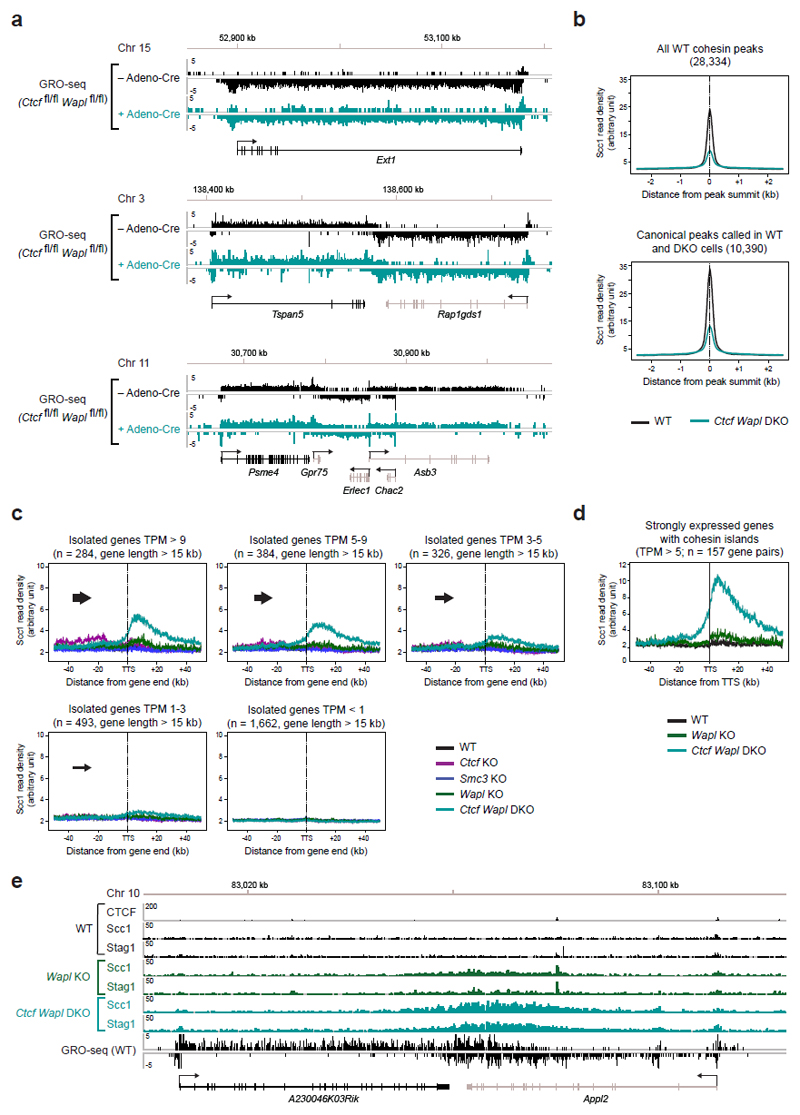
Extended Data Figure 8. Cohesin islands at isolated genes depend on gene transcription.
a, Similar transcriptional activity of individual genes in WT and Ctcf Wapl DKO MEFs. GRO-seq data are shown for three different gene regions in Ctcf fl/fl Wapl fl/fl MEFs before and after Adeno-Cre infection. b. Density profiles of Scc1 accumulation in wild-type and Ctcf Wapl DKO cells at all wild-type cohesin peaks (28,334) or at overlapping canonical peaks (10,390) identified by peak calling in WT and Ctcf Wapl DKO cells. c, The transcriptional activity determines the amount of cohesin accumulation in the 3’ region of isolated genes lacking a neighboring downstream gene. Density profiles of Scc1 binding are shown for 5 groups of genes with decreasing GRO-seq signals (TPM value of > 9, 5-9, 3-5, 1-3 and < 1). d, For better visualization of cohesin islands in Wapl KO cells, we restricted our analysis on genes that were > 15kb in length and highly expressed (TPM > 5). The genes were further filtered based on the presence of a cohesin island in Ctcf Wapl KO cells and based on the absence of any intragenic CTCF site (assuming that a CTCF site might prevent proper cohesin pushing along the DNA). Density profiles of Scc1 in wild-type (WT, black), Wapl KO (green) and Ctcf Wapl KO (turquoise) cells are shown. e, Examples of cohesin islands formation in Wapl KO cells is shown for the A230046K03Rik/Appl2 locus.

