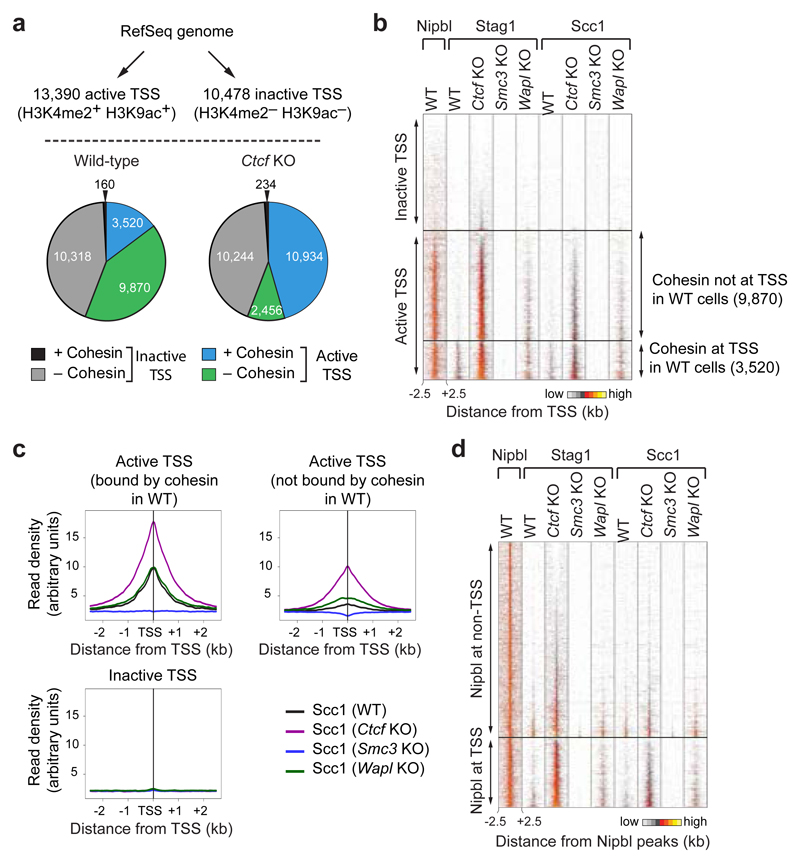
Figure 2. Cohesin redistribution to transcriptional start sites in Ctcf KO MEFs.
a, Cohesin binding at active (H3K4me2+ H3K9ac+) and inactive (H3K4me2– H3K9ac–) TSSs. Pie charts indicate cohesin binding at all annotated TSSs in wild-type and Ctcf KO cells. b, Density heat map of Stag1, Scc1 and Nipbl binding at active and inactive TSSs, data sorted by Stag1 binding in Ctcf KO MEFs. Active TSSs were subdivided based on cohesin binding in wild-type cells (right). c, Density profiles of Scc1 binding at active TSSs, subdivided as in b, and at inactive TSSs in MEFs of the indicated genotypes. d, Density heat map of Nipbl, Stag1 and Scc1 binding at Nipbl sites, which are grouped by TSS localization. Reads sorted according to Stag1 binding in Ctcf KO cells.

