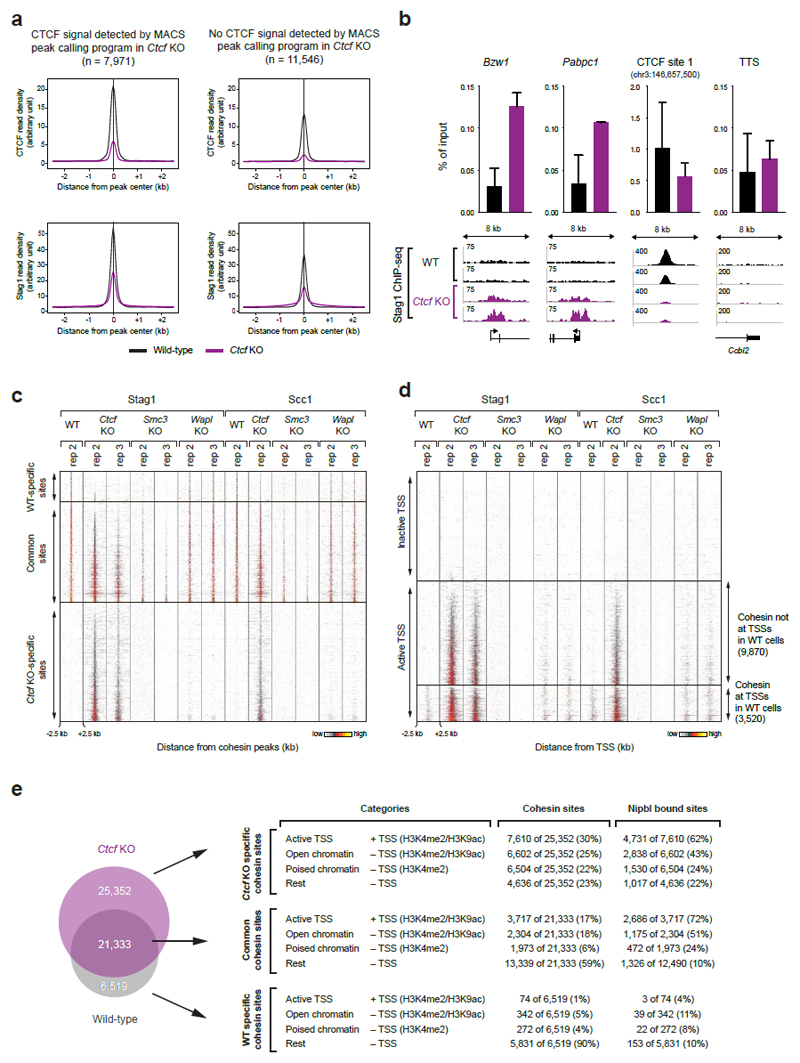
Extended Data Figure 3. Analysis of Ctcf KO-specific cohesin sites.
a, Density profiles of CTCF and Stag1 binding at cohesin sites that are commonly found in WT and Ctcf KO cells. The cohesin sites were subdivided based on the detection or absence of a CTCF peak in Ctcf KO cells as determined by the MACS peak-calling program. b, The enrichment of Stag1 binding (n=2) relative to input is shown for WT (black) and Ctcf KO cells (purple) at two TSSs, one CTCF sites and one transcription termination site (TTS). Two independent biological experiments were performed and normalized values with the corresponding standard deviations were plotted. c-d, Cohesin (Stag1 and Scc1) ChIP-seq data of replica (rep) experiments are shown as density heat maps for (c) active and inactive TSSs and (d) TSS- and non-TSS-associated Nipbl-binding sites. Binding data are shown for a region extending from -2.5 kb to +2.5 kb relative to the cohesin peak summit. Heat maps were sorted according to the density of Stag1 binding in Ctcf KO cells (rep 2). A density scale from low (grey) to high (yellow) is shown. e, Categorization of WT-specific, Ctcf KO-specific and commonly found cohesin sites according to their location at active TSSs (H3K4me2+ H3K9ac+) or non-TSS regions with open chromatin (H3K4me2+ H3K9ac+), poised chromatin (H3K4me2+) and no active chromatin marks (rest). Note that one TSS can bind several cohesin sites. Therefore the number of cohesin-bound TSSs and TSS-bound cohesin sites are not necessarily identical.

